[Preprint]. 2023 Jun 5:2023.06.02.542863.
doi: 10.1101/2023.06.02.542863.

Myeloid cell influx into the colonic epithelium is associated with disease severity and non-response to anti-Tumor Necrosis Factor Therapy in patients with Ulcerative Colitis

Affiliations

Myeloid cell influx into the colonic epithelium is associated with disease severity and non-response to anti-Tumor Necrosis Factor Therapy in patients with Ulcerative Colitis

Divya Jha et al. bioRxiv. .

Abstract

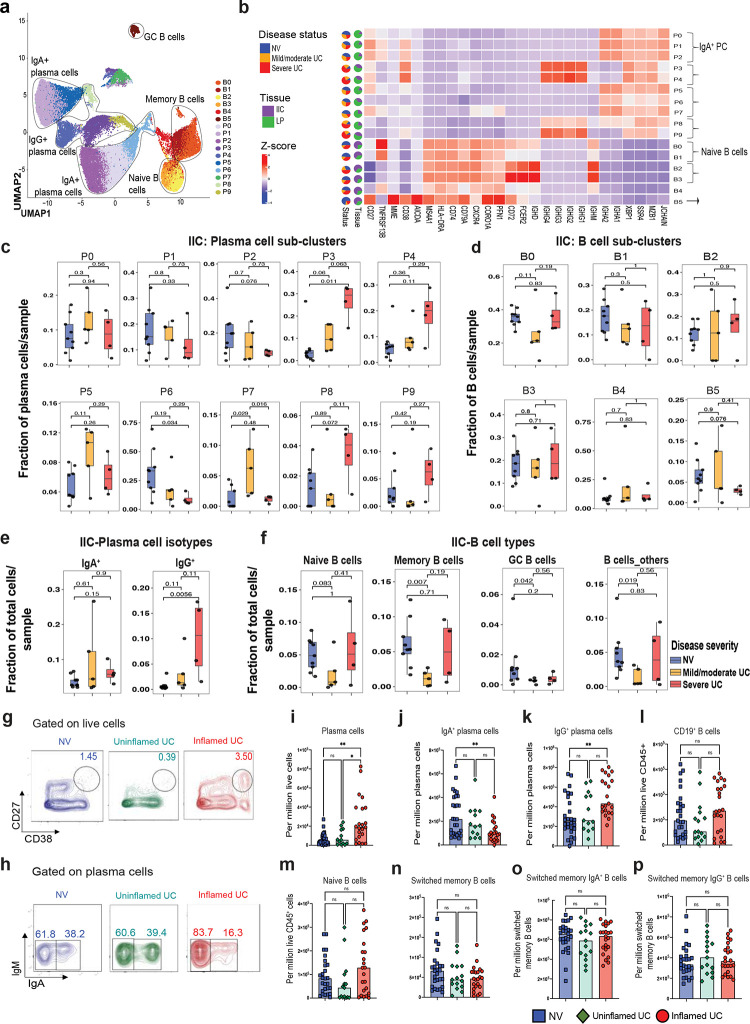
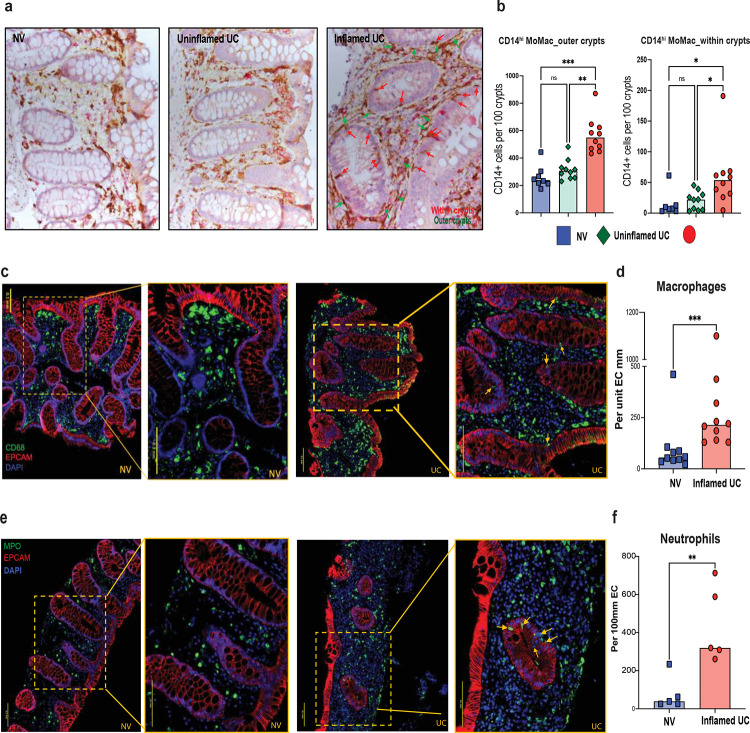
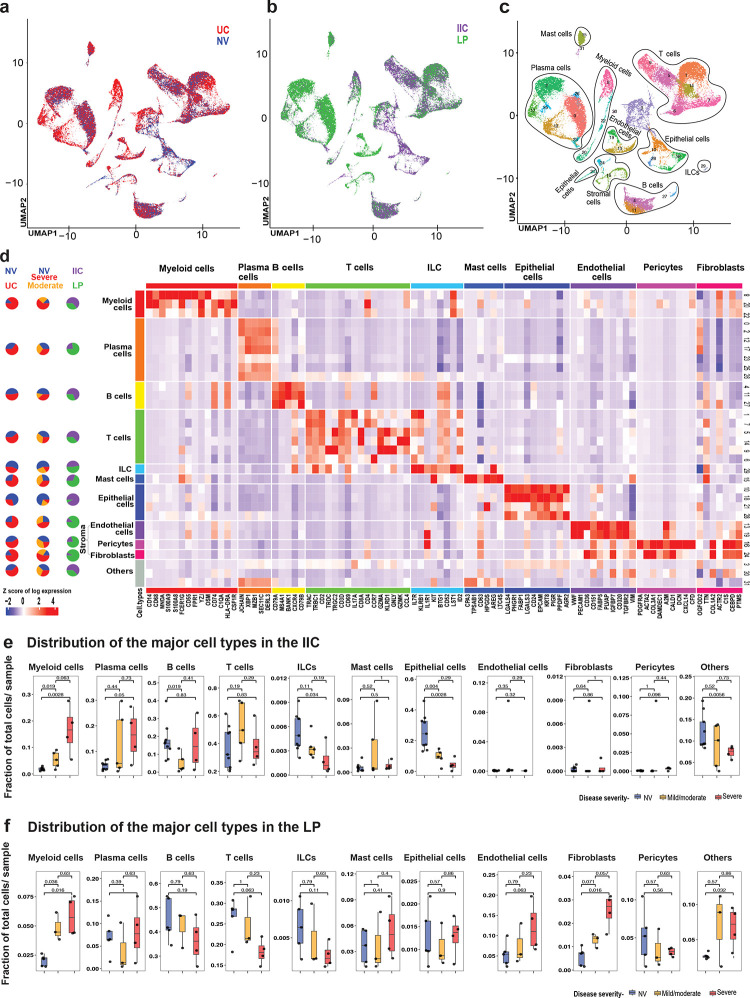
Ulcerative colitis (UC) is an idiopathic chronic inflammatory disease of the colon with sharply rising global prevalence. Dysfunctional epithelial compartment (EC) dynamics are implicated in UC pathogenesis although EC-specific studies are sparse. Applying orthogonal high-dimensional EC profiling to a Primary Cohort (PC; n=222), we detail major epithelial and immune cell perturbations in active UC. Prominently, reduced frequencies of mature BEST4+OTOP2+ absorptive and BEST2+WFDC2+ secretory epithelial enterocytes were associated with the replacement of homeostatic, resident TRDC+KLRD1+HOPX+ γδ+ T cells with RORA+CCL20+S100A4+ TH17 cells and the influx of inflammatory myeloid cells. The EC transcriptome (exemplified by S100A8, HIF1A, TREM1, CXCR1) correlated with clinical, endoscopic, and histological severity of UC in an independent validation cohort (n=649). Furthermore, therapeutic relevance of the observed cellular and transcriptomic changes was investigated in 3 additional published UC cohorts (n=23, 48 and 204 respectively) to reveal that non-response to anti-Tumor Necrosis Factor (anti-TNF) therapy was associated with EC related myeloid cell perturbations. Altogether, these data provide high resolution mapping of the EC to facilitate therapeutic decision-making and personalization of therapy in patients with UC.

Keywords: RNA sequencing; Ulcerative colitis; anti-TNF treatment response; intraepithelial compartment; spatial transcriptomics.


Conflict of interest statement

Competing interests: SM reports receiving research grants from Genentech and Takeda; receiving payment for lectures from Takeda, Genentech, Morphic; and receiving consulting fees from Takeda, Morphic, Ferring and Arena Pharmaceuticals. JM reports receiving consulting fees from Janssen Pharmaceuticals. JFC reports receiving research grants from AbbVie, Janssen Pharmaceuticals, Takeda and Bristol Myers Squibb; receiving payment for lectures from AbbVie, and Takeda; receiving consulting fees from AbbVie, Amgen, AnaptysBio, Allergan, Arena Pharmaceuticals, Boehringer Ingelheim, Bristol Myers Squibb, Celgene Corporation, Celltrion, Eli Lilly, Ferring Pharmaceuticals, Galmed Research, Glaxo Smith Kline, Genentech (Roche), Janssen Pharmaceuticals, Kaleido Biosciences, Immunic, Invea, Iterative Scopes, Merck, Landos, Microba Life Science, Novartis, Otsuka Pharmaceutical, Pfizer, Protagonist Therapeutics, Prometheus, Sanofi, Seres, Takeda, Teva, TiGenix, Vifor; and hold stock options in Intestinal Biotech Development. JM reports receiving consulting fees from Janssen Pharmaceuticals. RCU has served as an advisory board member or consultant for AbbVie, Bristol Myers Squibb, Celltrion, Janssen, Pfizer, Roivant, and Takeda; research support from AbbVie, Boehringer Ingelheim, Eli Lily, and Pfizer. MK has served as a consultant for AbbVie, Pfizer, Bristol Myers Squibb, Fresenius, GoodRx.

Figures

Extended Data Fig. 1:
Extended Data Fig. 1:. Outline of the patients and samples included in the study.
Extended Data Fig. 2:
Extended Data Fig. 2:. Association of IICinf GSVA activity scores in biopsies from the Validation Cohort-1/ VC-1 stratified by inflammation status and disease severity.
a, Expression of IICinf GSVA activity scores of the inflamed UC samples from the Primary Cohort (PC) in the inflamed UC, uninflamed UC samples and NV (control) samples in the VC-1. b, Association of the mean marginal expression for GSVA score of IICinf genes from PC with clinical severity in VC-1. c, Association of mean marginal expression for GSVA score of IICinf genes with endoscopic severity in VC-1. d, Association of mean marginal expression for GSVA score of IICinf genes with histologic severity in VC-1. Up and down indicate direction associated with inflammation.
Extended Data Fig. 3:
Extended Data Fig. 3:. Distribution of T cell types in the LP in patients with active UC and pathway analysis of IELs.
a, Boxplots showing the distribution of per-sample relative fractions within the T cell compartment of different sub-clusters in LP stratified by disease severity. Fractions are computed with respect to all T cells in each sample. P-values from Wilcoxon signed-rank test are reported. b, Boxplots of per-sample fractions of TH17, TREG, γδ+ IELs, cytotoxic CD8+ T, memory and naïve T cells stratified by disease severity in LP. Fractions are computed with respect to the total number of all cells in each sample. P-values from Wilcoxon signed-rank test are reported. c, Flow cytometry-based quantification of the frequencies of αβ+ T cells and CD8+ αβ+ T cells. **p<0.01,****p<0.0001. d, Immunohistochemical (IHC) staining showing the infiltration of CD4+ T cells (pink cells) within the EC. Representative sections from an inflamed UC biopsy (black arrows, right panel) uninflamed UC biopsy (middle panel) and NV biopsy (left panel) are shown. e, Bar plot comparing intraepithelial CD4+ T cell count between NV, uninflamed UC and inflamed UC samples, based on IHC staining. P-values from one-way ANOVA test are reported, ns=not significant, *p<0.05; ***p<0.001. f, Heat map shows pathway enrichment analysis from IELs in UC versus NV samples. The bubble plot on the left side of the figure shows the summary statistics from pathway analysis; with the size of the bubble corresponding to the enrichment score (ES) while the bubble color to the signed −log10 adjusted p-value. The heatmap at the right side shows the log fold change between UC and NV for the top five leading edge genes in each pathway.
Extended Data Fig. 4:
Extended Data Fig. 4:. IL-17 and IL-22 stimulation led to proinflammatory transcriptional reprogramming of healthy colonic tissue.
a, Methodological approach adopted to examine the effect of IL-17 and IL-22 stimulation on colonic intestinal biopsies. b, Volcano plots depicting top differentially expressed genes post- IL-22, IL-17 and IL17+ IL-22 stimulation of colonic biopsies derived from RNA sequencing. c, Cell types corresponding to the DEGs from RNA sequencing done on colonic biopsies stimulated by lL-17 + IL-22 cytokines. d, Heatmap showing biological functions for gene expression levels for up-regulated genes after colonic biopsies were stimulated with medium containing IL-17 and IL-22 compared to medium only. e, Correlation plots for IL17 and IL22 gene expression in VC-1 with the GSVA scores of IL17+IL22 signature (up-regulated genes) from the ex-vivo experiment using Pearson’s correlation. f, Box plots indicating GSVA scores of up-regulated IL-17+IL-22 signature post stimulation of colonic tissues in VC-1 cohort stratified by inflammation status (NV, uninflamed and inflamed samples from UC patients) used estimated marginal means using lsmeans function from emmeans R package. g, Heatmap showing the expression of the IL-17+ IL-22 signature per intestinal segment (large intestine) in VC-1. h, Venn diagram showing the intersection of genes that were up-/down-regulated by IL-17+IL-22 stimulation and intersecting DEGs common to Epiinf and IICinf (as shown in Fig. 1d) using Fisher’s Exact Test.
Extended Data Fig. 5:
Extended Data Fig. 5:. Distribution of myeloid cell types in the LP in patients with active UC and pathway analysis of IIC enriched myeloid cell types.
a, Boxplots showing the distribution of per-sample relative fractions within the myeloid cell compartment of different sub-clusters in LP stratified by disease severity. Fractions are computed with respect to all myeloid cells in each sample. P-values from Wilcoxon signed-rank test are reported. b, Boxplots of per-sample fractions of myeloid cell types (i.e. Neutrophils, MoMac, Macrophages and DCs) stratified by disease severity in LP. Fractions are computed with respect to the total number of all cells in each sample. P-values from Wilcoxon signed-rank test are reported. c, Flow cytometry comparing of EC-associated neutrophils and LP-associated neutrophils in the UC samples. d, Pathway enrichment analysis of epithelium-enriched myeloid cells in UC samples compared to NV samples. The bubble plot on the left side of the figure shows the summary statistics from pathway analysis; with the size of the bubble corresponding to the enrichment score (ES) while the bubble color to the signed −log10 adjusted p-value. The heatmap at the right side shows the log fold change between UC and NV for the top five leading edge genes in each pathway.
Extended Data Fig. 6:
Extended Data Fig. 6:. Altered transcriptomic profiles of plasma cells and B cells in active UC patients and NV.
a, UMAP of plasma cells and B cells from NV (n=9) and active UC (n=9) colonic biopsies by unsupervised clustering to demonstrate 10 plasma cell sub-clusters and 6 B cell sub-clusters. b, Heatmap showing the average expression z-scores of plasma cells and B cells defining genes for each sub-cluster. The sub-cluster composition in terms of intestinal compartments (IIC and LP), and disease severity (NV, mild/moderate UC and severe UC) is depicted in the pie charts on the right side of the heatmap. c-d, Boxplots showing the distribution of plasma cell sub-clusters (c) and B cell subclusters (d) in the IIC stratified by disease severity. Fractions are computed with respect to all plasma (c) or B (d) cells in each sample. P-values from Wilcoxon signed-rank test are reported. e-f, Boxplots showing the distribution of per-sample fractions of plasma cell isotypes, IgA+ and IgG+ (e), and naïve, memory, GC and unclassified (other) B cell subtypes (f) in the IIC stratified by disease severity. Fractions are computed with respect to the total number of all cells in each sample. P-values from Wilcoxon signed-rank test are reported. g-h, Representative flow cytometry plots to identify plasma cell types in NV, uninflamed UC and inflamed UC samples. i-p, Bar plots showing frequencies of plasma cells (i), IgA+ plasma cells (j), IgG+ plasma cells (k),B cells (l) and B cell types (naïve (m), switched memory (n), switched memory IgA+ (o) and switched memory IgG+ B cells (p) in healthy and inflamed samples. P-values from Kruskal-Wallis tests are reported. **p<0.01, *p<0.05.
Extended Data Fig. 7:
Extended Data Fig. 7:. Neutrophils, monocytes and macrophages penetrate the colonic epithelium in patients with active UC.
a, IHC staining showing the infiltration of CD14+ myeloid cells (in brown) within the EC of active UC patients (right) at the inflamed sites in comparison to the uninflamed sites (middle) and NV samples (left). Red arrows indicate the CD14+ cells entering the crypts and green arrows indicate the CD14+ cells surrounding the crypts. b, Bar plots comparing CD14+ cells surrounding the intestinal crypts (left) and CD14+ cells entering the crypts (right) between inflamed UC-, uninflamed UC- and NV-derived colonic tissues. P-values from one-way ANOVA test are reported. ***p<0.001, **p<0.01, *p<0.05, ns-p>0.05. c, IF staining depicting the expression of CD68 (green), EPCAM (red), DAPI (blue) in NV (left, 10X and 20X magnification) and UC (right, 10X and 20X magnification) samples. d, Bar plots comparing epithelium associated macrophages between inflamed UC and NV-derived tissues. P-value from Mann-Whitney test is reported. ***p<0.001. e, IF staining depicting the expression of MPO (green), EPCAM (red) and DAPI (blue) in NV (left, 10X and 20X magnification) and UC (right, 10X and 20X magnification) samples. f, Bar plot comparing epithelium-associated neutrophils between inflamed UC and NV-derived tissues. P-value from Mann-Whitney test is reported. **p<0.01.
Extended Data Fig. 8:
Extended Data Fig. 8:. Down-regulated IICinf signature associates with non-response to anti-TNF therapy.
a, Estimated marginal means (mean ± SEM) for the activity (GSVA scores) of the down-regulated IICinf signatures at baseline and after 6 weeks (in VC-2) or 8 and 30 weeks (in VC-3) and 10 weeks (in VC-4) of anti-TNF therapy (Infliximab (IFX) in VC-2 and IFX 5 mg/kg and 10 mg/kg in VC-3); ADA in VC-4 and placebo. b, IFX-induced changes in down-regulated IICinf signature in responders (R) and non-responders (NR), where treatment response was defined by mucosal healing in VC-2, clinical response in VC-3 and endoscopic response in VC-4. P-values above the error bars denote significant change from baseline within the group at each time point, while p-values at the top indicate that treatment changes over time are significantly different between treatment groups (a-b) or R vs NR (c-d), * p< 0.05; ** p< 0.01; *** p< 0.001. c-d, Estimated marginal means (mean ± SEM) for the activity (GSVA scores) of the down-regulated Epiinf subtype signatures at baseline and after 6 weeks (c, in VC-2) or 8 and 30 weeks (d, in VC-3) of anti-TNF therapy (Infliximab (IFX) in VC-2 and IFX 5 mg/kg and 10 mg/kg in VC-3) and placebo. e-f, Effect of anti-TNF therapy on the activity (GSVA scores) of the epithelial cell subtype signatures in VC-2 (e) and VC-3 (f) in R and NR.
Extended Data Fig. 9:
Extended Data Fig. 9:. Effect of anti-TNF therapy on cell types in VC-2, VC-3 and VC-4 cohorts in patients on anti-TNF.
a,c, Effect of anti-TNF therapy on the activity of cell-type signatures derived from scRNA-seq between active treatment and placebo in VC-2 (a) and VC-3 (c). b,d,e, Effect of anti-TNF therapy on the activity of cell-type signatures derived from scRNA-seq between responders (R) and non-responders (NR) in VC-2 (b) ,VC-3 (d) and VC-4 (e). Gene activity is assessed by GSVA scores from scRNA-seq derived cell type signatures. Connecting line shows p-value<0.05 between R and NR at respective timepoints.
Fig. 1:
Fig. 1:. Intraepithelial immune compartment is extensively remodeled in active UC.
a, Experimental design outlining the methodologies and assays used. b, Left; Principal component analysis (PCA) plot of the epithelial compartment (Epibulk) expression profiles from the healthy (blue) (n=6), uninflamed (green) (n=4), and inflamed (red) (n=5) biopsies. Right; Venn diagram showing the differentially expressed genes (DEGs) from inflamed UC samples compared to NV samples (blue) and the DEGs from inflamed UC samples compared to the uninflamed UC samples (green). Up-regulated DEGs are in red while down-regulated DEGs in blue. c, Left; PCA plot of the intraepithelial immune cells (IICbulk) RNA-seq expression profiles of the samples from the IIC from the healthy (blue) (n=6), uninflamed (green) (n=4), and inflamed (red) (n=5) biopsies. Right; Venn diagram showing the DEGs from inflamed UC samples compared to NV samples (blue) and the DEGs from inflamed UC samples compared to the uninflamed UC samples (green). Up-regulated DEGs are in red while down-regulated DEGs are in blue. d, Venn diagram showing the intersection of inflamed vs uninflamed UC DEGs from the Epibulk and IICbulk. e-f, Overexpression analysis (ORA) of DEGs between inflamed and uninflamed UC samples interrogated from the cell type signature for selected significantly (adj-p<0.05) enriched cell types (e) and KEGG pathways (f). Color intensity represents −log10 transformed p-adjusted and the size represents the log2 transformed Odds Ratio (OR) using Fisher’s exact test. OR from enrichments with <5 IICinf DEG are not presented. g, Heatmap depicting expression profiles of 42 DEGs selected for relevance with disease pathogenesis among the DEGs in the intersection of Fig.1d. h, Association of the IICinf signature with UC disease and severity in the validation cohort-1 (VC-1). Each plot in h represents the estimated marginal mean expression and 95% CI for the GSVA-scores of the up-regulated genes in the IICinf signature across conditions. Upper left; Activity of IICinf signature in endoscopically inflamed colon compared to uninflamed biopsies of IBD patients and non-IBD normal volunteers (NV) from VC-1 cohort using fora function from fgsea R package. Upper right; The mean activity of up-regulated DEGs from IICinf signature was compared between clinically active IBD patients compared to IBD patients with no active disease and was also associated with endoscopic scores. Lower; Activity of IICinf up-regulated genes was associated with histological scores (measured by Nancy score 0–4) of endoscopically inflamed biopsies (red) and uninflamed biopsies (blue) from UC patients using Pearson’s correlation test *p ≤ 0.05; **p ≤ 0.01; ***p ≤ 0.001; ****p ≤ 0.0001 (ic test and BH-adjusted p-value). i, Heatmap showing the expression of the top 20 genes (among DEGs in inflamed versus uninflamed or NV comparisons) correlated with histological disease severity (Nancy index 0–4) measured from endoscopically inflamed gut biopsies of UC patients in VC-1 cohort.
Fig. 2:
Fig. 2:. High-resolution mapping of immune cells reveals distinct cellular composition in the colonic EC of ulcerative colitis patients.
a-c, UMAP of scRNA-seq data colored by a, disease status (i.e., UC samples (n=9) and NV samples (n=9)), b, intraepithelial immune cells (IIC) and lamina propria (LP) compartments, c, 32 cell-type annotated clusters identified by unsupervised clustering d, Heatmap showing the average z-score normalized log expression of canonical cell type markers across different clusters. Pie charts on the left indicate overall composition for each cell type, in terms of disease status, severity and tissue compartments. e-f, Boxplots of per-sample cell type fractions in IIC (e) and LP (f), stratified by disease status and severity. NV (blue), mild/moderate UC (orange) and severe UC samples (red). P-values from Wilcoxon signed-rank test are reported.
Fig.3:
Fig.3:. Active UC is associated with depletion of homeostatic γδ+ IELs and influx of proinflammatory TH17 cells into the EC.
a, UMAP of T cells from NV (n=9) and active UC (n=9) colonic biopsies colored by 10 sub-clusters identified via unsupervised clustering. b, Heatmap showing average z scores of log normalized expression of the T cell sub-clusters defining key genes. The sub-cluster composition in terms of intestinal compartments (IIC and LP), and disease severity (NV, mild/moderate UC and severe UC) is depicted in the pie charts on the left side. c, Boxplots showing the distribution of per-sample relative fractions of T cell sub-clusters in the IIC stratified by disease severity. Fractions are computed with respect to all T cells in each sample. P-values from Wilcoxon signed-rank test are reported. d, Boxplots of per-sample fractions of TH17, TREG, γδ+ IELs, cytotoxic CD8+ T, memory and naïve T cells stratified by disease severity in IIC. Fractions are computed with respect to the total number all cells in each sample. P-values from Wilcoxon signed-rank test are reported. e-h, Representative flow cytometry plots to identify γδ+ (e) and CD4+αβ+ IELs (g) in NV, uninflamed UC and inflamed UC samples. Bar plots depicting the frequencies of γδ+ IELs (f), the frequencies of CD4+ αβ+ IELs (h, left) and CD4:CD8 ratio (h, right) in the inflamed samples compared to the uninflamed UC and NV samples. Cells were gated on live singlet CD45+CD3+ and on live singlet CD45+CD3+TCRαβ+ respectively. P-values from one-way ANOVA test are reported. ****p<0.0001. i, Immunofluorescence (IF) staining for CD4+ T cells (green), EPCAM (red) and DAPI (blue) in formalin-fixed paraffin embedded colonic sections derived from NV (left, 10X and 20X magnification) and patients with UC (right, 10X and 20X magnification). j, IF- based quantification of CD4+ T cells within the epithelial compartment with p-values computed using Mann Whitney test. ****p<0.0001.
Fig. 4:
Fig. 4:. Active UC is associated with a major influx of pro-inflammatory myeloid cells into the EC.
a, UMAP of myeloid cells from NV (n=9) and active UC (n=9) colonic biopsies colored by 10 sub-clusters (M0-M9). b, Heatmap showing the average z-scores of log transformed expression for myeloid sub-clusters defining genes. The sub-cluster composition in terms of intestinal compartments (IIC and LP), and disease severity (NV, mild/moderate UC and severe UC) is depicted in the pie charts on the left side. c, Boxplots showing the distribution of per-sample relative fractions of myeloid sub-clusters (M0-M9) in IIC stratified by disease severity. Fractions are computed with respect to all myeloid cells in each sample. P-values from Wilcoxon signed-rank test are reported. d, Boxplots showing the distribution of per-sample fractions of myeloid cell subtypes (i.e., neutrophils, MoMac, macrophages and DC) in the IIC stratified by disease severity. Fractions are computed with respect to the total number of all cells within each sample. P-values from Wilcoxon signed-rank test are reported. e, Representative flow cytometry plots identifying CD14hi MoMac, CD16hi MoMac, eosinophils and neutrophils in NV, uninflamed UC and inflamed UC samples. f, Bar plots show an increased frequency of CD14hi MoMac (left) and neutrophils (right) in the epithelial compartment from inflamed UC samples compared to uninflamed UC and NV samples.
Fig. 5:
Fig. 5:. Spatial transcriptomics (ST) reveals depletion of epithelial subtypes and enhanced cell-cell interactions within colonic tissues of patients with UC.
a, Spatial distribution of enrichment scores of neutrophils, T cells, epithelial absorptive and epithelial secretory in the four ST samples. b, Cell type fractions obtained via deconvolution. Spatial distribution of cell types, represented as cell type fraction pie charts at each spatial location in representative inflamed and healthy colonic biopsies. The spot diameter is 55μm and center-to-center distance between the spots is 100μm. Bar plot (right) showing the average fraction across all spatial spots inferred via deconvolution analysis for each sample. c, Per-sample distribution across spatial spots of enrichment scores and cell-type fractions inferred via deconvolution analysis for different cell types. d, Cell-cell co-localization analysis for NV samples (left panel) and UC samples (right). For significantly enriched co-localization pairs, the relative effect magnitude is represented by the bubble size (log2 fold change) while the significance by the bubble color (−log10 p-value). Co-localized cell type pairs detected in both NV samples and not in UC samples are highlighted with a square, while those detected in both UC samples only by a circle. e, Scatterplots showing enrichment scores from ST data of neutrophils and epithelial absorptive (y-axis) versus IL-17+ IL-22 gene signatures (x-axis) across spatial spots. For each scatterplot, Pearson’s correlation and corresponding correlation test p-values are shown. These statistics were separately derived for each sample.
Fig. 6:
Fig. 6:. Persistence of myeloid cell and plasma cell signatures in the EC associates with anti-TNF treatment non-response in three distinct validation cohorts.
a, Changes in score (mean ± SEM) for the activity (GSVA scores) of the IICinf signatures at baseline and after 6 weeks (in VC-2, left) or 8 and 30 weeks (in VC-3, middle) of anti-TNF therapy (Infliximab (IFX) in VC-2 and at week 10 (in validation cohort 4, VC-4, right) after adalimumab (ADA) therapy. b, IFX-induced changes in IICinf signatures responders (R) and non-responders (NR), where treatment response was defined by mucosal healing in VC-2, clinical response in VC-3 and by endoscopic remission in VC-4. Changes with treatment were modeled using LMEM and comparisons tested using contrasts (emmeans package in R). p values above the error bars denote significant change from baseline within the group at each time point, while p-values at the top indicate that treatment changes over time are significantly different between R vs NR, * p< .05; ** p< .01; *** p< .001 c, Boxplots showing the average z-score of IICinf up- and down-regulated response signatures (methods) based on the transcriptomic profile of each cell from scRNA-seq derived cell types. For each cell type, we report one-sided AUC reflecting the specific z-score to discriminate between that cell type and the rest of the cell types. d, Heatmap representing the expression profile of the IICinf IFX-response signature that overlaps with scRNA-seq derived cell type signatures in VC-3. On the left side of the heatmap [IICinf (UC vs NV) scRNA-seq], the status of the gene in the differential expression analysis comparing UC vs NV profiles for each cell type is indicated (up-regulated (red) or down-regulated (blue). e, Differential anti-TNF effect between R and NR for the activity (GSVA scores) of cell-type scRNA-seq derived signatures in VC-3 and VC-4 cohorts. Bar plots indicate −log10(p-values) for the comparison of the changes (from W0) in scores between R and NR at respective time points (W8, W10, W30). The dashed line indicates p-value=0.05, indicating a significant change in R vs NR at W30 with respect to W0. f, Estimated marginal mean for the GSVA scores of scRNA-seq derived cell types that were significantly different between R and NR at week 30 from the start of IFX therapy at dose 5 mg/kg. g, Alluvial plots showing the pathway ORA for the leading-edge genes (LEGs) of each cell type (only those associated with IFX response in f are shown) using mSigDB Hallmark80 database. Color density denotes adjusted p-values while the band width denotes odds ratio of the pathway enrichment.

References

    1. Ungaro R., Mehandru S., Allen P.B., Peyrin-Biroulet L. & Colombel J.F. Ulcerative colitis. Lancet 389, 1756–1770 (2017). - PMC - PubMed
    1. Liang S., et al. Nutrient Sensing by the Intestinal Epithelium Orchestrates Mucosal Antimicrobial Defense via Translational Control of Hes1. Cell Host Microbe 25, 706–718 e707 (2019). - PubMed
    1. Kopf A. & Sixt M. Gut Homeostasis: Active Migration of Intestinal Epithelial Cells in Tissue Renewal. Curr Biol 29, R1091–R1093 (2019). - PubMed
    1. Di Marco Barros R., et al. Epithelia Use Butyrophilin-like Molecules to Shape Organ-Specific gammadelta T Cell Compartments. Cell 167, 203–218 e217 (2016). - PMC - PubMed
    1. Hoytema van Konijnenburg D.P., et al. Intestinal Epithelial and Intraepithelial T Cell Crosstalk Mediates a Dynamic Response to Infection. Cell 171, 783–794 e713 (2017). - PMC - PubMed

Publication types