[Preprint]. 2023 Jun 9:2023.06.09.544291.
doi: 10.1101/2023.06.09.544291.

Spatial Mapping of Mobile Genetic Elements and their Cognate Hosts in Complex Microbiomes

Affiliations

Spatial Mapping of Mobile Genetic Elements and their Cognate Hosts in Complex Microbiomes

Benjamin Grodner et al. bioRxiv. .

Update in

Abstract

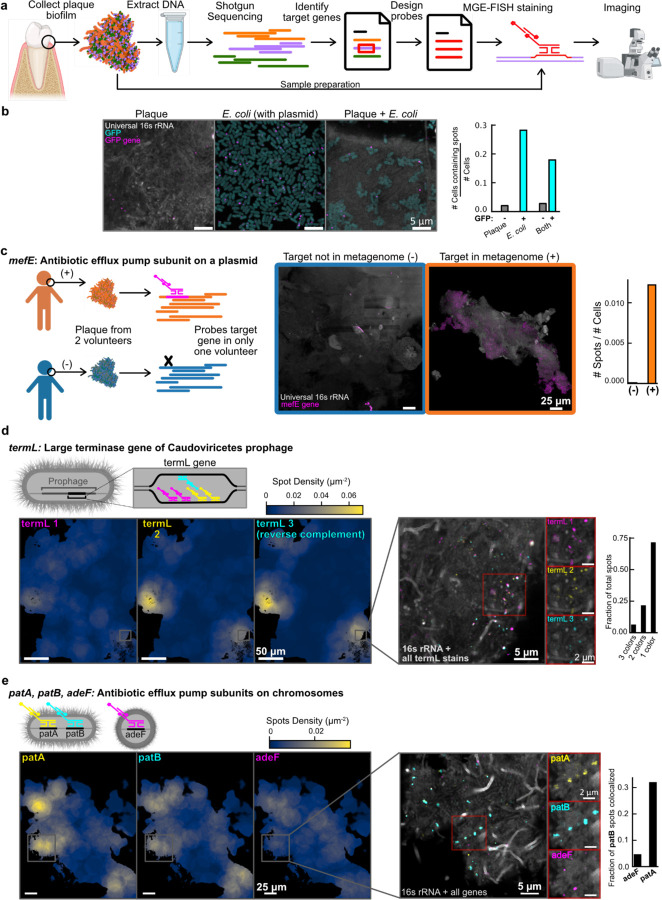
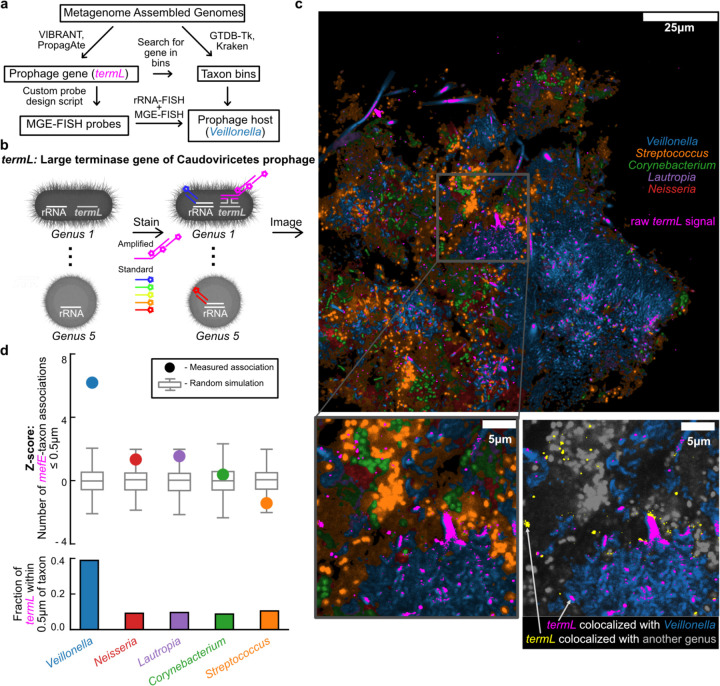
The frequent exchange of mobile genetic elements (MGEs) between bacteria accelerates the spread of functional traits, including antimicrobial resistance, within the human microbiome. Yet, progress in understanding these intricate processes has been hindered by the lack of tools to map the spatial spread of MGEs in complex microbial communities, and to associate MGEs to their bacterial hosts. To overcome this challenge, we present an imaging approach that pairs single molecule DNA Fluorescence In Situ Hybridization (FISH) with multiplexed ribosomal RNA FISH, thereby enabling the simultaneous visualization of both MGEs and host bacterial taxa. We used this methodology to spatially map bacteriophage and antimicrobial resistance (AMR) plasmids in human oral biofilms, and we studied the heterogeneity in their spatial distributions and demonstrated the ability to identify their host taxa. Our data revealed distinct clusters of both AMR plasmids and prophage, coinciding with densely packed regions of host bacteria in the biofilm. These results suggest the existence of specialized niches that maintain MGEs within the community, possibly acting as local hotspots for horizontal gene transfer. The methods introduced here can help advance the study of MGE ecology and address pressing questions regarding antimicrobial resistance and phage therapy.

Keywords: antimicrobial resistance; bacteriophage; microbial ecology; microbiome; mobile genetic elements; multiplexed imaging; phage therapy; plasmid; single molecule FISH.


Conflict of interest statement

Competing interests H.S. is a co-founder at Kanvas Biosciences. I.D.V. is a member of the Scientific Advisory Board of Karius Inc., and GenDX and co-founder of Kanvas Biosciences. H.S. and I.D.V. are listed as inventors on patents related to multiplexed imaging methods.

Figures

Figure 1.
Figure 1.. Single-molecule MGE FISH.
a Diagram of E. coli model GFP plasmid system used to optimize smFISH. b Panel i: diagrams of different methods implemented. Blue cells on the left are wild type and orange cells on the right are transformed with the plasmid. After the first row, two encoding probes are shown to represent ten encoding probes in all cases. Panel ii: representative images for each method alteration. Scale bar is 5µm. Panel iii: fraction of cells with spots for control and plasmid images as a function of signal to noise ratio. Black vertical line indicates the selected SNR threshold. TPR: true positive rate; FPR: false positive rate (at the threshold). Panel iv: histograms for the number of spots in each cell. Width indicates the frequency of the spot count value. Horizontal red bars indicate mean spot count. c Left: Diagram of MGE-FISH staining of E. coli infected by T4 Phage. Center: example images for four multiplicities of infection 20 minutes and 30 minutes after introducing phage to the culture. Right: results of manual counting to classify cells into groups based on the number of MGE-FISH spots.
Figure 2.
Figure 2.. MGE-FISH in human oral plaque.
a Diagram of the workflow to apply MGE-FISH in oral plaque biofilms. b Left: Example images of standard plaque, transformed E. coli expressing GFP, and the combination of both plaque and E. coli. All samples were stained for the GFP gene using MGE-FISH. Right: association of MGE-FISH signal with GFP cells and non-GFP cells in each sample. c Left: Diagram of two-volunteer control experiment. Center: example images of plaque samples from each volunteer stained for the mefE gene. Right: measurement of relative spot count for each volunteer. d Top left: diagram showing the multicolor approach used to stain the gene termL. Bottom left: example FOV plotted as density maps for each color of termL probes. Inset 1: zoomed region of the plaque overlaid with all colors of termL stain. Inset 2: zoomed region of plaque split into each color of termL probes. Right: measurements of termL color colocalization normalized as the fraction of total spots. e Top left: diagram showing the multicolor approach used to simultaneously stain the genes patA, patB, and adeF. Bottom left: example FOV plotted as density maps for each gene. Inset 1: zoomed region of the plaque overlaid with all colors. Inset 2: zoomed region of plaque split by gene. Right: measurement of colocalization of patB spots with each other gene normalized as the fraction of patB spots colocalized.
Figure 3.
Figure 3.. Combined MGE and taxonomic mapping.
a Workflow for orthogonal prophage host association predictions via metagenomic sequencing analysis or MGE-FISH with rRNA-FISH taxon mapping. b Diagram showing simultaneous taxon mapping and MGE mapping. c Top: Bacterial genera classified by rRNA-FISH overlaid with the raw signal from MGE-FISH on termL. Bottom left: zoomed region of rRNA-FISH overlaid with MGE-FISH. Bottom right: zoomed region showing only Veillonella (blue) and termL (magenta and yellow) in color, while all other cells are grayscale. The arrows indicate examples of termL signal colocalized with Veillonella in magenta, and termL signal colocalized with another genus in yellow. d Top: z-scores for the number of associations between termL and each genus (circles) compared to simulation of random distributions of the same spots (boxplots, 1000 simulations). Bottom: fraction of termL spots associated with each taxon. Association of a cell with a spot is defined as separation less than or equal to 0.5μm.
Figure 4.
Figure 4.. Identification of the host taxon of an AMR plasmid.
a Diagram illustrating simultaneous HiPR-FISH combinatorial spectral barcoding and MGE-FISH. b Top left: Overlay of bacterial genera classified by HiPR-FISH and mefE mapped by MGE-FISH. Top right: taxon color legend for HiPR-FISH classification. Bottom left: zoomed region of HiPR-FISH overlaid with MGE-FISH. Bottom right: zoomed region showing only Veillonella (peach) and mefE (magenta and yellow) in color, while all other cells are grayscale. The arrows indicate examples of mefE signal colocalized with Veillonella in magenta, and mefE signal colocalized with another genus in yellow. c Top: z-scores for the number of associations between mefE and each genus (circles) compared to simulation of random distributions of the same spots (boxplots, 1000 simulations). Middle: fraction of mefE spots associated with each genus. Bottom: fraction of each genus associated with mefE spots. Association of a cell with a spot is defined as separation less than or equal to 0.5μm.

References

    1. Munita J. M. & Arias C. A. Mechanisms of Antibiotic Resistance. in Virulence Mechanisms of Bacterial Pathogens 481–511 (John Wiley & Sons, Ltd, 2016). doi: 10.1128/9781555819286.ch17. - DOI
    1. Khan Mirzaei M. & Deng L. New technologies for developing phage-based tools to manipulate the human microbiome. Trends Microbiol. 30, 131–142 (2022). - PubMed
    1. Rasmussen T. S. et al. Bacteriophage-mediated manipulation of the gut microbiome – promises and presents limitations. FEMS Microbiol. Rev. 44, 507–521 (2020). - PubMed
    1. Gordillo Altamirano F. L. & Barr J. J. Phage Therapy in the Postantibiotic Era. Clin. Microbiol. Rev. 32, 10.1128/cmr.00066-18 (2019). - DOI - PMC - PubMed
    1. Penders J., Stobberingh E., Savelkoul P. & Wolffs P. The human microbiome as a reservoir of antimicrobial resistance. Front. Microbiol. 4, (2013). - PMC - PubMed

Publication types