[Preprint]. 2023 Jun 11:2023.06.09.544407.
doi: 10.1101/2023.06.09.544407.

13C metabolite tracing reveals glutamine and acetate as critical in vivo fuels for CD8+ T cells

Affiliations

13C metabolite tracing reveals glutamine and acetate as critical in vivo fuels for CD8+ T cells

Eric H Ma et al. bioRxiv. .

Update in

Abstract

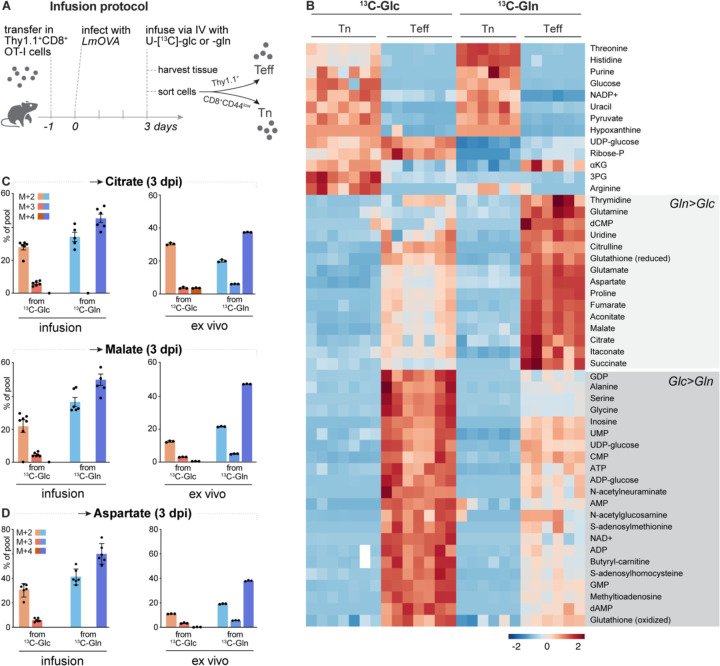
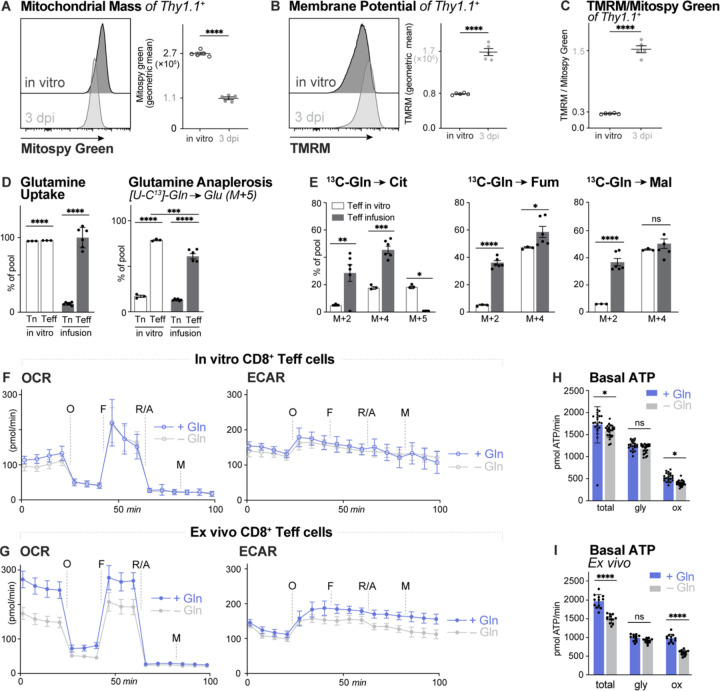
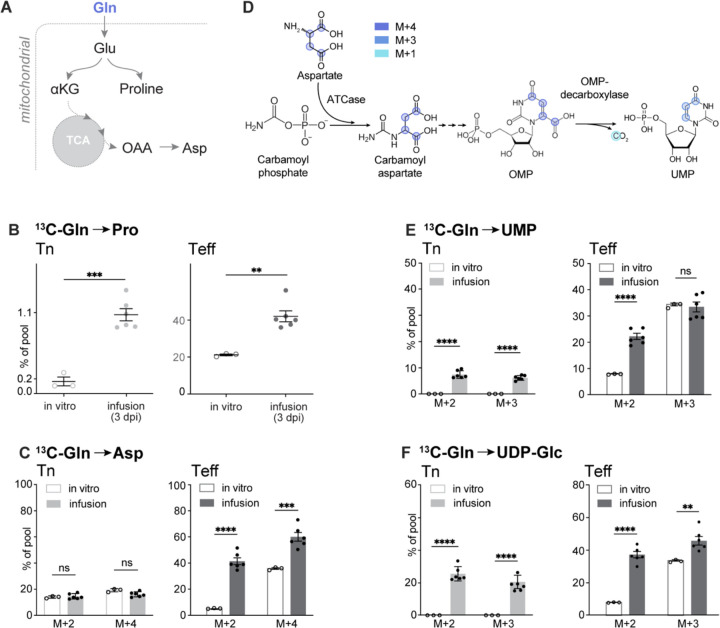
Infusion of 13C-labeled metabolites provides a gold-standard for understanding the metabolic processes used by T cells during immune responses in vivo. Through infusion of 13C-labeled metabolites (glucose, glutamine, acetate) in Listeria monocytogenes (Lm)-infected mice, we demonstrate that CD8+ T effector (Teff) cells utilize metabolites for specific pathways during specific phases of activation. Highly proliferative early Teff cells in vivo shunt glucose primarily towards nucleotide synthesis and leverage glutamine anaplerosis in the tricarboxylic acid (TCA) cycle to support ATP and de novo pyrimidine synthesis. Additionally, early Teff cells rely on glutamic-oxaloacetic transaminase 1 (Got1)-which regulates de novo aspartate synthesis-for effector cell expansion in vivo. Importantly, Teff cells change fuel preference over the course of infection, switching from glutamine- to acetate-dependent TCA cycle metabolism late in infection. This study provides insights into the dynamics of Teff metabolism, illuminating distinct pathways of fuel consumption associated with Teff cell function in vivo.


Conflict of interest statement

Competing interests: RGJ is a scientific advisor for Agios Pharmaceuticals and Servier Pharmaceuticals and is a member of the Scientific Advisory Board of Immunomet Therapeutics.

Figures

Fig. 1.
Fig. 1.. Glutamine is the major TCA cycle fuel for CD8+ T cells in vivo
(A) Infusion protocol schematic. One day prior to infection (day −1), Thy1.1+ CD8+ OT-I+ T (Teff) cells are transferred into sex-matched congenic Thy1.2+ recipients followed by infection with LmOVA the following day (day 0). On day 3, mice are anesthetized and infused with U-[13C]Glc or U-[13C]Gln. Homogenized spleens were split equally prior to Thy1.1+ (Teff) or naïve CD8+/CD44low (Tn) cell selection. (B) Heat map depicting % labelling of intracellular metabolites isolated from Tn and Teff cells following 13C-Glc or 13C-Gln infusion. Regions of the heatmap with increased 13C enrichment from U-[13C]Gln (Gln>Glc) versus U-[13C]Glc (Glc>Gln) are indicated by light and dark grey shading, respectively (z-score range from −4 to 4). (C-D) Percent labeling from 13C-Glc or 13C-Gln (% of total pool) in intracellular (C) citrate (top) and malate (bottom) and (D) aspartate in CD8+ Teff cells isolated from Lm-OVA-infected mice (3 dpi) following 2h infusion (left) or cultured for 2h with 13C-Glc or 13C-Gln ex vivo. M+2, M+3, and M+4 isotopologues are shown. Data represent the mean ± SEM for biological replicates (n=3–6).
Fig. 2.
Fig. 2.. Glutamine fuels OXPHOS in physiologically activated CD8+ T cells
(A-B) Histograms for Mitospy Green (A) and TMRM (B) fluorescence emission from CD8+ Teff cells following 3 days of in vitro activation or isolated from Lm-OVA-infected mice (3 dpi). Geometric mean fluorescence intensity (MFI) of Mitospy Green or TMRM staining between conditions are shown (mean ± SEM, n=5). (C) Ratio of TMRM/Mitosopy Green fluorescence for cells in (A-B). (D) (left) Glutamine (m+5) uptake within Tn or Teff cells upon in vitro culture with 13C-Gln or in vivo 13C-Gln infusion; plotted as % of M+5 intracellular glutamine pool normalized to external (ext.) M+5 glutamine in media (in vitro) and in serum (infusion); (right) Glutamine anaplerosis plot measuring glutamate (M+5) percent of intracellular pool normalized to M+5 glutamine levels in media (in vitro) and in serum (infusion). Data represent the mean ± SEM for biological replicates (n=3–6). (E) Measurements of 13C-Gln conversion into Citrate (Cit), Fumarate (Fum) and Malate (Mal) for in vitro-cultured Teff cells or Teff cells isolated from Lm-OVA-infected mice following infusion; M+N isotopologues are plotted as % of pool and normalized to external (ext.) M+5 glutamine in media (in vitro) or serum (infusion). Data represent the mean ± SEM for biological replicates (n=3–6). (F-G) Plots of oxygen consumption rates (OCR, left) and extracellular acidification rates (ECAR, right) for OT-I T cells (F) activated in vitro for 3 days or (G) isolated from Lm-OVA-infected mice (3 dpi). Plots in (F) and (G) are shown for T cells cultured in the presence (blue) or absence (gray) of glutamine. (H) Total, glycolytic (gly), and OXPHOS (Ox) contributions to basal ATP production (pmol ATP/min) for OT-I T cells activated in vitro (H) or isolated from Lm-OVA-infected mice (3 dpi) (I). Data represent the mean ± SD (n=22–25).
Fig. 3.
Fig. 3.. Glutamine is a substrate for amino acid and nucleotide biosynthesis in Teff cells
(A) Schematic depicting glutamine (Gln) carbon utilization for proline and aspartate (Asp) synthesis (Glu: Glutamate, αKG: α-ketoglutarate; OAA: oxaloacetate). (B) (left) 13C-Glutamine (Gln) conversion to proline by Tn cells (left) and Teff cells (right) following 2h in vitro culture with 13C-Gln or 2h in vivo 13C-Gln infusion. Total 13C enrichment in proline is plotted as the percentage of M+5 intracellular glutamine relative to external M+5 glutamine levels in media (in vitro) or serum (infusion). Data represent the mean ± SEM for biological replicates (n=3–6). (C) Conversion of 13C-Gln to aspartate for Tn and Teff cells treated as in (B). Data are plotted as the percentage of M+2 and M+4 isotopologues normalized to M+5 glutamine in media (in vitro) and in serum (infusion). (D) Schematic depicting the contribution of aspartate carbons to de novo pyrimidine (UMP) synthesis. ATCase, aspartate carbamoyltransferase; OMPdc, orotidine 5’-monophosphate decarboxylase. (E-F) 13C-Gln conversion into (E) UMP and (F) UDP-Glc for Tn and Teff cells displaying % of pools of M+2 and M+3. Data represent the mean ± SEM for biological replicates (n=3–6).
Fig. 4.
Fig. 4.. Got1 supports CD8+ T cell expansion in vivo
(A) Schematic of glutamic-oxaloacetic transaminase (Got) activity. Got1 (cytoplasm) and Got2 (mitochondria) catalyze the reversible transamination of oxaloacetate (OAA) to aspartate, using glutamic acid (Glu) as a nitrogen donor. (B) Immunoblot of Got1 and β-actin protein levels in CD8+ T cells expressing control (shCtrl) and Got1-targeting (shGot1) shRNAs. (C) Mass isotopologue distribution (MID) of 13C-Gln labeling into the intracellular aspartate pool in shCtrl-or shGot1-expressing CD8+ T cells. Data represent the mean ± SEM for biological replicates (n=3). (D) Total abundance of 12C- versus 13C-labeled intracellular aspartate in shCtrl- versus shGot1-expresssing CD8+ T cells expressing. T cells were cultured with 13C-Gln for 2h prior to metabolite extraction. Data represent the mean ± SEM for biological replicates. (E) Relative cell number for shCtrl- and shGot1-expressing T cells cultured for 2 days in medium containing (+) or lacking (−) aspartate (Asp). Data represent the mean ± SEM for biological replicates (n=3), with cell counts normalized to cell number at day 0. (F-G) Expansion and function of shGot1-expressing CD8+ T cells. Thy1.1+ OT-I T cells were transduced with vectors co-expressing Ametrine along with control or Got1-targeting shRNAs. Ametrine+ cells were adoptively transferred into Thy1.2+ hosts, followed by infection with Lm-OVA. (F) Thy1.1 versus Ametrine expression by CD8+ T cells at 6 dpi Lm-OVA infection expression. Left, representative flow cytometry plots for Thy1.1 and Ametrine expression. Right, percentage and number of shRNA-expressing (Ametrine+) Lm-OVA-specific T cells. (G) IFN-γ versus CD44 expression for shRNA-expressing OT-I T cells at 6 dpi. Left, representative flow cytometry plots for CD44 versus IFN-γ expression. Right, percentage and number of IFN-γ+ shRNA-expressing (Ametrine+) T cells. Data represent the mean ± SEM for biological replicates (n=5).
Fig. 5.
Fig. 5.. Glutamine utilization by CD8+ T cells changes over the course of infection.
(A) Schematic of bacterial and CD8+ T cell numbers over the course of Lm-OVA infection. (B-C) Fractional enrichment of 13C-Gln into intracellular metabolite pools in naïve CD8+ T cells or OT-I Teff cells isolated from Lm-OVA infected mice at early (3 dpi) or peak (6 dpi) stages of the T cell response. Mice at each stage were infused with 13C-Gln for 2h prior to cell isolation and extraction of intracellular metabolites. Data represent the mean ± SEM (n=5–6). (B) 13C fractional enrichment into intracellular glutamine (M+5) and glutamate (M+5) pools. Data are normalized to serum 13C-Gln (M+5) levels. (C) 13C fractional enrichment into intracellular α-ketoglutarate (αKG), fumarate (fum), malate (mal) and citrate (cit) pools of Teff cells at 3 or 6 dpi. (D-E) Bioenergetics of CD8+ Teff cells at 3 and 6 dpi. (D) ECAR and OCR measurements for Teff cells isolated at 3 and 6 dpi and cultured in the presence (+, blue) or absence (-, grey) of glutamine. (E) Total, glycolytic (gly), and OXPHOS (Ox) contributions to basal ATP production (pmol ATP/min) in Teff cells isolated from Lm-OVA-infected mice (3 or 6 dpi). (F-G) 13C-glutamine (Gln) percent labelling into intracellular (F) proline (M+5) and aspartate (M+4) pools and (G) UMP (M+3) and UDP-Glc (M+3) pools in Teff cells at 3 and 6 dpi. Data are normalized to serum 13C-Gln (M+5) levels (mean ± SEM, n=5).
Fig. 6.
Fig. 6.. Glutamine utilization by CD8+ T cells correlates with proliferation rate.
(A) Ki67 staining in CD8+ Teff cells. Left, Ki67 fluorescence emission (modal) histograms for resting (naïve) CD8+ T cells, in vitro-activated T cells (anti-CD3/CD28 stimulation for 3 days), or in vivo-activated Teff cells (isolated from Lm-OVA-infected mice 3 or 6 dpi). Right, geometric mean fluorescence intensity (MFI) for Ki67 staining. Data represent the mean ± SEM, n=3–16. (B-C) Relative abundance of 12C- and 13C-labelling in intracellular metabolite pools in CD8+ Teff cells isolated from Lm-OVA-infected mice that received [U-13C]Gln infusions at 3 or 6 dpi. (B) Abundance of 12C- versus 13C-labeled Gln (left) and Glu (right) in Teff cells. (C) Abundance of 12C- versus 13C-labeled citrate (Cit), α-ketoglutarate (αKG), malate (Mal), and aspartate (Asp). (D-E) Relative abundance of 12C- and 13C-labelling in intracellular metabolite pools in CD8+ Teff cells isolated from Lm-OVA-infected mice that received [U-13C]-Glc infusions at 3 or 6 dpi. (D) Abundance of 12C- versus 13C-labeled intracellular glucose (Glc) following infusion. (E) Abundance of 12C- versus 13C-labeled intracellular 3-phosphoglycerate (3-PG), lactate (Lac), citrate (Cit), malate (Mal), and aspartate (Asp). (G-I) Mitochondrial mass (Mitospy) and membrane potential (TMRM) of Teff cells isolated from Lm-OVA-infected mice at 3 or 6 dpi. Histograms of (G) Mitospy Green (mitochondrial mass) and (H) TMRM (membrane potential) fluorescence emission. (I) Ratio of TMRM/Mitosopy Green in Teff cells at 3 or 6 dpi. Data represent the mean ± SEM for biological replicates (n=5).
Fig. 7.
Fig. 7.. Acetate is physiologic TCA cycle fuel for CD8+ T cells
(A) Heatmap of relative 13C-labeling patterns in intracellular metabolites from Teff cells at early (3 dpi) and peak (6 dpi) stages of Lm-OVA infection following 2h infusion of 13C-acetate (acet), 13C-glucose (glc), or 13C-glutamine (gln). Glycolytic and TCA intermediates are highlighted. (B-C) 13C-acetate tracing into Teff cell metabolites following in vivo infusion at 3 or 6 dpi. MID of 13C-acetate labeling into intracellular (B) TCA cycle intermediates (citrate, malate) and (C) TCA cycle-derived amino acids (glutamate, aspartate) in CD8+ Teff cells isolated from Lm-OVA-infected mice. Mice were infused with 13C-acetate for 2h prior to cell isolation. Data represent the mean ± SEM for biological replicates (n=3–6). (D-E) 13C-acetate incorporation into intracellular metabolites following ex vivo culture of CD8+ Teff cells with 13C-acetate. OT-I CD8+ T cells were isolated from Lm-OVA-infected mice at 3 or 6 dpi and cultured ex vivo for 2h in medium containing 1 mM 13C-acetate. Shown are the MID of 13C-acetate labeling into intracellular (D) citrate and malate or (E) glutamate and aspartate in CD8+ Teff cells isolated from mice at 3 or 6 dpi. Data represent the mean ± SEM for biological replicates (n=4–5). (F) Heatmap of intracellular metabolites in CD8+ Teff cells isolated from Lm-OVA-infected mice (3 or 6 dpi) displaying enrichment of 13C carbon following culture with 13C-acetate for 2h ex vivo. Shown are metabolites with significant enrichment of 13C carbon from 13C-acetate (p<0.05). (G) MID (% of pool) and total abundance of 13C-glucose (Glc) or 13C-acetate (Acet) labeling into acetylated (M+2) carnitine and spermidine in CD8+ Teff cells isolated from mice at 3 or 6 dpi and cultured as in (D).

References

    1. Kaech S. M., Cui W., Transcriptional control of effector and memory CD8+ T cell differentiation. Nat. Rev. Immunol. 12, 749–761 (2012). - PMC - PubMed
    1. Chang J. T., Wherry E. J., Goldrath A. W., Molecular regulation of effector and memory T cell differentiation. Nat. Immunol. 15, 1104–1115 (2014). - PMC - PubMed
    1. Buck M. D., O’Sullivan D., Pearce E. L., T cell metabolism drives immunity. J. Cell Biol. 210, 2104OIA169 (2015). - PMC - PubMed
    1. Pearce E. L., Pearce E. J., Metabolic pathways in immune cell activation and quiescence. Immunity. 38, 633–643 (2013). - PMC - PubMed
    1. Pearce E. L., Poffenberger M. C., Chang C.-H., Jones R. G., Fueling immunity: insights into metabolism and lymphocyte function. Science. 342, 1242454 (2013). - PMC - PubMed

Publication types