[Preprint]. 2023 Jun 9:rs.3.rs-2949436.
doi: 10.21203/rs.3.rs-2949436/v1.

Preventing recurrence in Sonic Hedgehog Subgroup Medulloblastoma using the OLIG2 inhibitor CT-179

Affiliations

Preventing recurrence in Sonic Hedgehog Subgroup Medulloblastoma using the OLIG2 inhibitor CT-179

Yuchen Li et al. Res Sq. .

Update in

  • Suppressing recurrence in Sonic Hedgehog subgroup medulloblastoma using the OLIG2 inhibitor CT-179.
    Li Y, Lim C, Dismuke T, Malawsky DS, Oasa S, Bruce ZC, Offenhäuser C, Baumgartner U, D'Souza RCJ, Edwards SL, French JD, Ock LSH, Nair S, Sivakumaran H, Harris L, Tikunov AP, Hwang D, Alicea Pauneto CDM, Maybury M, Hassall T, Wainwright B, Kesari S, Stein G, Piper M, Johns TG, Sokolsky-Papkov M, Terenius L, Vukojević V, McSwain LF, Gershon TR, Day BW. Li Y, et al. Nat Commun. 2025 Feb 4;16(1):1091. doi: 10.1038/s41467-024-54861-3. Nat Commun. 2025. PMID: 39904981 Free PMC article.

Abstract

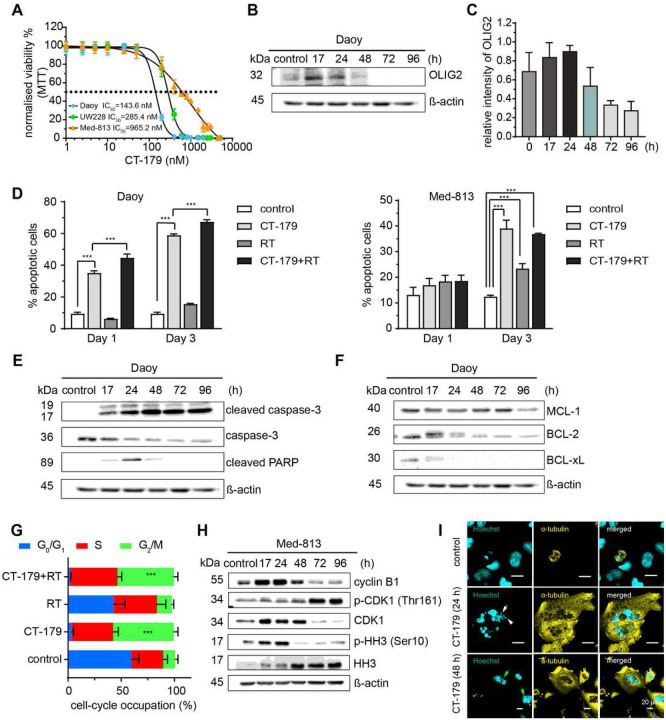
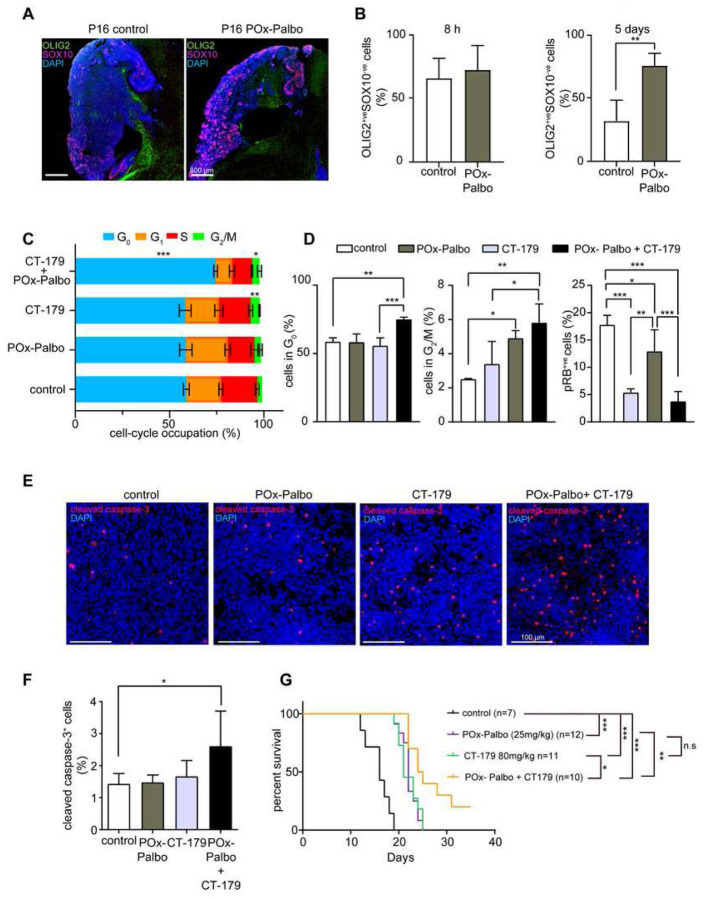
Recurrence is the primary life-threatening complication for medulloblastoma (MB). In Sonic Hedgehog (SHH)-subgroup MB, OLIG2-expressing tumor stem cells drive recurrence. We investigated the anti-tumor potential of the small-molecule OLIG2 inhibitor CT-179, using SHH-MB patient-derived organoids, patient-derived xenograft (PDX) tumors and mice genetically-engineered to develop SHH-MB. CT-179 disrupted OLIG2 dimerization, DNA binding and phosphorylation and altered tumor cell cycle kinetics in vitro and in vivo, increasing differentiation and apoptosis. CT-179 increased survival time in GEMM and PDX models of SHH-MB, and potentiated radiotherapy in both organoid and mouse models, delaying post-radiation recurrence. Single cell transcriptomic studies (scRNA-seq) confirmed that CT-179 increased differentiation and showed that tumors up-regulated Cdk4 post-treatment. Consistent with increased CDK4 mediating CT-179 resistance, CT-179 combined with CDK4/6 inhibitor palbociclib delayed recurrence compared to either single-agent. These data show that targeting treatment-resistant MB stem cell populations by adding the OLIG2 inhibitor CT-179 to initial MB treatment can reduce recurrence.

Keywords: CT-179; Medulloblastoma; OLIG2; pre-clinical.


Conflict of interest statement

Additional Declarations: Yes there is potential Competing Interest. G.S. is Chief Executive Officer, Chairman of the Board, and has equity ownership at Curtana Pharmaceuticals. S.K. is a member of the Board and has equity ownership at Curtana Pharmaceuticals. The other co-authors have no competing interests to report.

Figures

Figure 1.
Figure 1.. OLIG2 expression in pediatric MB and OLIG2 siRNA knockdown studies
(A) High OLIG2 expression correlates with poor OS in SHH-MB α subtype patients which harboring TP53 mutation. Kaplan-Meier curves of the SHH-driven MB α subtype patients based on OLIG2 expression. (B) OLIG2 expression in PDX models, primary cell lines and ATCC pediatric MB cell lines (data are shown as means ± SD, n=6). (C) OLIG2 expression at protein level in MB cell lines. (D) OLIG2 immunostaining in a MB xenograft model D425. Oligodendroglioma patient tissue was used as a positive control. Arrowheads, OLIG2+ cells. Scale bars are indicated in (D) (E) Representative western blots show expression of OLIG2 expression 72 hours after siRNA OLIG2 knockdown (KD) in Daoy cells. (F) Representative western blots show expression of cleaved caspase-3, total caspase-3 and cleaved PARP and total PARP in Daoy 72 hours after siRNA OLIG2 knockdown. (G) Representative western blots show expression of cyclin B1, p-CDK1, p-HH3, total CDK1 and total HH3 in Daoy 72 hours after siRNA OLIG2 knockdown. (H) Daoy cells stalled in G2/M phase 72 hours after siRNA OLIG2 knockdown (means ± SD, **p < 0.01, n=6). The p value was determined by one-way ANOVA. (I) Top panel shows a Daoy cell in anaphase with normal nucleus morphology and spindle alignment. siRNA OLIG2 knockdown results in abnormal nucleus phenotypes including satellite micronuclei. Scale bars are indicated in (I). (J) Bright field images of Daoy cells transfected with scrambled control sequence and siRNA OLIG2 KD Seq #2 over 48 hours. Cells labelled with cleaved Caspase-3/7 were shown in green. (K) Cell confluence (left) and cleaved caspase-3 confluence of Daoy after siRNA knockdown compared to scrambled control, wild-type Daoy with or without lipofectamine.
Figure 2.
Figure 2.. CT-179 specificity analysis and pharmacokinetics analysis.
(A) RCA values for replicate HEK-293 cells studied by FCCS. Cells in the negative control (NC) group were co-transfected with eGFP and Tomato alone. Cells transfected with OLIG2-eGFP and OLIG2-Tomato showed increased RCA, and treatment with 1 μM CT-179 for one hour significantly decreased RCA in these cells. (B) Increased concentrations of CT-179 resulted in decreased RCA concentrations, yielding a dose-response curve when RCA values measured as in (A) are plotted against CT-179 concentration. Best fit of dose-response curve (red solid line) determined the half maximal inhibitory concentration of CT-179, IC50 = 1250 nM, and the allosteric factor, nallo = −0.66. (C) Brightness of OLIG2-eGFP, measured by counts per second per molecule (CPM) in untreated cells and in cells treated with 1 μM or 10 μM CT-179. (D) Diffusion coefficient (DC) of the DNA-binding component. Higher diffusion coefficient, reflecting faster diffusion, was seen in cells treated with CT-179. (E) Luciferase reporter plasmid scheme (top panel) and bar graph showing LHX8 promoter-based luciferase reporter activity under conditions of OLIG2 overexpression with or without CT-179 treatment. The p value was determined by one-way ANOVA. (F) Kinomic inhibition profile of CT-179. The protein kinases inhibited by CT-179 on the KINOMEscan array are marked as red nodes on the dendrogram of the human kinome. Node size indicates the levels inhibition of the kinases. (G) Phenotypic profiling of CT-179 with BioMAP Diversity PLUS panel. The profile plot shows the effects of CT-179 at 160 nM (orange), 630 nM (yellow) and 2.5 μM (green) on a panel of 12 primary cell systems (listed as BioMAP 1–12) with 148 clinically relevant biomarker readouts. (H) Plasma concentrations of CT-179 measured in 3 animals administered with single dose CT-179 by oral gavage (PO, left) and intravenously (IV, right) over 24 hours. (I) Bar graphs showing plasma and brain concentrations of CT-179 (left panel) and brain to plasma ratio (right) after 1 and 4 hours of single oral administration (PO) of CT-179 at 20 mg/kg. (J) Plasma concentrations of CT-179 over 24 hours after oral administration of drug. The concentration over 24 hours after a single dose (1 dose/day) is shown on the left and after three doses (1 dose/day).
Figure 3.
Figure 3.. CT-179 induces apoptosis and mitotic slippage in MB cells.
(A) MB cell lines were treated with CT-179 for 7 days and a median inhibitory concentration (IC50) determined experimentally for each cell line (data are shown as means ± SD, n=3). (B) Daoy were treated with 1 μM CT-179 for 17, 24, 72 or 96 hours, after which total protein were analyzed. OLIG2 expression peaked at 17 and 24 hours after treatment, then decreased to basal and completely diminished after 72 hours. (C) Quantification of OLIG2 expression in Daoy in response of CT-179 (data are shown as means ± SD, n=2). (D) Percentage of Annexin V+ cells in Daoy cells and Med-813 treated with CT-179 (1 μM) or RT (2 Gy) alone, or in combination (means ± SD, ***p < 0.001, n=6). The p value was determined by one-way ANOVA. (E) Representative western blots show expression of cleaved caspase-3, caspase-3 and cleaved PARP in Daoy after treated with CT-179 (1 μM). (F) Representative western blots show expression of MCL-1, BCL-1 and BCL-xL in Daoy after treated with CT-179 (1 μM). (G) Cell cycle occupation analysis of Daoy stained with propodium iodide after 24 hours treatment with vehicle or 1 μM CT-179 or RT (2 Gy) alone, or in combination (means ± SD, ***p < 0.001, n=6). The p value was determined by two-way ANOVA. (H) Representative western blots show expression of cyclin B1, p-CDK1, p-HH3, total CDK1 and total HH3 in Med-813 cells after CT-179 (1 μM) treatment. (I) Top panel shows a Daoy cell in anaphase with normal nucleus morphology and spindle alignment. CT-179 treatment (1 μM) results in abnormal nucleus phenotypes including satellite micronuclei (white arrow) and ancillary nucleus lobe formation (green arrows), suggesting cells undergo a mitotic slippage response.
Figure 4.
Figure 4.. CT-179 induces apoptosis in MB explant organoids.
(A) H&E of untreated MB organoids R403, R901 and R902. CD31 staining shows endothelial cells. KI67 staining shows proliferating cells. SOX2, which identified both glial cells and tumor stem cells, is highly expressed in SHH-MB organoid R902. (B) OLIG2 expression in patient tissues R901 and R902 (means ± SD, n=2). (C) SHH-MB organoid R902 was treated for CT-179 (1 μM) or RT (2 Gy) alone or in combination for 48 hours. IHC shows CC3, KI67 and SOX2 (means ± SD, n=3, *p < 0.05, **p < 0.01, ***p < 0.001). Combination treatment significantly induced cell death in SHH-MB organoids compared to single treatment. The p values were determined by two-sided Student’s t-test. (D) Kaplan-Meier survival curves of Daoy-luci mice (≥ 6 per group, **p < 0.01, ***p < 0.001). MS: median survival. (E) Luminescence signal quantitation of Daoy-luci brain tumors (> 6 per group, ***p < 0.001). (F) Luminescence signal quantitation of Daoy-luci spinal metastases (> 6 per group, ***p < 0.001). (G) Kaplan-Meier survival curves Med-813-luci mice (≥ 6 per group) treated with indicated therapies (*p < 0.05, **p < 0.01, ***p < 0.001) and representative H&E images of Med-813-luci tumor groups. MS: median survival. The p values were determined by Log-Rank test.
Figure 5.
Figure 5.. CT-179 efficacy in the G-Smo model.
(A) Western blots showing p-RB and p-OLIG2 in MBs from replicate G-Smo mice treated EOD from P10-P16 with CT-179 (80 mg/kg) or vehicle and harvested at P17, 24 hours after final dose with quantification below. The level of expression was normalized by β-actin (means ± SD, n=3, *p < 0.05). (B) Cell-cycle occupation analysis of MBs from replicate G-Smo mice treated with 80 mg/kg CT-179 and harvested after the indicated intervals, dissociated and subjected to flow cytometry, compared to untreated controls (means ± SD, n=3 for each group). (C and D) Quantification by flow cytometry of (C) G2/M phase and (D) M phase cells, defined by very high p-RB++ cells in dissociated MBs from CT-179-treated mice (means ± SD, n=3, **p < 0.01). (E) Representative NEUN/DAPI IHC in G-Smo MB treated with CT-179 100 mg/kg or saline every three days, 24 hours after the final treatment with quantification of NEUN+ cells in tumors of replicate mice (means ± SD, n=3, **p < 0.01). (F) H&E of brains P15 G-Smo mice treated at P10, P12 and P14 with 80mg/kg CT-179, compared to saline controls. (G) Longitudinal follow up luciferase signal in G-SmoGli-luc mice treated as indicated, with luciferase intensity quantified in the right panel. (H) Kaplan-Meier curves of G-Smo mice on the CT-179 single-agent regimens (*p < 0.05, **p < 0.01, ***p < 0.001), compared to untreated controls. The p values were determined by Log-Rank test. (I) Representative OLIG2/DAPI IF in MBs from G-Smo mice treated EOD from P10-P16 with CT-179 (80 mg/kg) or vehicle and harvested at P17, 24 hours after final dose, with quantification of OLIG2 IF in replicate mice (means ± SD, n=3, *p < 0.05). (J) Kaplan-Meier curves of G-Smo mice on the indicated treatment regimens (**p < 0.01, ***p < 0.001), showing the impact of combining radiotherapy and CT-179. The p values were determined by Log-Rank test. For panels A-E and I, the p values were determined by two-sided Student’s t-test.
Figure 6.
Figure 6.. scRNA-seq analysis defines CT-179-induced changes in tumor cell heterogeneity and gene expression.
(A) UMAP plot of all cells from CT-179-treated tumors and control tumors, grouped by transcriptomic similarities into color-coded clusters. The clusters are ordered from the largest cluster first (Cluster 0) to the smallest cluster last (Cluster 22). (B) UMAP plot from (A), with expression of specific markers of different types of stromal cells color coded. (C) UMAP plot from (A) with expression of color-coded proliferation and differentiation markers, identifying MB cells in a range of proliferative and differentiating states. The dotted boundary defines the subset of cells of tumor lineage used for further analysis. (D) UMAP from new PCA analysis after isolation of MB cells depicted in (C), showing clustering using PCs from tumor-only analysis. (E) UMAP plot from (D), with expression Olig2 color coded. Olig2+ cells predominantly localize within Cluster 2 (blue arrowhead) and Cluster 7 (red arrowhead). (F) UMAP plot from (D) overlayed with cell cycle phase determined by transcriptomic anlaysis, showing, early and late differentiating cell populations. (G) Dot plot showing the magnitude and frequency of the expression of indicated proliferation and differentiation markers in the indicated tumor cell clusters. (H) Bar plots showing the proportions of proliferative, early differentiating and late differentiating sets of tumor cells color-coded by cluster, comparing CT-179-treated and control tumors. The p values were determined by Dirichelet regression. (I) Heat map showing the expression of Mki67, Pa2g4, and Cdk4 in MBs from individual replicate CT-179-treated or control G-Smo mice.
Figure 7.
Figure 7.. CT-179 and POx-Palbociclib dual regimen is more effective than either single-agent treatment.
(A) Representative images of OLIG2/SOX10/DAPI stained MBs in G-Smo mice treated with CT-179 (100 mg/kg) or saline every three days. (B) Quantification of OLIG2+/SOX10- cells in MBs of G-Smo mice after 8 hours (left panel) and 5 days (right panel) of commencing treatment (means ± SD, n>3, **p < 0.01). (C) Cell-cycle occupation analysis of MBs from G-Smo mice treated with 80 mg/kg CT-179, 25 mg/kg POx-Palbociclib, or CT-179-POx-Palbo combination and harvested 6 hours after treatment (means ± SD, n=3 for each group). (D) Quantification of percentage of cells in G0 phase (left panel) G2/M phase (middle panel) and M phase defined by very high phosphorylated (p-RB++; right panel) in G-Smo mice after 6 hours of treatment (means ± SD, n=3, **p < 0.01). (E) Representative cleaved caspase-3 (cC3)/DAPI stained images from control, CT-179 (80 mg/kg), POx-Palbociclib (25 mg/kg), or combination (POx-Palbociclib + CT-179) treated tumors (F) Quantification of cC3 positive cells. Samples were harvested 6 hours after treatment. (G) Kaplan-Meier curves of G-Smo mice on the indicated treatment regimens (*p < 0.05, **p < 0.01, ***p < 0.001). The p values were determined by Log-Rank test. For panels B--D and F, the p values were determined by two-sided Student’s t-test.

References

    1. Ostrom Q.T., et al., CBTRUS Statistical Report: Primary Brain and Other Central Nervous System Tumors Diagnosed in the United States in 2011–2015. Neuro Oncol, 2018. 20(suppl_4): p. iv1–iv86. - PMC - PubMed
    1. Ostrom Q.T., et al., CBTRUS Statistical Report: Primary Brain and Other Central Nervous System Tumors Diagnosed in the United States in 2009–2013. Neuro Oncol, 2016. 18(suppl_5): p. v1–v75. - PMC - PubMed
    1. Northcott P.A., et al., Medulloblastoma comprises four distinct molecular variants. J Clin Oncol, 2011. 29(11): p. 1408–14. - PMC - PubMed
    1. Gajjar A., et al., Risk-adapted craniospinal radiotherapy followed by high-dose chemotherapy and stem-cell rescue in children with newly diagnosed medulloblastoma (St Jude Medulloblastoma-96): long-term results from a prospective, multicentre trial. Lancet Oncol, 2006. 7(10): p. 813–20. - PubMed
    1. Rutkowski S., et al., Survival and prognostic factors of early childhood medulloblastoma: an international meta-analysis. J Clin Oncol, 2010. 28(33): p. 4961–8. - PubMed

Publication types