[Preprint]. 2023 Jun 7:2023.06.07.544100.
doi: 10.1101/2023.06.07.544100.

Glucose Hypometabolism Prompts RAN Translation and Exacerbates C9orf72-related ALS/FTD Phenotypes

Affiliations

Glucose Hypometabolism Prompts RAN Translation and Exacerbates C9orf72-related ALS/FTD Phenotypes

A T Nelson et al. bioRxiv. .

Update in

Abstract

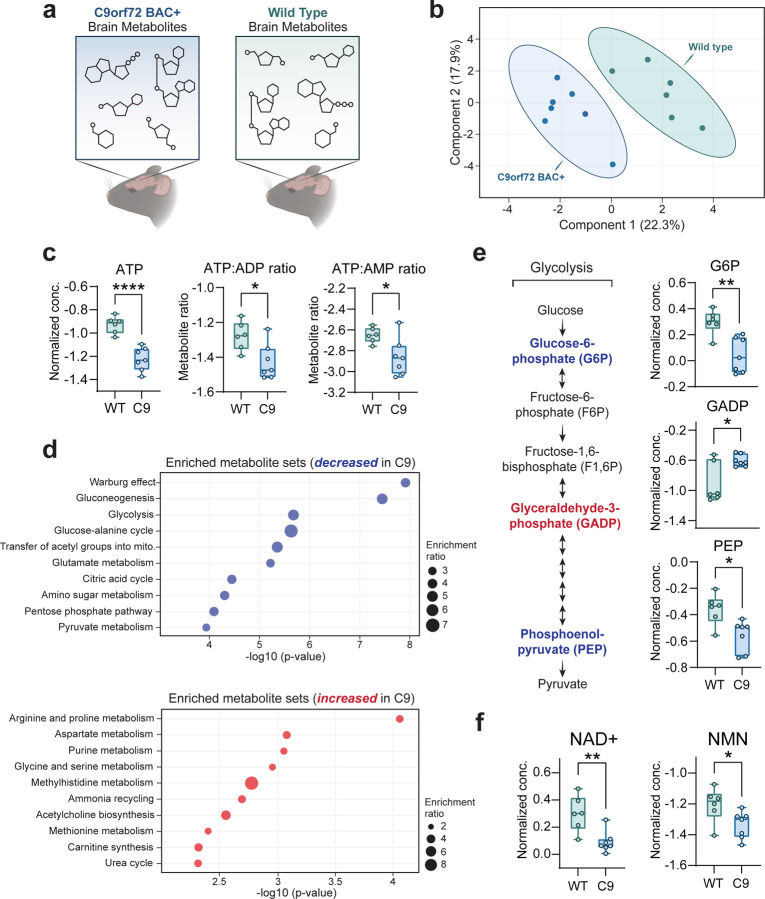
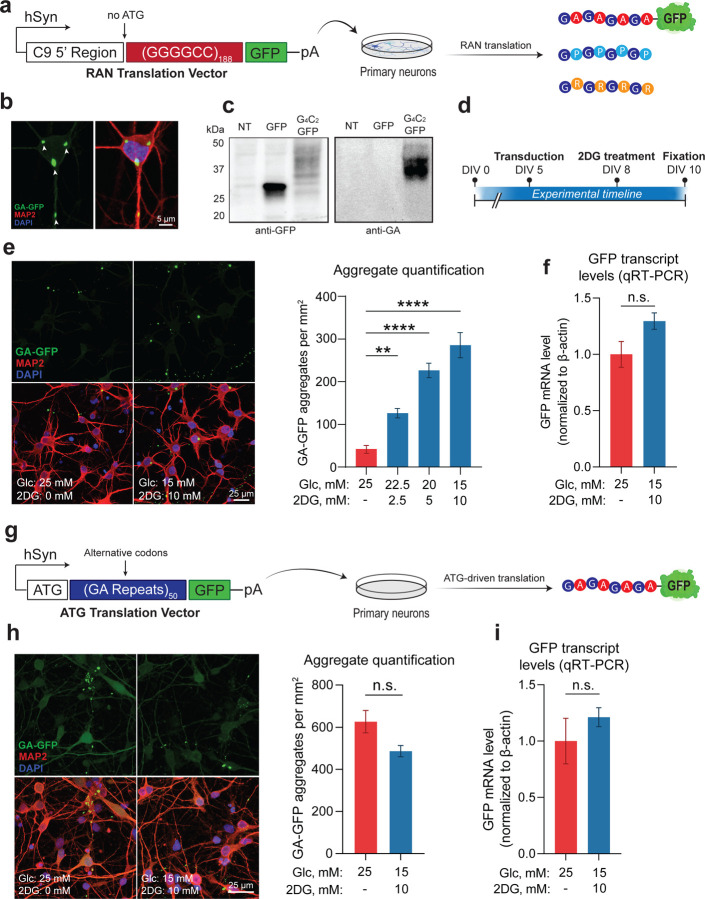
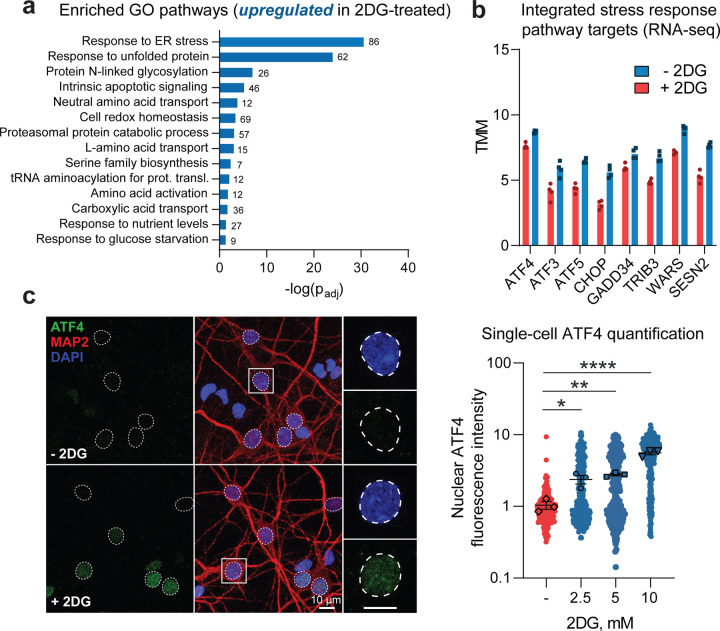
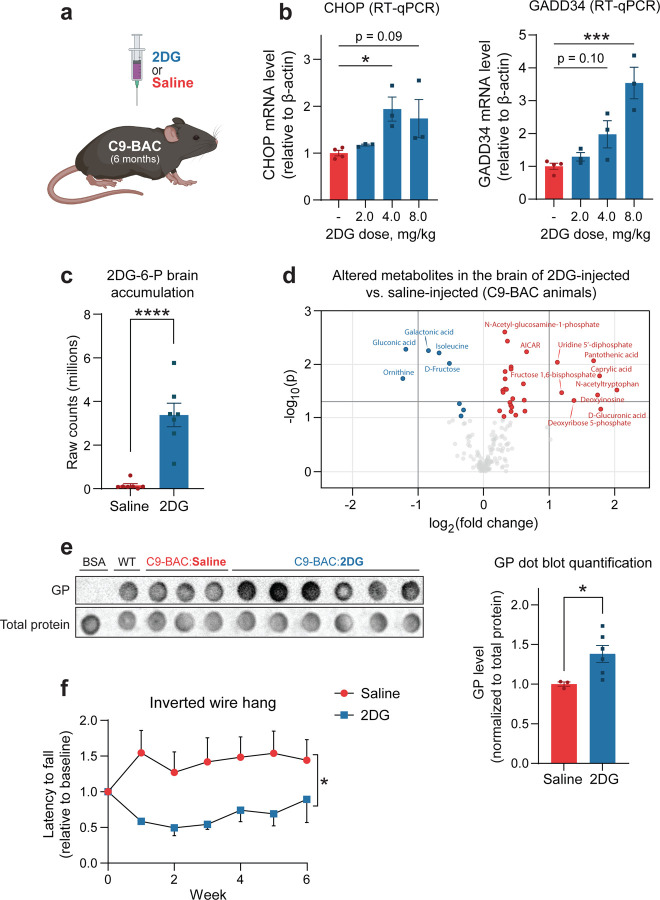
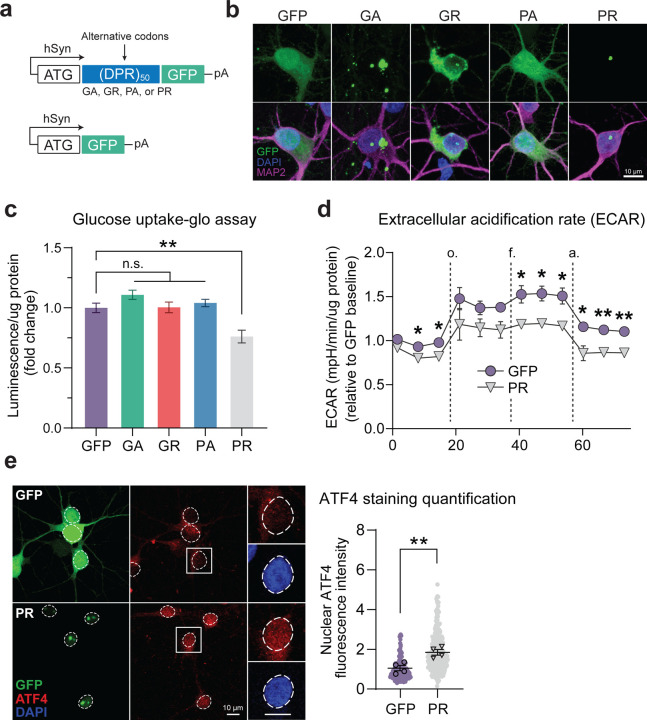
The most prevalent genetic cause of both amyotrophic lateral sclerosis and frontotemporal dementia is a (GGGGCC)n nucleotide repeat expansion (NRE) occurring in the first intron of the C9orf72 gene (C9). Brain glucose hypometabolism is consistently observed in C9-NRE carriers, even at pre-symptomatic stages, although its potential role in disease pathogenesis is unknown. Here, we identified alterations in glucose metabolic pathways and ATP levels in the brain of asymptomatic C9-BAC mice. We found that, through activation of the GCN2 kinase, glucose hypometabolism drives the production of dipeptide repeat proteins (DPRs), impairs the survival of C9 patient-derived neurons, and triggers motor dysfunction in C9-BAC mice. We also found that one of the arginine-rich DPRs (PR) can directly contribute to glucose metabolism and metabolic stress. These findings provide a mechanistic link between energy imbalances and C9-ALS/FTD pathogenesis and support a feedforward loop model that opens several opportunities for therapeutic intervention.

Keywords: ALS; C9orf72; Dipeptide Repeat Proteins; FTD; Glucose Hypometabolism; RAN Translation.


Conflict of interest statement

Disclosure and Competing Interests Statement The authors declare no competing financial interests.

Figures

Figure 1 –
Figure 1 –. The C9orf72-linked G4C2 repeat expansion disrupts brain energy balance.
A Schematic depicting brain metabolite profiling experimental setup. B Principal component analysis (PCA) of the complete metabolomics panel. C Liquid chromatography mass spectrometry (LC-MS) measurement of relative ATP concentrations, ATP:ADP ratios, and ATP:AMP ratios in C9-BAC animals versus WT animals. D Enrichment analysis of metabolite sets in C9-BAC animals versus WT animals. Enrichment ratio represents the number of metabolites within each metabolite set that are either increased (in blue) or decreased (in red) in the frontal cortex of C9-BAC versus WT animals. E Schematic of glycolysis pathway, with significantly altered glycolytic intermediates highlighted in blue text (decreased in C9-BAC animals) or red text (increased in C9-BAC animals). LC-MS measurement of relative concentrations of glucose-6-phosphate (G6P), glyceraldehyde-3-phosphate (GADP), and phosphoenolpyruvate (PEP) in C9-BAC versus WT animals. F LC-MS measurement of nicotinamide adenine dinucleotide (NAD+) and nicotinamide mononucleotide (NMN) concentrations in C9-BAC versus WT animals. All individual metabolite data are shown as median-normalized and log-transformed values (abbreviated as “Normalized conc.”). Data Information | For all data, n = 7 C9orf72 BAC+ (C9-BAC) and 6 littermate control wild type (WT) animals. For all box and whisker plots, box edges denote upper and lower quartiles, horizontal lines within each box denote median values, whiskers denote maximum and minimum values, and shaded circles denote individual values for each animal. Student’s two-tailed t-test, * p < 0.05; ** p < 0.01; **** p < 0.0001.
Figure 2 –
Figure 2 –. Glucose hypometabolism triggers accumulation of DPRs.
A Schematic of lentiviral RAN translation vector used for the experiments, containing a (G4C2)188 repeat expansion with the 5’ flanking region of the C9orf72 gene (including exon 1a and intron 1) and a downstream GFP tag lacking an ATG start codon in frame with GA. The entire construct was driven by the human synapsin (hSyn) promoter. B Representative images depicting cellular localization patterns of RAN-translated GA-GFP aggregates. C Western blot analysis of GA-GFP levels in primary neurons using anti-GA antibody (RRID: AB_2728663) (NT = non-transduced; GFP = transduced with a GFP lentiviral vector (negative control); G4C2-GFP = transduced with RAN translation vector). D Schematic of experimental timeline from day in vitro (DIV) 0 to 10. E Fluorescent confocal imaging and quantification of DPR aggregate formation in primary neurons transduced with RAN translation vector, then incubated with either normo-glucose media (25 mM glucose + 0 mM 2DG) or media containing increasing concentrations of 2DG (n = 4). F qRT-PCR analysis of GFP mRNA levels in primary neurons transduced with either the RAN translation reporter vector, then incubated with either normo-glucose media or 10 mM 2DG-containing media (n = 4). G Schematic of lentiviral ATG translation vector used for the experiments, containing a 50 GA repeats encoded with alternative codons and a downstream GFP tag. H Fluorescent imaging and quantification of DPR aggregate formation in primary neurons transduced with ATG translation vector, then incubated with either normo-glucose media or 10 mM 2DG-containing media (n = 3). I qRT-PCR analysis of GFP mRNA levels in primary neurons transduced with the ATG translation vector, then incubated with either normo-glucose media or 10 mM 2DG-containing media (n = 3). Data Information | For E, one way ANOVA with Dunnett’s test for multiple comparisons. For F-I, student’s two-tailed t-test. All data are presented as mean ± standard error of the mean (SEM). ** p < 0.01, *** p < 0.001, **** p < 0.0001, n.s. p > 0
Figure 3 –
Figure 3 –. Glucose hypometabolism activates the ISR in cultured neurons.
A, B RNA sequencing assessment of select transcriptomic changes in C9orf72 patient-derived i3Neurons (n = 2 individual i3Neuron lines with 2 separate differentiations per line) incubated in media containing 10 mM 2DG for 48 hours versus those maintained in normal media, including significantly upregulated gene ontology (GO) pathways (A) and significantly upregulated individual integrated stress response (ISR) target transcripts (B; all padj < 0.05). C Immunofluorescence-based measurement and quantification of nuclear ATF4 expression level in MAP2-positive primary neurons incubated in media containing 0, 2.5, 5.0, or 10 mM 2DG for 48 hours (n = 4). Data Information | For A, the values adjacent to each bar represent the number of altered genes in each GO pathway. For B, bars represent median values, and individual dots represent individual replicates. For C, one-way ANOVA with Dunnett’s test for multiple comparisons. Data are presented as mean ± SEM. * p < 0.05, ** p < 0.01, **** p < 0.0001.
Figure 4 –
Figure 4 –. DPR accumulation caused by glucose hypometabolism correlates with ISR activation and is blocked by inhibition of the GCN2 kinase.
A Correlation between number of GA-GFP aggregates per field of view (from Fig. 2E) and nuclear ATF4 expression level (from Fig. 3C) in primary neurons incubated with either normo-glucose or various concentrations of 2DG. Best-fit line and R2 value represent linear regression analysis. B Schematic depicting the proposed mechanism through which nutrient deprivation increases RAN translation. A92 was used as a pharmacological inhibitor of GCN2 kinase activity. C, D Fluorescent confocal imaging and quantification of DPR formation in primary neurons transduced with RAN translation vector, then incubated with either normo-glucose media, 10 mM 2DG-containing media, or 10 mM 2DG-containing media with 5.0 μM A92, all in the presence of 0.1% DMSO (n = 4). E Quantification of DPR aggregate formation in primary neurons transduced with RAN translation vector, then treated with A92 concentrations ranging from 0.1 μM to 7.5 μM, all in the presence of 10 mM 2DG and 0.1% DMSO (n = 4). Best-fit line and IC50 value were derived from non-linear regression analysis. Data Information | For D, one-way ANOVA with Dunnett’s test for multiple comparisons. All data are presented as mean ± SEM. **** p < 0.0001.
Figure 5 –
Figure 5 –. Glucose deprivation is selectively toxic to C9orf72 patient-derived i3Neurons.
A Schematic of the doxycycline-inducible neuronal differentiation cassette used to drive rapid differentiation of human induced pluripotent stem cells (hiPSCs) into i3Neurons from days post-induction (DPI) 0 to 27. B Timeline of differentiation into i3Neurons and subsequent glucose deprivation. C Live-cell longitudinal imaging of healthy control- or C9orf72 patient-derived i3Neurons cultured with glucose-deprived media over 6 days using DRAQ7 as a dead cell indicator. D Kaplan-Meier survival analysis of i3Neurons derived from either C9orf72 patients or healthy controls and maintained in glucose-deprived media (n = 2 i3Neuron lines per genotype with 3 independent differentiations per line). E Kaplan-Meier survival analysis of C9orf72 patient-derived i3Neurons maintained in either normo-glucose or glucose-deprived media and treated with either 2.5 μM A92 with 0.1% DMSO or 0.1% DMSO only as vehicle control (n = 2 i3Neuron lines per treatment with 3 independent differentiations per line). Data Information | For D-E, Dotted traces denote i3Neuron lines with only Ngn2 integrated into the safe harbor locus (from Ward laboratory), while solid traces correspond to i3Neuron lines with both Ngn1 and Ngn2 integrated into the safe harbor locus (from Barmada laboratory). Kaplan-Meier log-rank survival test. * p < 0.05, **** p < 0.0001.
Figure 6 –
Figure 6 –. 2DG treatment exacerbates metabolic stress and drives disease-related phenotypes in C9orf72 BAC transgenic mice.
A Schematic of experimental setup: C9-BAC animals were treated with either 2-deoxyglucose (2DG) or saline (vehicle control) by i.p. injection. B RT-qPCR measurement of spinal cord mRNA levels of two ISR transcriptional targets (CHOP and GADD34) in C9-BAC animals acutely treated with various doses of 2DG or saline (n = 3–4 animals per condition). C, D LC-MS measurement of 2DG-6-P levels (C) and significantly altered metabolites (D) in the frontal cortex of C9-BAC mice following chronic weekly exposure to 4 g/kg 2DG versus saline (n = 7 animals per condition). Dark shaded lines indicate significance cut-offs (−log10(p) > 1.3 and log2(FC) > |1|). E Dot blot assessment and corresponding quantification of 8M urea-soluble GP levels relative to total protein levels in the spinal cord C9-BAC animals treated with either saline (n = 3 animals) or 2DG (n = 6 animals). Bovine serum albumin (BSA) and spinal cord lysate from a wild-type animal were used as controls. F Longitudinal assessment of inverted wire hang performance of C9-BAC animals chronically exposed to 4 g/kg 2DG or saline (n = 7 animals per condition). Data Information | For B, one-way ANOVA with Dunnett’s test for multiple comparisons. For C-D, student’s two-tailed t-test. For E, two-tailed t-test with Welch’s correction. For F, two-way ANOVA. All data are presented as mean ± SEM. * p < 0.05, *** p < 0.001, **** p < 0.0001.
Figure 7 –
Figure 7 –. Arginine-rich DPRs contribute to glucose hypometabolic stress.
A Schematic of lentiviral DPR vectors and GFP-only (control) vector. B Representative images depicting cellular localization patterns of GFP-tagged DPRs in primary neurons transduced with lentiviral vectors. c Luminescence-based measurement of glucose uptake (normalized to total protein) in primary neurons transduced with each of the DPR vectors or the GFP-only control vector (n = 4). D Seahorse extracellular flux assay measurement of extracellular acidification rate (ECAR; normalized to total protein) of primary neurons transduced with either the PR vector or GFP-only control vector (n = 3). E Immunofluorescence-based measurement and quantification of nuclear ATF4 expression level in MAP2-positive primary neurons transduced with either the PR vector or GFP-only control vector (n = 4). Data Information | For C, one-way ANOVA with Dunnett’s test for multiple comparisons. For D, multiple student’s two-tailed t-tests. For E, student’s two-tailed t-test. All data are presented as mean ± SEM. * p < 0.05, ** p < 0.01, **** p < 0.0001.

References

    1. Allen SP, Hall B, Woof R, Francis L, Gatto N, Shaw AC, Myszczynska M, Hemingway J, Coldicott I, Willcock A et al. (2019) C9orf72 expansion within astrocytes reduces metabolic flexibility in amyotrophic lateral sclerosis. Brain 142: 3771–3790 - PMC - PubMed
    1. Ash Peter EA, Bieniek Kevin F, Gendron Tania F, Caulfield T, Lin W-L, DeJesus-Hernandez M, van Blitterswijk Marka M, Jansen-West K, Paul Joseph W, Rademakers R et al. (2013) Unconventional Translation of C9ORF72 GGGGCC Expansion Generates Insoluble Polypeptides Specific to c9FTD/ALS. Neuron 77: 639–646 - PMC - PubMed
    1. Beghi E, Pupillo E, Bonito V, Buzzi P, Caponnetto C, Chio A, Corbo M, Giannini F, Inghilleri M, Bella VL et al. (2013) Randomized double-blind placebo-controlled trial of acetyl-L-carnitine for ALS. Amyotroph Lateral Scler Frontotemporal Degener 14: 397–405 - PubMed
    1. Cheng W, Wang S, Mestre AA, Fu C, Makarem A, Xian F, Hayes LR, Lopez-Gonzalez R, Drenner K, Jiang J et al. (2018) C9ORF72 GGGGCC repeat-associated non-AUG translation is upregulated by stress through eIF2alpha phosphorylation. Nat Commun 9: 51. - PMC - PubMed
    1. Chighine A, Locci E, Nioi M, d’Aloja E (2021) Looking for Post-Mortem Metabolomic Standardization: Waiting for Godot-The Importance of Post-Mortem Interval in Forensic Metabolomics. Chem Res Toxicol 34: 1946–1947 - PubMed

Publication types