[Preprint]. 2023 Jun 8:2023.06.06.543780.
doi: 10.1101/2023.06.06.543780.

A Spatiotemporal Compartmentalization of Glucose Metabolism Guides Mammalian Gastrulation Progression

Affiliations

A Spatiotemporal Compartmentalization of Glucose Metabolism Guides Mammalian Gastrulation Progression

Dominica Cao et al. bioRxiv. .

Abstract

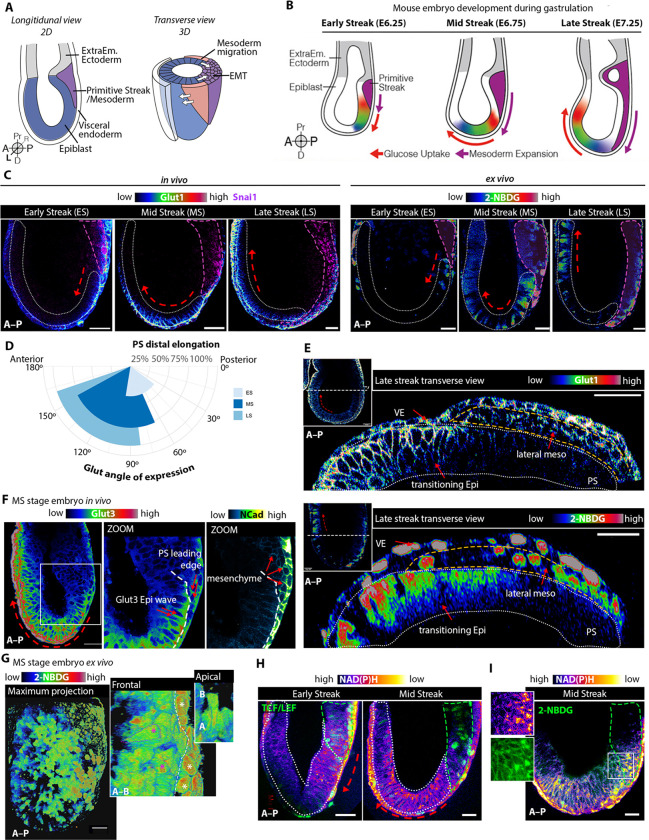
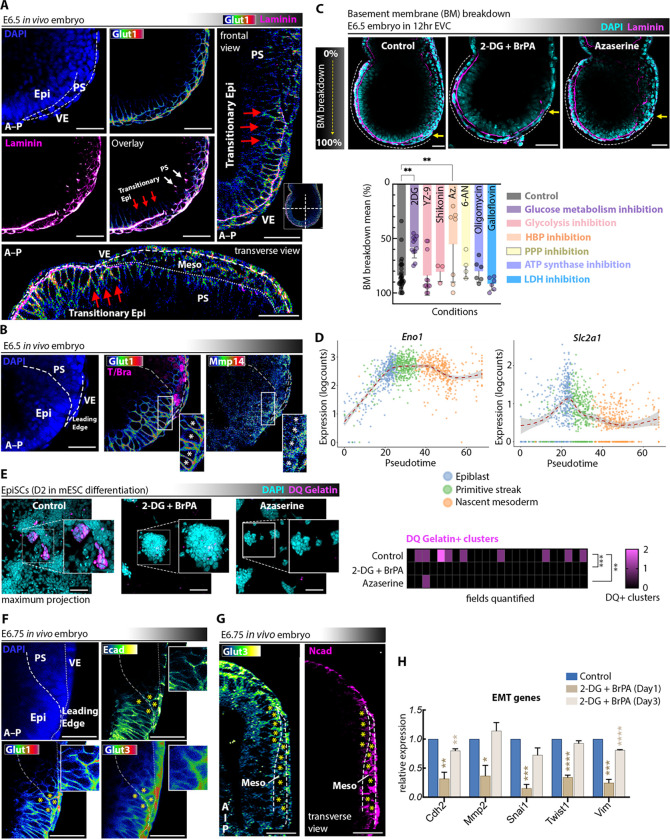
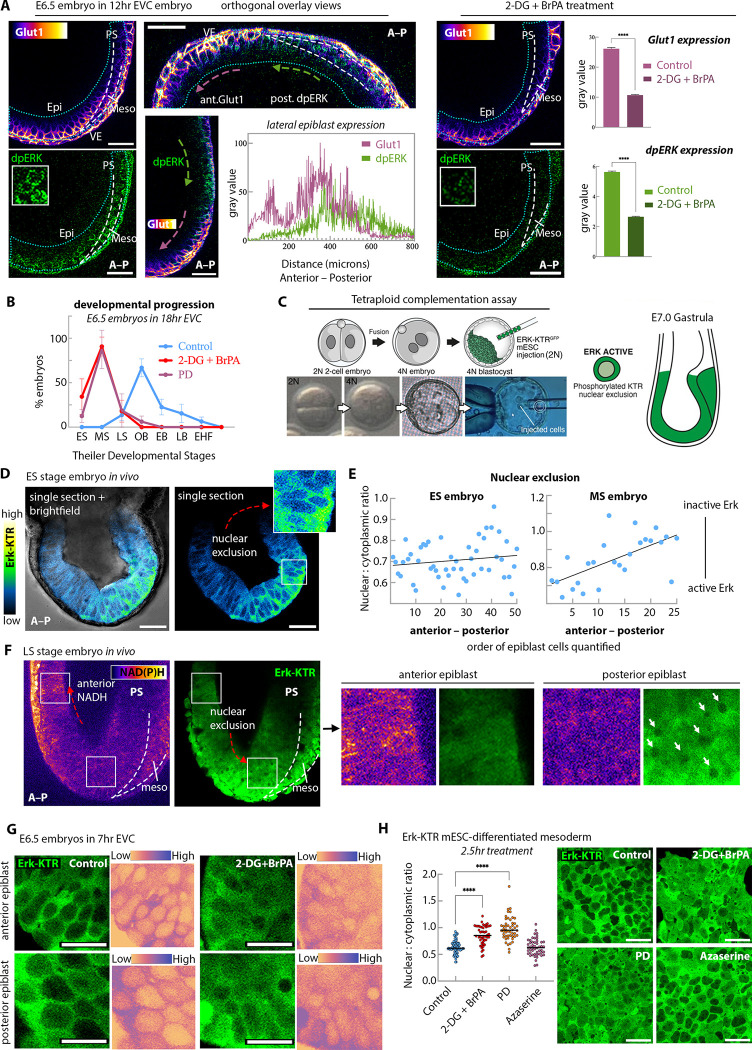
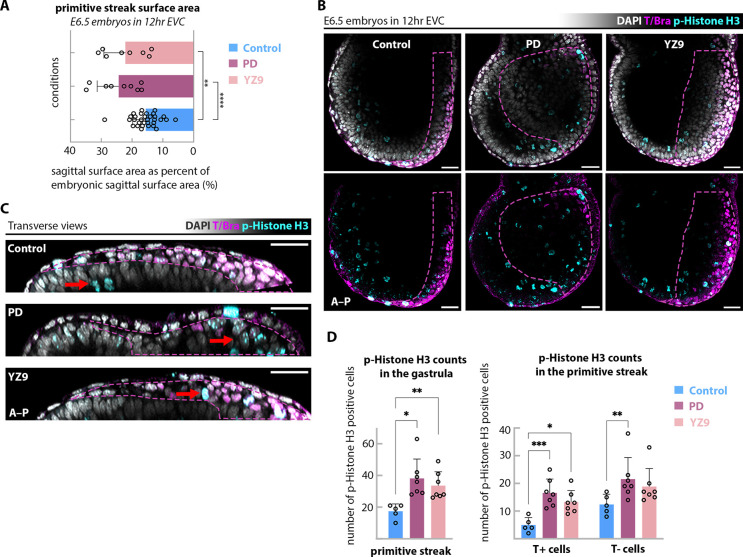
Gastrulation is considered the sine qua non of embryogenesis, establishing a multidimensional structure and the spatial coordinates upon which all later developmental events transpire. At this time, the embryo adopts a heavy reliance on glucose metabolism to support rapidly accelerating changes in morphology, proliferation, and differentiation. However, it is currently unknown how this conserved metabolic shift maps onto the three-dimensional landscape of the growing embryo and whether it is spatially linked to the orchestrated cellular and molecular processes necessary for gastrulation. Here we identify that glucose is utilised during mouse gastrulation via distinct metabolic pathways to instruct local and global embryonic morphogenesis, in a cell type and stage-specific manner. Through detailed mechanistic studies and quantitative live imaging of mouse embryos, in parallel with tractable in vitro stem cell differentiation models and embryo-derived tissue explants, we discover that cell fate acquisition and the epithelial-to-mesenchymal transition (EMT) relies on the Hexosamine Biosynthetic Pathway (HBP) branch of glucose metabolism, while newly-formed mesoderm requires glycolysis for correct migration and lateral expansion. This regional and tissue-specific difference in glucose metabolism is coordinated with Fibroblast Growth Factor (FGF) activity, demonstrating that reciprocal crosstalk between metabolism and growth factor signalling is a prerequisite for gastrulation progression. We expect these studies to provide important insights into the function of metabolism in other developmental contexts and may help uncover mechanisms that underpin embryonic lethality, cancer, and congenital disease.


Conflict of interest statement

Conflict of interest statement The authors declare no conflict of interest.

Figures

Figure 1.
Figure 1.. A wave of glycolytic activity precedes mouse gastrulation.
(A) Schematic of the gastrulation stage mouse embryo. (B) Schematic of the glucose-uptake ‘wave’ phenotype throughout the progressive stages of mouse gastrulation. (C) Single Z-sections of: Left: in utero-dissected gastrula stage embryos stained for Glut1 and Snai1 (n=55 embryos: ES n=8, MS n=26, LS n=19); Right: gastrula stage embryos following 2h of ex-vivo incubation with 2-NBDG (n=27 embryos: ES n=5, MS n=13, LS n=9). Epiblast, dotted-white regions; PS, dotted-magenta regions. Scale bars represent 40μm. Heatmap intensity colours used via Fiji’s LUT. (D) Fig. 1B–C quantifications of the mean angle of Glut1/3 expression in the epiblast, plotted against the mean of the PS’s distal length. As development progresses, the region of epiblast Glut expression extends anteriorly. (E) Orthogonal transverse sections showing a wave of Glut1 and 2-NBDG expression in epiblast (dotted-white regions) and lateral mesodermal wings (dotted-yellow regions). Scale bars represent 40μm. Heatmap intensity colours used via Fiji’s LUT. (F) In utero-dissected MS embryo stained for Glut3 and Ncad (n=15 embryos). Scale bars represent 40μm. Heatmap intensity colours used via Fiji’s LUT. (G) 3D-reconstructed images of a 2-NBDG incubated MS embryo, revealing a gradient of glucose uptake in epiblast (pink asterisks) and migratory mesoderm (white asterisks). Heatmap intensity colors used via Fiji’s LUT. (H) Live multi-photon imaging of TCF/LEF-GFP (marks primitive streak) reporter embryos for endogenous NAD(P)H, as a readout of glycolytic activity (n=12 embryos: ES n=7, MS n=5). Epiblast, white-dotted regions; and PS, green-dotted regions. Scale bars represent 40μm. (I) Live multi-photon NAD(P)H imaging of embryos following 2h incubation with 2-NBDG (n=2 MS embryos). Scale bars represent 40μm.
Figure 2.
Figure 2.. Glucose metabolism via HBP is necessary for mesoderm fate acquisition and maintenance.
(A) Schematic of glucose metabolism and its three branches: grey = Hexosamine Biosynthetic Pathway (HBP); pink = core/late-stage glycolysis; green = Pentose Phosphate Pathway (PPP). Red text indicates chemical inhibitors and their metabolic targets in blue. (B) Representative Z-sections showing the expression pattern of Sox2, T/Bra, and Lef1 in embryos treated with 2-DG + BrPA for 18h ex vivo and (C) their Theiler developmental outcomes: Control (n=17), 2-DG + BrPA (n=24) across 6 experimental replicates; early streak (ES), mid-streak (MS), late streak (LS), no bud (OB), early bud (EB), late-bud (LB), early head fold (EHF). Scale bars represent 40μm. Plots show mean ± SEM. On average, ~53% of control embryos develop to OB stage gastrulation, while ~73% of 2-DG + BrPA treated embryos only develop to MS stage gastrulation. (D) Representative Z-sections of 2-DG + BrPA and 5μM Azaserine-treated embryos following 12h ex vivo culture (EVC). Inhibiting glycolysis impairs PS elongation (cyan dotted-lines) and reduces T/Bra expression (cyan). Scale bars represent 40μm. (E) Comparison of PS distal elongation lengths in embryos treated with various metabolic inhibitors: Control (n=44), 2-DG + BrPA (n=16), YZ9 (n=9), 5μM Shikonin (n=9), 5μM Azaserine (n=21), 2μM 6-AN (n=4), 10μM Oligomycin (n=8), Galloflavin (n=6). Plots show mean ± SEM. Two-tailed parametric t-test. **P < 0.01, ****P < 0.0001. (F) Top: Schematic of mesoderm directed-differentiation steps from mESCs. Bottom: 2-DG + BrPA, Azaserine, and PD-treated groups show a significant absence of Eomes (cyan) and T/Bra (magenta). Scale bars represent 100μm. 3 independent experimental replicates. (G) qPCR analyses of directed-differentiation experiments, querying transcript changes in mesodermal, pluripotency (treatment from day1–4 or day3–4), and (H) HBP genes (treatment from day1–4) across 3 independent experimental replicates. Plots show mean ± SEM. Two-tailed parametric t-test. *P < 0.05, **P < 0.01, ****P < 0.0001.
Figure 3.
Figure 3.. Glucose uptake is linked to an EMT programme.
(A) Epiblast (Epi) Glut1 (heatmap intensity colours used via Fiji’s LUT) expression co-localises to regions of intact basement membrane identified via Laminin (magenta) staining (n=28 embryos), as well as regions of (B) high Mmp14 (heatmap intensity colours used via Fiji’s LUT) activity (n=3 embryos), particularly in Epi cells bordering the PS (white asterisks). Scale bars represent 40μm. (C) 2-DG + BrPA and Azaserine-treated embryos show a delay in their BM distal breakdown lengths, identified with Laminin (magenta) staining, while embryos cultured with other metabolic inhibitors show no such defect: Control (n=30), 2-DG + BrPA (n=11), YZ9 (n=12), Shikonin (n=3), Azaserine (n=7), 6-AN (n=4), Oligomycin (n=6), Galloflavin (n=6). Plots show mean ± SEM. Two-tailed parametric t-test. **P < 0.01. Scale bars represent 40μm. (D) Principal curves of glycolytic genes over pseudo-time (Epiblast to Primitive Streak to Nascent Mesoderm states) in gastrulating in vivo mouse embryos. (E) Representative outcome of an in vitro EMT assay with DQ Gelatin (magenta), applied on Epiblast-like Stem Cell (EpiSC) differentiation stage (Day 2, refer to Figure 2F). Quantifications show the number of DQ+ clusters identified in each imaging field (n=25 fields quantified over 2 independent experimental replicate). Two-tailed parametric t-test. **P < 0.01, ***P < 0.001 (F) Z-section of a posterior MS stage embryo showing Glut1/3 co-localizations to Cadherins, especially within epiblast and PS cell neighbours (ECad, white asterisk), and (G) within migratory mesoderm (NCad). Heatmap intensity colours used via Fiji’s LUT. Scale bars represent 40μm. (H) qPCR results of directed-differentiation experiments, show a downregulation of key EMT transcripts upon 2-DG + BrPA treatment across 3 experimental replicates. Plots show mean ± SEM. Two-tailed parametric t-test. *P < 0.05, **P < 0.01, ***P < 0.001, ****P < 0.0001.
Figure 4.
Figure 4.. Glucose metabolism occurs upstream of FGF activity in the epiblast.
(A) Left: Single Z-sections of sagittal, frontal, and transverse views of control mouse embryo’s epiblast (green-dotted line) show that Glut1 expression (heatmap intensity colours used via Fiji’s LUT) is anterior and distal to dpERK expression (green). Plot profile shows expression intensities in the epiblast across the anterior-posterior axis of the orthogonal image above. Right: 2-DG + BrPA treatment abrogates Glut1 and dpERK activity in cells within the epiblast (green-dotted line): Control (n=3 embryos), 2-DG + BrPA (n=4 embryos). Scale bars represent 40μm. Two-tailed parametric t-test. ****P < 0.0001. Plots show mean ± SEM. Two-tailed parametric t-test. (B) Mouse gastrulas cultured with 2-DG + BrPA or PD for 18h ex vivo show equivalent developmental delay: Control (n=21), 2-DG + BrPA (n=24), PD (n=16). Plots show mean ± SEM. Two-tailed parametric t-test. (C) Schematic of tetraploid complementation assay, generating embryos where all cells of the embryo proper are derived from Erk-KTRGFP mESCs. (D) Erk-KTRGFP signal (heatmap intensity colours) from live-imaging allows for (E) quantifications of Erk activity by calculating nuclear-to-cytoplasmic (N:C) ratio in the epiblast tissue. As development proceeds, Erk activity becomes graded across the anterior-posterior axis. Plots show epiblast N:C ratio in representative ES (R2 = 0.24) and MS (R2 = 0.40) embryos generated by tetraploid complementation. Scale bars represent 40μm. (F) Multi-photon live imaging confirms that glycolysis (NAD(P)H activity) occurs anterior to Erk activation in the epiblast (nuclear-excluded regions). n=3 embryos. Zoom insets from anterior and posterior epiblast regions shown on the right. For NAD(P)H signal, heatmap intensity colours used via Fiji’s LUT. G) 2-DG + BrPA treatment of a representative MS gastrula stage embryo (generated by tetraploid complementation) decreases the strength of the nuclear-excluded phenotype of Erk activity in anterior and posterior epiblast regions. Heatmap intensity colours used on the right for better visualization. Scale bars represent 20μm. (H) Short 2-DG + BrPA treatment (2.5h) of mesoderm-differentiated Erk-KTRGFP cells at day 4 shows a significant reduction in Erk activity (n≥50 cells per group quantified). Plots show mean ± SEM. Two-tailed parametric t-test. ****P < 0.0001. Scale bars represent 40μm.
Figure 5.
Figure 5.. Late-stage glycolysis links with FGF signalling in the newly formed mesoderm.
(A) PS surface areas calculated from mid-embryo sagittal Z-sections show a significant size increase in PD (n=9 embryos) and YZ9 (n=8 embryos) treated groups compared to control (n=32 embryos). Plots show mean ± SEM. Two-tailed parametric t-test. **P < 0.01, ****P < 0.0001. (B) Representative single Z-sections show that PS surface areas (marked by T/Bra, in magenta) are expanded in PD & YZ9 treated embryos (magenta-dotted regions), with high phospho-Histone H3 (cyan) expression in those regions: Control (n=7), PD (n=6), YZ9 (n=7). Scale bars represent 40μm. (C) Transverse sections confirm expanded PS phenotype and phospho-Histone H3 localizations in the PS (red arrows). Scale bars represent 40μm. (D) Phospho-Histone H3 counts in the PS (indicated via morphology or T expression) are significantly increased in PD and YZ9 treated embryos. Plots show mean ± SEM. Two-tailed parametric t-test. *P < 0.05, **P < 0.01,***P < 0.001.
Figure 6.
Figure 6.. Glucose metabolism is necessary for proper mesoderm migration.
(A) Average lengths of lateral mesodermal wings are significantly shorter in 2-DG + BrPA (n=7 embryos), YZ9 (n=7 embryos), and PD (n=10 embryos) treated embryos compared to control (n=38 embryos). Plots show mean ± SEM. Two-tailed parametric t-test. *P < 0.05, **P < 0.01,***P < 0.001. (B) Schematic of mesoderm explant isolations of embryos for subsequent live-imaging of ex situ migration dynamics. (C) Representative maximum projection images of Control, PD, and YZ9 treated mesodermal explants at the end of 4h live imaging, with red asterisks indicating daughter cells that have divided since the start of imaging. Reporter LEF-GFP signal (cyan) was used for nuclear segmentations and tracking. Scale bars represent 40μm. (D) Plots show migration readouts across 3 independent experimental replicates of explants generated from AIVIA cell-tracking software, showing that PD and YZ9 treated mesoderm have higher rates of proliferation and shorter migratory lengths compared to control. ‘Cell proliferation’ datapoints represent independent experiments. ‘Cell displacement’ and ‘mean velocity’ datapoints represent unique cell tracks. Plots show mean ± SEM. Two-tailed parametric t-test. *P < 0.05, **P < 0.01,***P < 0.001, ****P < 0.0001. Azaserine treatment shows no significant difference. (E) Invadapodia assay of mesoderm explants on FITC-Fibronectin-coated plates, showing impaired ECM substrate degradation in 2-DG + BrPA, YZ9, and PD treated explants (n=3 experimental replicates). Scale bars represent 100μm. Plots show mean ± SEM. Two-tailed parametric t-test. **P < 0.01, ***P < 0.001, ****P < 0.0001. Those treatment groups also resulted in (F) increased ECad expression (heatmap intensity colours used for better visualisation). Scale bars represent 100μm. (G) Pathway enrichment (KEGG) of the differentially expressed genes (DEGs) in PD and YZ9 treated mesoderm explants, specifically shows downregulated terms.

References

    1. Agathocleous M., Love N.K., Randlett O., Harris J.J., Liu J., Murray A.J., and Harris W.A. (2012). Metabolic differentiation in the embryonic retina. Nat Cell Biol 14, 859–864. - PMC - PubMed
    1. Akella N.M., Ciraku L., and Reginato M.J. (2019). Fueling the fire: emerging role of the hexosamine biosynthetic pathway in cancer. BMC Biol 17, 52. - PMC - PubMed
    1. Arnold S.J., and Robertson E.J. (2009). Making a commitment: cell lineage allocation and axis patterning in the early mouse embryo. Nat Rev Mol Cell Biol 10, 91–103. - PubMed
    1. Artym V.V., Yamada K.M., and Mueller S.C. (2009). ECM degradation assays for analyzing local cell invasion. Methods Mol Biol 522, 211–219. - PubMed
    1. Barban S., and Schulze H.O. (1961). The effects of 2-deoxyglucose on the growth and metabolism of cultured human cells. J Biol Chem 236, 1887–1890. - PubMed

Publication types