[Preprint]. 2023 Jun 9:2023.06.07.544052.
doi: 10.1101/2023.06.07.544052.

Enteric glial hub cells coordinate intestinal motility

Affiliations

Enteric glial hub cells coordinate intestinal motility

Marissa A Scavuzzo et al. bioRxiv. .

Abstract

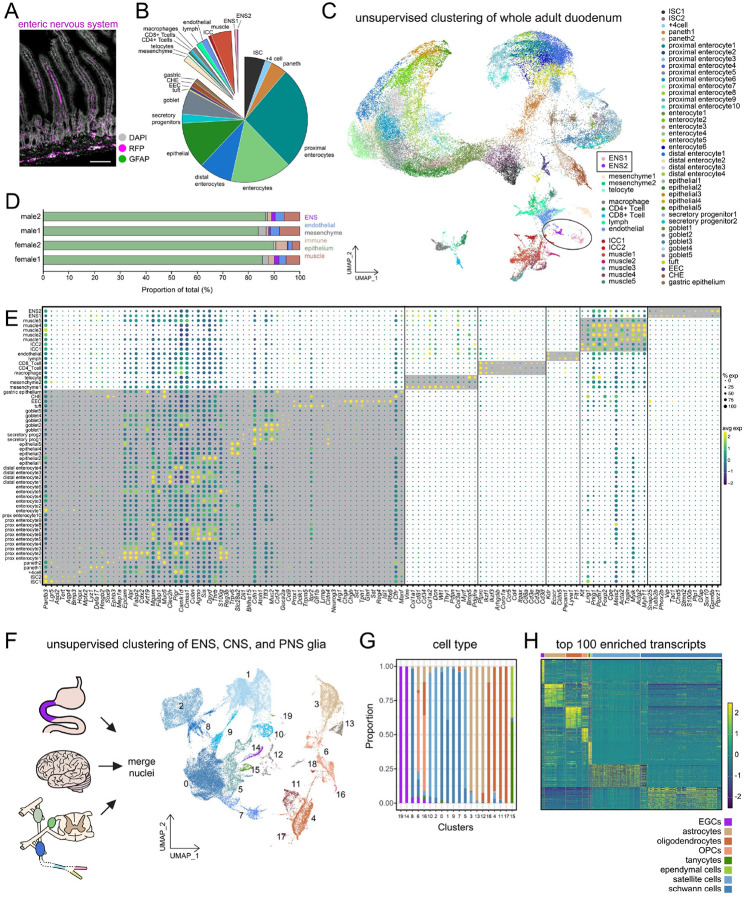
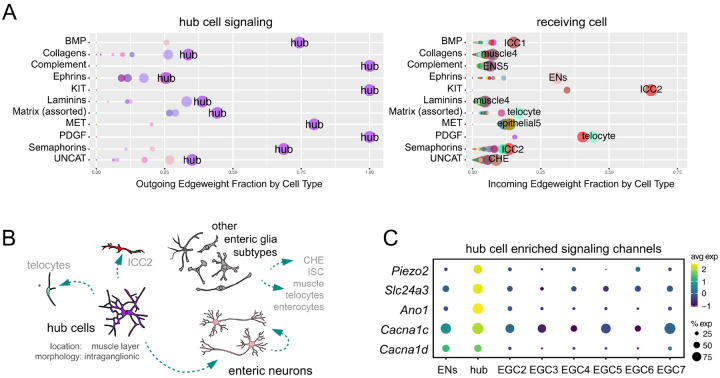
Enteric glia are the predominant cell type in the enteric nervous system yet their identities and roles in gastrointestinal function are not well classified. Using our optimized single nucleus RNA-sequencing method, we identified distinct molecular classes of enteric glia and defined their morphological and spatial diversity. Our findings revealed a functionally specialized biosensor subtype of enteric glia that we call "hub cells." Deletion of the mechanosensory ion channel PIEZO2 from adult enteric glial hub cells, but not other subtypes of enteric glia, led to defects in intestinal motility and gastric emptying in mice. These results provide insight into the multifaceted functions of different enteric glial cell subtypes in gut health and emphasize that therapies targeting enteric glia could advance the treatment of gastrointestinal diseases.


Conflict of interest statement

Competing interests: The authors declare that they have no competing interests related to this work.

Figures

Figure 1.
Figure 1.. Enteric glia are a unique population of cells.
(A) Labeling the enteric nervous system in the adult Sox10-cre; Ai14(RCL-tdT) mouse duodenum. RFP marks enteric nervous system cells, GFAP is shown in green, and nuclei are marked in white by DAPI. Scale bar = 100 um. (B) Proportion of cell types in the adult mouse duodenum from CitraPrep and snRNA-seq (n=4 mice, 57,033 nuclei). (C) snRNAseq of duodenal nuclei visualized by Uniform Manifold Approximation and Projection (UMAP), colored by cell type identity, and annotated post hoc. (D) Proportion of broad cell types captured in each of our biological replicates. (E) Cell type specific marker expression (columns) in clusters (rows) as shown in (C). Broad cell type classification is shown with dark gray boxes indicating from left to right epithelial cells, mesenchymal cells, immune cells, vasculature, musculature, and enteric nervous system cells. Differentially expressed transcripts are detailed in Supplemental Table 1. The size of each circle indicates percentage of cells in the cluster that express the marker (≥1 UMI) while the color shows the average expression of transcript in cells. ISC, intestinal stem cell; EEC, enteroendocrine cell; CHE, Cftr high expressing epithelial cell; lymph, lymphocytes; ICC, interstitial cells of Cajal; ENS, enteric nervous system. Datasets are provided in Table S1. (F) On left, schematic of study design. Duodenal and cortical tissue were dissected and processed for snRNAseq. Datasets for comparison were obtained from the cortex (GSE132044), ventromedial hypothalamus (GSE172204), spinal cord (GSE103892), sciatic nerve (GSE182098), peroneal nerve (GSE182098), sural nerve (GSE182098), nodose ganglion and vagal nerve (GSE182098 and GSE138651), dorsal root ganglion (GSE175421), and superior cervical ganglion (GSE175421). Individual datasets shown in Fig. S4 and S5. On right, snRNAseq of glial cells spanning the central, peripheral, and enteric nervous systems colored by unsupervised clusters and visualized by UMAP (n=35 mice, 46,467 nuclei). (G) Proportion mapping of cell types to unsupervised clusters. Cell types are shown by color with key shown to the bottom right. Proportion of cells are shown on the y-axis while columns binned in the x-axis show unsupervised clusters. (H) Top 100 differentially expressed transcripts enriched in each glial cell type. Individual transcripts are shown in rows, cell types are clustered together in columns with color annotation above. Datasets are provided in Table S2.
Figure 2.
Figure 2.. Enteric glia are molecularly, spatially, and morphologically diverse.
(A) UMAP plot of snRNAseq showing subclustered enteric nervous system cells colored by unsupervised clustering by Seurat. (B) Heatmap of the top 10 differentially expressed genes (rows) in each cluster (columns). Datasets are provided in Table S4. (C) Representative images of enteric glial cells in culture capturing 6 different morphologies. Scale bars = 20 um. (D) Cell type specific marker expression (columns) in clusters (rows). The size of each circle indicates percentage of cells in the cluster that express the marker (≥1 UMI) while the color shows the average expression of transcript in cells. (E) Representative immunostaining of cultured enteric glial cells with different morphologies and marker expression. Plp1-eGFP is shown in green while NFIA is shown in magenta. (F) Quantification of NFIA/eGFP+ in each morphological group shown as percentage. P values show one-way ANOVA with unpaired t and Welch’s correction. (G) Representative immunostaining of enteric glial cell subtype enriched markers in the adult Sox10-cre; RCL-tdT mouse duodenum. Intestinal compartments are labeled with boundaries marked by dashed lines. tdTomato is marked by RFP in magenta while nuclei are marked in white by DAPI. White circle shows co-expression of PIEZO2/GFAP in the ENS while yellow circles show PIEZO2 without GFAP outside of the ENS in the villi. Scale bars = 100 um. (H) Quantification of the spatial distribution of hub cell enriched markers in different intestinal compartments. The full spatial analysis of multiple enteric glial subtype enriched markers across compartments is shown in Fig. S6G. P values from two-way ANOVA with multiple comparisons. All error bars show SEM with biological replicates shown as individual dots.
Figure 3.
Figure 3.. Subtype-specific enteric glia functional interaction network.
(A) Interactome analyses of putative ligand-receptor pairs using the FANTOM5 database (p<0.00001, percent>0.2). Signaling classes are grouped in rows with enriched cell types shown across the x-axis and sending cells (ligands) on left and receiving cells (receptors) on right. Datasets are provided in Table S6. (B) Depiction of enteric nervous system signaling relationships (in teal). Hub cell transcripts are enriched in intraganglionic cells and reside in the muscle layer. (C) Dot plot showing expression of the top 5 significantly enriched transcripts ontologically associated with monoatomic ion channels. The size of each circle indicates percentage of cells in the cluster that express the marker (≥1 UMI) while the color shows the average expression of transcript in cells.
Figure 4.
Figure 4.. Hub cells regulate gut motility via mechanosensation.
(A) Intestine-on-a-chip platform engineered on coverslips for high resolution, live Ca2+ imaging under shear stress with microfluidics. Longitudinal muscle with myenteric plexus was dissected from mice with the calcium indicator GCamP6f expressed in enteric glia via tamoxifen driven expression of Cre in Sox10+ cells. Brightfield image shows an overview of the coverslip with tissues in chambers. (B) Representative image of mechanoresponsive enteric glia 10 seconds before and 20 seconds after 1dyn/cm2 shear stress is applied. Pie chart shows quantification of cells responding only at baseline (without shear stress), only after application of shear stress at 1dyn/cm2 and reversal of this response with D-GsMTx4, which inhibits PIEZO2. Cells that are responsive in both conditions are annotated, while cells active in the presence of inhibitor D-GsMTx4 at rest, after stimulation, or in both conditions are shown in a bracket. (C) Immunostaining of PIEZO2 (in magenta) in the muscle layer of the duodenum overlapping with pan-enteric glia marker SOX10 (in white) and subtype enteric glia marker GFAP (in green) with enteric glia specific adult PIEZO2 knockout shown on the bottom in Piezo2fl/fl; Sox10-creERt2 mice. Separate channels are shown in grayscale. Scale bars = 50 um. (D) Carmine red dye in fecal pellets marks transit time. (E) Total gastrointestinal transit time measuring time from gavage of carmine red dye to the appearance of red stool in littermate controls (n=2) and Piezo2fl/fl; Sox10-creERt2 mice (n=5). (F) Gastrointestinal transit time assay with representative results from the stomach and small intestine. Each well represents contents from one equal sized segment of the small intestine, with the first well showing the stomach and the last well the cecum. (G) The geometric center of fluorescence shows the location of the bolus in the small intestine in littermate controls (n=8) and Piezo2fl/fl; Sox10-creERt2 mice (n=15). (H) Gastric emptying in littermate controls (n=9) and Piezo2fl/fl; Sox10-creERt2 mice (n=22). (I) Representative oscillations recorded from ex vivo longitudinal muscle with myenteric plexus under shear stress stimulation. (J) Quantification showing the number of oscillations over a 30 second time frame in littermate controls (n=4) and Piezo2fl/fl; Sox10-creERt2 (n=5) mouse tissue stimulated with 1dyn/cm2 shear stress ex vivo. (K) Dot plot showing expression of Piezo2, Gfap, and Plp1 in computationally selected and subsetted Gfap+ cells and Plp1+ cells. The size of each circle indicates percentage of cells in the cluster that express the marker (≥1 UMI) while the color shows the average expression of transcript in cells. (L) The geometric center of fluorescence shows the location of the bolus in the small intestine in littermate controls (n=18) and Piezo2fl/fl; Gfap-creERt2 mice (n=12). (M) Gastric emptying in littermate controls (n=18) and Piezo2fl/fl; Gfap-creERt2 mice (n=11). (N) The geometric center of fluorescence shows the location of the bolus in the small intestine in littermate controls (n=12) and Piezo2fl/fl; Plp1-creERt2 mice (n=11). (O) Gastric emptying in littermate controls (n=12) and Piezo2fl/fl; Plp1-creERt2 mice (n=11). For data in (E), (G), (H), (J), (L), (M), (N), (O), individual mice are shown as individual dots, error bars show SEM and p values are from Welch’s t tests.

References

    1. Plasschaert L. W. et al., A single-cell atlas of the airway epithelium reveals the CFTR-rich pulmonary ionocyte. Nature 560, 377–381 (2018). - PMC - PubMed
    1. Yadav A. et al., A cellular taxonomy of the adult human spinal cord. Neuron 111, 328–344 e327 (2023). - PMC - PubMed
    1. Habib N. et al., Div-Seq: Single-nucleus RNA-Seq reveals dynamics of rare adult newborn neurons. Science 353, 925–928 (2016). - PMC - PubMed
    1. Di Bella D. J. et al., Molecular logic of cellular diversification in the mouse cerebral cortex. Nature 595, 554–559 (2021). - PMC - PubMed
    1. Stogsdill J. A. et al., Pyramidal neuron subtype diversity governs microglia states in the neocortex. Nature 608, 750–756 (2022). - PMC - PubMed

Publication types