

This is a preprint.
From Voxels to Prognosis: AI-Driven Quantitative Chest CT Analysis Forecasts ICU Requirements in 78 COVID-19 Cases
- PMID: 37333197
- PMCID: PMC10275043
- DOI: 10.21203/rs.3.rs-3027617/v5
From Voxels to Prognosis: AI-Driven Quantitative Chest CT Analysis Forecasts ICU Requirements in 78 COVID-19 Cases
Update in
-
Artificial intelligence (AI)-assisted chest computer tomography (CT) insights: a study on intensive care unit (ICU) admittance trends in 78 coronavirus disease 2019 (COVID-19) patients.J Thorac Dis. 2024 Feb 29;16(2):1009-1020. doi: 10.21037/jtd-23-1150. Epub 2024 Feb 26. J Thorac Dis. 2024. PMID: 38505008 Free PMC article.
Abstract
Background: The aim of the current study was to investigate the distribution and extent of lung involvement in patients with COVID-19 with AI-supported, automated computer analysis and to assess the relationship between lung involvement and the need for intensive care unit (ICU) admission. A secondary aim was to compare the performance of computer analysis with the judgment of radiological experts.
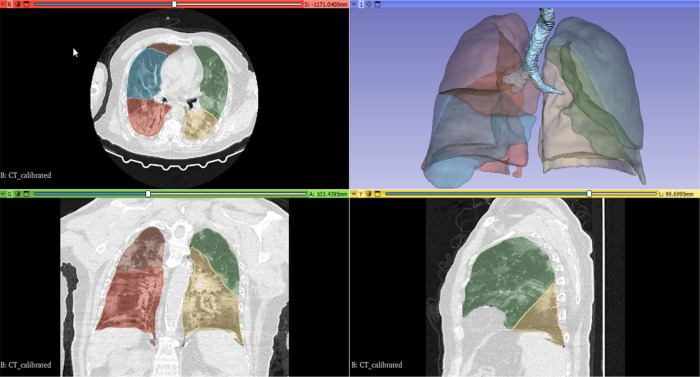
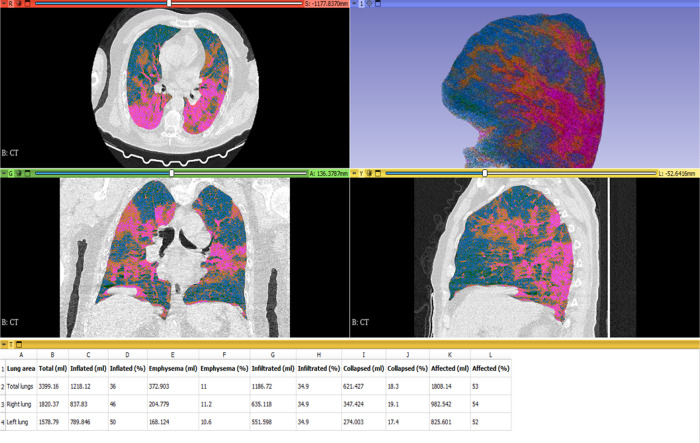
Methods: A total of 81 patients from an open-source COVID database with confirmed COVID-19 infection were included in the study. Three patients were excluded. Lung involvement was assessed in 78 patients using computed tomography (CT) scans, and the extent of infiltration and collapse was quantified across various lung lobes and regions. The associations between lung involvement and ICU admission were analyzed. Additionally, the computer analysis of COVID-19 involvement was compared against a human rating provided by radiological experts.
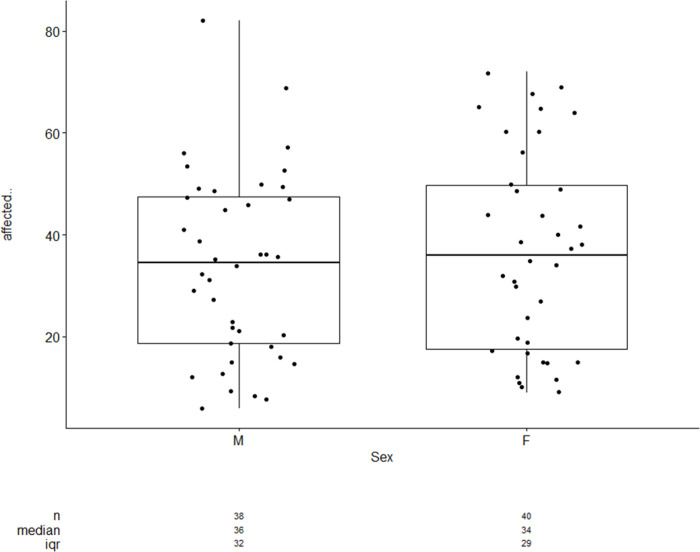
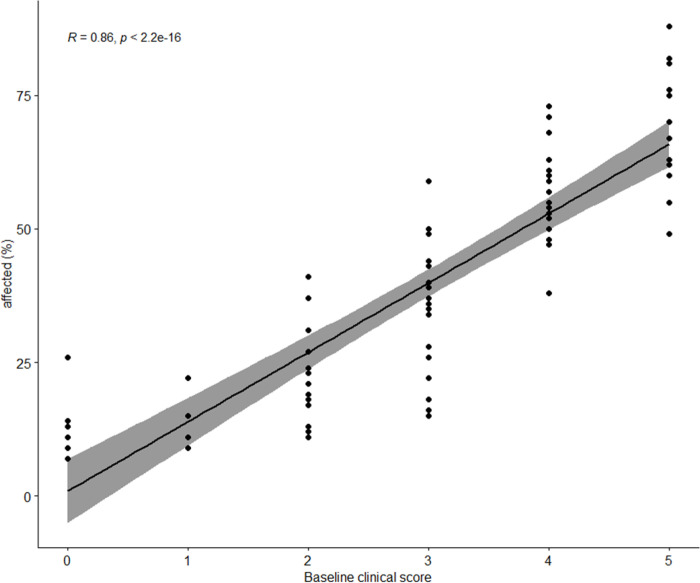
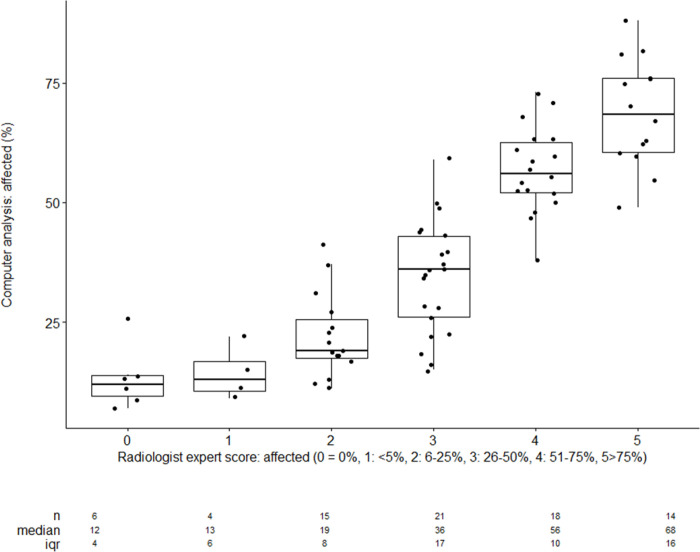
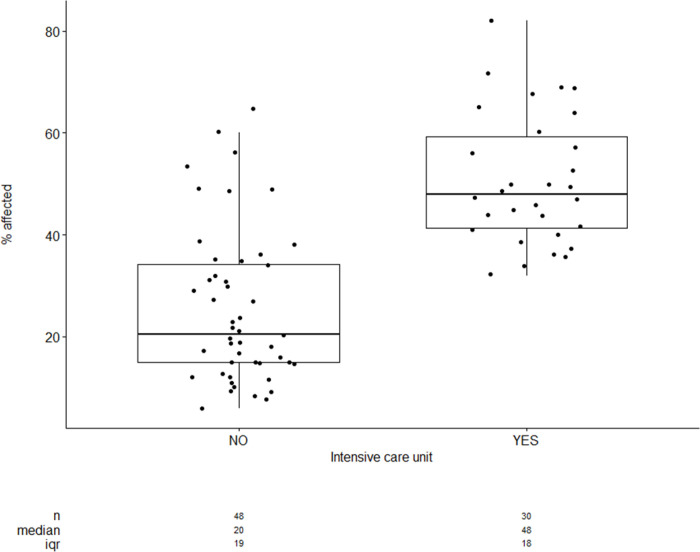
Results: The results showed a higher degree of infiltration and collapse in the lower lobes compared to the upper lobes (p < 0.05) No significant difference was detected in the COVID-19-related involvement of the left and right lower lobes. The right middle lobe demonstrated lower involvement compared to the right lower lobes (p < 0.05). When examining the regions, significantly more COVID-19 involvement was found when comparing the posterior vs. the anterior halves of the lungs and the lower vs. the upper half of the lungs. Patients, who required ICU admission during their treatment exhibited significantly higher COVID-19 involvement in their lung parenchyma according to computer analysis, compared to patients who remained in general wards. Patients with more than 40% COVID-19 involvement were almost exclusively treated in intensive care. A high correlation was observed between computer detection of COVID-19 affections and expert rating by radiological experts.
Conclusion: The findings suggest that the extent of lung involvement, particularly in the lower lobes, dorsal lungs, and lower half of the lungs, may be associated with the need for ICU admission in patients with COVID-19. Computer analysis showed a high correlation with expert rating, highlighting its potential utility in clinical settings for assessing lung involvement. This information may help guide clinical decision-making and resource allocation during ongoing or future pandemics. Further studies with larger sample sizes are warranted to validate these findings.
Keywords: COVID-19; Clinical decision-making; Computer analysis; Intensive care unit (ICU) admission; Lung involvement; Radiological expert.
Conflict of interest statement
Conflicts of Interest: All authors have completed the ICMJE uniform disclosure form (available at https:/qims.amegroups.com/article/view/10.21037/qims-22-718/coif). The authors have no conflicts of interest to declare.
Figures
Similar articles
-
Artificial intelligence (AI)-assisted chest computer tomography (CT) insights: a study on intensive care unit (ICU) admittance trends in 78 coronavirus disease 2019 (COVID-19) patients.J Thorac Dis. 2024 Feb 29;16(2):1009-1020. doi: 10.21037/jtd-23-1150. Epub 2024 Feb 26. J Thorac Dis. 2024. PMID: 38505008 Free PMC article.
-
Risk Stratification for ECMO Requirement in COVID-19 ICU Patients Using Quantitative Imaging Features in CT Scans on Admission.Diagnostics (Basel). 2021 Jun 3;11(6):1029. doi: 10.3390/diagnostics11061029. Diagnostics (Basel). 2021. PMID: 34205176 Free PMC article.
-
Chest CT scan features from 302 patients with COVID-19 in Jordan.Eur J Radiol Open. 2020;7:100295. doi: 10.1016/j.ejro.2020.100295. Epub 2020 Dec 2. Eur J Radiol Open. 2020. PMID: 33288999 Free PMC article.
-
Comparison of the computed tomography findings in COVID-19 and other viral pneumonia in immunocompetent adults: a systematic review and meta-analysis.Eur Radiol. 2020 Dec;30(12):6485-6496. doi: 10.1007/s00330-020-07018-x. Epub 2020 Jun 27. Eur Radiol. 2020. PMID: 32594211 Free PMC article.
-
Coronavirus Disease 2019 (COVID-19) CT Findings: A Systematic Review and Meta-analysis.J Am Coll Radiol. 2020 Jun;17(6):701-709. doi: 10.1016/j.jacr.2020.03.006. Epub 2020 Mar 25. J Am Coll Radiol. 2020. PMID: 32283052 Free PMC article.
References
Publication types
Grants and funding
LinkOut - more resources
Full Text Sources
