[Preprint]. 2023 Jun 8:2023.06.06.543919.
doi: 10.1101/2023.06.06.543919.

EZH2 inhibition promotes tumor immunogenicity in lung squamous cell carcinomas

Affiliations

EZH2 inhibition promotes tumor immunogenicity in lung squamous cell carcinomas

Tanner J DuCote et al. bioRxiv. .

Update in

Abstract

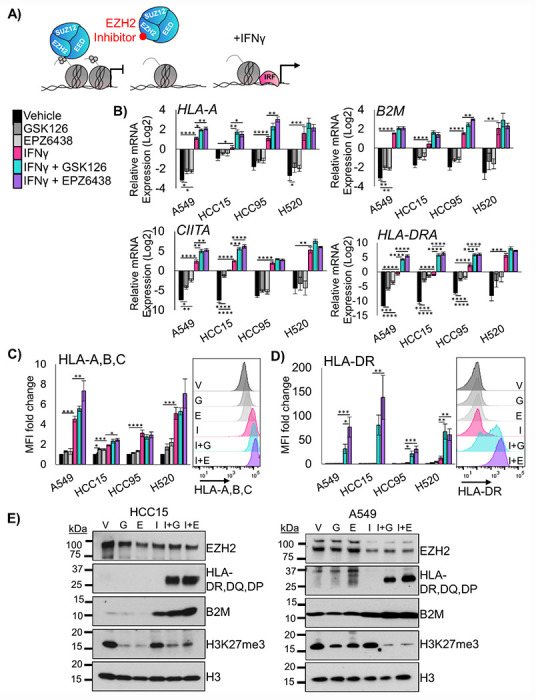
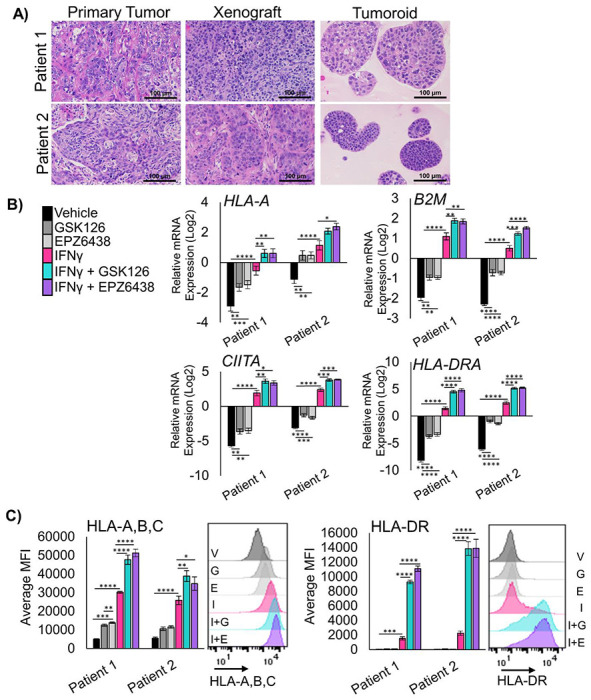
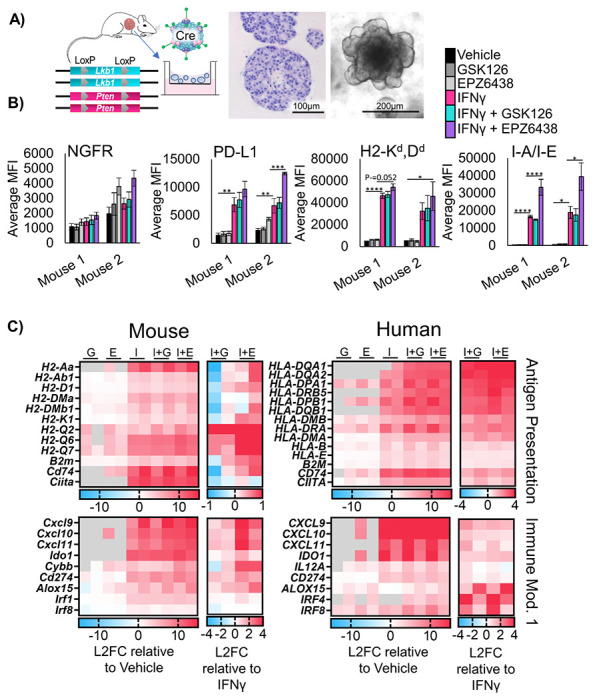
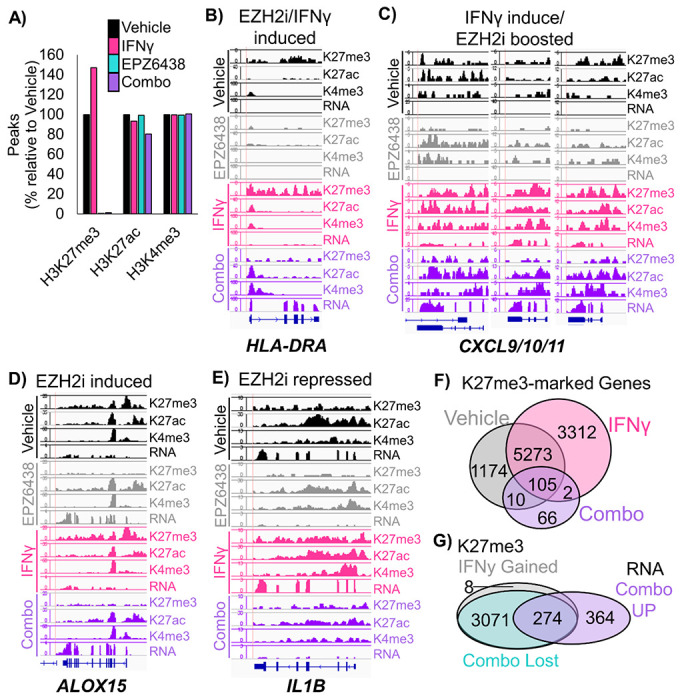
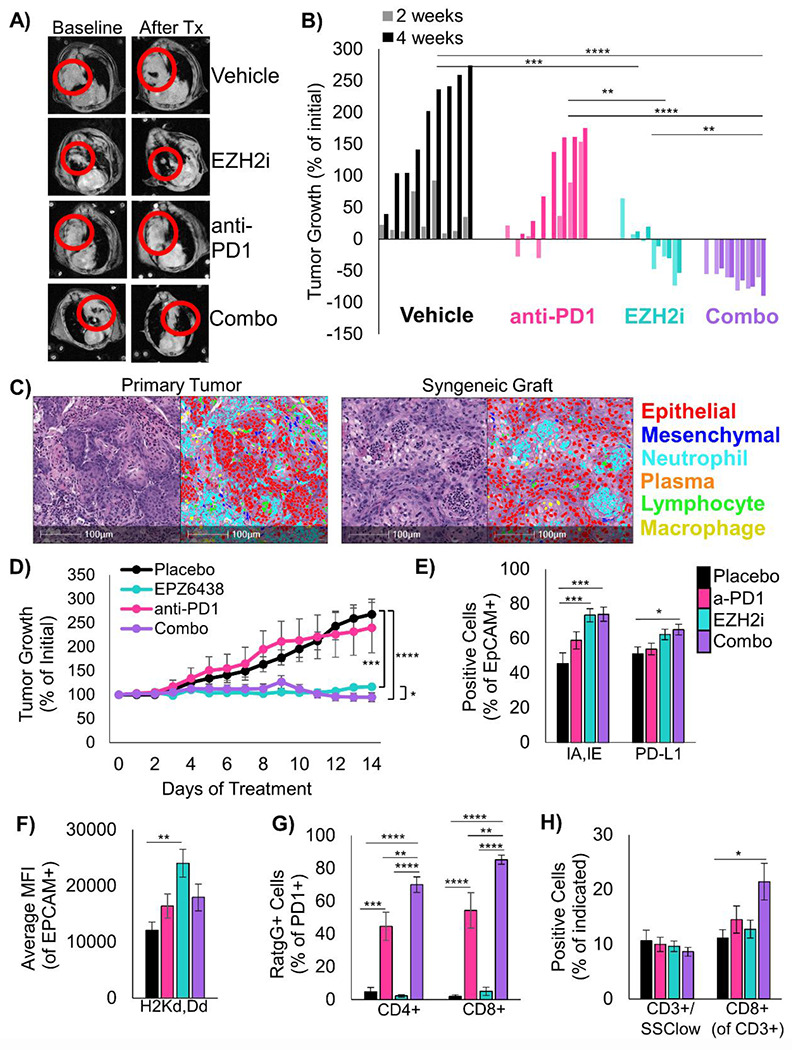
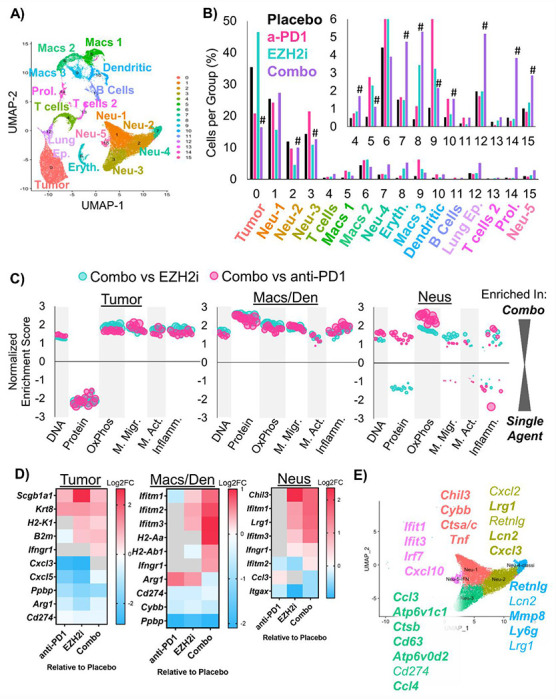
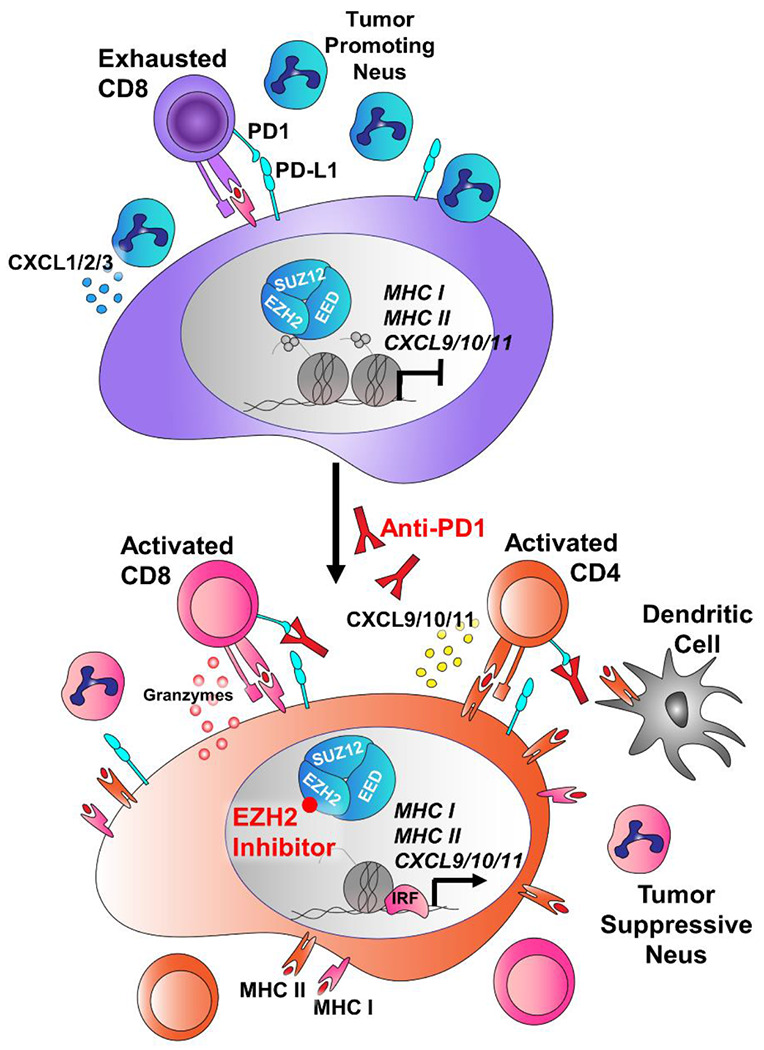
Two important factors that contribute to resistance to immune checkpoint inhibitors (ICIs) are an immune-suppressive microenvironment and limited antigen presentation by tumor cells. In this study, we examine if inhibition of the methyltransferase EZH2 can increase ICI response in lung squamous cell carcinomas (LSCCs). Our in vitro experiments using 2D human cancer cell lines as well as 3D murine and patient derived organoids treated with two inhibitors of the EZH2 plus interferon-γ (IFNγ) showed that EZH2 inhibition leads to expression of both major histocompatibility complex class I and II (MHCI/II) expression at both the mRNA and protein levels. ChIP-sequencing confirmed loss of EZH2-mediated histone marks and gain of activating histone marks at key loci. Further, we demonstrate strong tumor control in models of both autochthonous and syngeneic LSCC treated with anti-PD1 immunotherapy with EZH2 inhibition. Single-cell RNA sequencing and immune cell profiling demonstrated phenotypic changes towards more tumor suppressive phenotypes in EZH2 inhibitor treated tumors. These results indicate that this therapeutic modality could increase ICI responses in patients undergoing treatment for LSCC.

Keywords: EZH2; MHC; epigenetics; immunotherapy; neutrophils.


Figures

Figure 1:
Figure 1:. EZH2 inhibition allows up-regulation of MHC Class I and Class II in 2D human LSCC cell lines
A) Schematic for proposed mechanism: Inhibition of EZH2 methyltransferase activity by the drugs GSK126 or EPZ6438 will lead to de-repression of antigen presentation genes that can then be more effectively activated by interferon gamma. B) RT-qPCR in the indicated four human lung cancer cell lines treated for 7 days with vehicle or EZH2 inhibition with IFNγ added on day 5 for the genes B2M, HLA-A, CIITA and HLA-DRA, mean +/− SEM is graphed, n = 4 individual cultures, *indicates p<0.04, **p<0.008 ***p<0.0009, ****p<0.0001 by one-way ANOVA with pairwise comparisons and Holm-šídák’s post hoc test. C) Flow cytometry analysis of indicated four human lung cancer cell lines treated for 7 days with vehicle or EZH2 inhibition with IFNγ added on day 5 for the cell surface proteins HLA-A,B,C and HLA-DR, mean +/− SEM is graphed, n = 4 individual cultures, * indicates p<0.04, ** p<0.006, ***p<0.0009, ****p<0.0001 by one-way ANOVA with pairwise comparisons and Holm-šídák’s post hoc test. Representative histograms from HCC15 cell lines are shown, G=GSK126, E=EPZ6438, I=IFNγ, I+G= IFNγ+GSK126 and I+E= IFNγ+EPZ6438. D) Western blotting of A549 and HCC15 cell lines treated for 7 days with vehicle or EZH2 inhibition with IFN³ added on day 5 for the proteins B2M, HLA-DR,DQ,DP, EZH2, H3K27me3 and total histone H3. Data are representative of two individual cultures. See also Supplementary Figure 1.
Figure 2:
Figure 2:. EZH2 inhibition allows up-regulation of MHC Class I and Class II in human LSCC patient-derived tumoroids
A) Hematoxylin and eosin staining of primary squamous cell carcinoma tissue, xenograft tissue from primary patient tissue, and tumoroids generated from xenografts, scale bars = 100μm. B) RT-qPCR in two unique patient-derived tumoroid cultures treated for 11 days and IFNγ added on day 9 for the genes HLA-A, B2M, CIITA, and HLA-DRA, mean +/− SEM is graphed, n = 4, * indicates p<0.03, **p<0.005, ***p<0.0008, ****p<0.0001 by one-way ANOVA with multiple comparisons and Holm-šídák’s post hoc test. C) Flow cytometry analysis of both patient derived tumoroids treated for 11 days with IFNγ added in on day 9 for cell surface proteins HLA-A,B,C and HLA-DR, mean +/− SEM is graphed, n=4 biological replicates, * indicates p = 0.043, ** p<0.004, ***p<0.0009, ****p<0.0001 by one-way ANOVA with multiple comparisons and Holm-šídák’s post hoc test. Representative histograms for patient 1 are shown, G=GSK126, E=EPZ6438, I=IFNγ, I+G=IFNγ+GSK126 and I+E=IFNγ+EPZ6438. See also Supplementary Figure 2.
Figure 3:
Figure 3:. Murine LSCC organoids share de-repression of MHC and pro-T cell cytokines with human models
A) Schematic: Generation of murine tumoroids in air-liquid interface from tumor induced in Lkb1/Pten mice by adenoCre administration, showing H&E stain of tumoroids, scale bar = 100μm, and brightfield microscopy, scale bar = 200μm. B) Flow cytometry analysis of two separate murine tumoroid models treated for 11 days with IFNγ added on day 9 stained for cell surface expression of NGFR, PD-L1, H2Kd,Dd, and I-A/I-E, n = 5 individual experiments except mouse 2 I-A/I-E and PD-L1, n=4 individual experiments, * indicated p<0.031, **p<0.006, ***p=0.0002, ****p<0.0001 by one-way ANOVA with multiples comparisons and Holm-šídák’s post hoc test C) Heat maps of Log2-fold change in expression level from patient derived and murine tumoroids treated for 11 days and IFNγ added in on day 9, G=GSK126, E=EPZ6438, I=IFNγ, I+G= IFNγ+GSK126 and I+E= IFNγ+EPZ6438. For each map, the first columns are sample 1, the second columns are sample 2. Expression relative to vehicle control and relative to IFNγ only are depicted. See also Supplementary Figure 3
Figure 4:
Figure 4:. ChIP-sequencing of human patient-derived organoids confirms direct regulation of MHC and pro-T cell cytokines by EZH2
A) Peaks called at FDR 1E-7 for ChIP-seq using the chromatin marks H3K27me3, H3K27ac, and H3K4me3 in patient-derived tumoroids from the indicated treatment groups. B-D) Wiggle plots for H3K27me3, H3K27ac, and H3K4me3 histone mark enrichments, and matched RNAseq tracks in patient-derived tumoroids from the indicated treatment groups for the genes: B) HLA-DRA C) CXCL9/10/11 D) ALOX15 E) IL1B F) H3K27me3 peaks were called for each treatment group and GREAT was used to identify associated genes, which were then depicted by Venn diagram. G) H3K27me3 peaks that were gained or increased more than 2-fold with IFNγ treatment, and lost with EPZ6438 treatment were linked to associated genes by GREAT. The Venn diagram shows the overlap of these genes with those significantly up-regulated in combination treated vs IFNγ treated tumoroids. See also Supplementary Figure 4.
Figure 5:
Figure 5:. EZH2 inhibition combined with immunotherapy is extremely effective in mouse models of LSCC
A) Representative MRI scans of autochthonous mice from each treatment arm at baseline and after treatment. B) Waterfall plot showing change in tumor volume for each mouse on all treatment arms, **** indicates p<0.0001, *** indicates p<0.001, ** indicates p<0.01, * indicates p<0.05 by one-way ANOVA with multiple comparisons and Holm-šídák’s post hoc test on log2-transformed values. C) H&E and HALO nuclear phenotyper images showing the cells within an autochthonous Lkb1/Pten tumor and a syngeneic graft seeded from Lkb1/Pten tumoroids. D) Percentage tumor growth from the syngeneic mouse model during 14 days of indicated treatments. *** indicates p=0.0004, **** p<0.0001 by one-way ANOVA with multiple comparisons and Holm-šídák’s post-hoc test, * indicates p=0.042 by two-tailed t test on log2-transformed values, Mice/tumors n are placebo=4/8, EPZ6438=5/8, anti-PD1=6/8, combo=5/9, mean +/− s.e.m. is plotted. E) Flow cytometry analysis of dissociated tumors from the syngeneic grafts from the indicated treatment arms at day 14. Percentage of EpCAM+ cells expressing IA/IE or PD-L1 are graphed, mean +/− s.e.m. is plotted, placebo n=7, EZH2 inhibitor n=7, anti-PD1 n=8, combo n=7 with 2 experimental replicates each, * indicates p=0.035, *** p=0.0008 by one-way ANOVA with multiple comparisons and Holm-šídák’s post-hoc test. F) From the same tumor grafts, MFI for HLA-A in the EpCAM+ cells is graphed, mean +/− s.e.m. is plotted, n=7, EZH2 inhibitor n=7, anti-PD1 n=8, combo n=7 with 2 experimental replicates each, ** indicates p=0.0015 by one-way ANOVA with multiple comparisons and Holm-šídák’s post-hoc test. G) From tumor grafts, PD1+/CD3+/CD4+ cells and PD1+/CD3+/CD8+ were gated and percentage of cells bound to Rat-IgG2A antibody are graphed, mean +/− s.e.m. is plotted, n=6, EZH2 inhibitor n=6, anti-PD1 n=7, combo n=7, ** indicates p<0.006, *** p=0.0001, **** p<0.0001 by one-way ANOVA with multiple comparisons and Holm-šídák’s post-hoc test. H) From the grafts, percentage of CD3+/SSClow cells within the CD45+ fraction and percentage of CD8+ cells withing the CD3+ fraction were graphed, please see Supp Figure 5C for representative gates, n=8, EZH2 inhibitor n=8, anti-PD1 n=9, combo n=7 with 2 experimental replicates each, * indicates p=0.0197, **** p<0.0001 by one-way ANOVA with multiple comparisons and Holm-šídák’s post-hoc test. See also Supplementary Figure 5.
Figure 6:
Figure 6:. Single Cell RNA sequencing highlights neutrophil heterogeneity shifts in response to EZH2 inhibition combined with immunotherapy
A) Annotated Uniform Manifold Approximation and Projection (UMAP) plot showing the 16 different populations within lung tumors of the Lkb1/Pten model of LSCC after treatment with placebo, GSK126, anti-PD1, or combined GSK126 with anti-PD1. B) Percentage of cells per treatment group graphed for all populations, # indicates adjusted p<0.0012 by proportion z-test. C) Gene Set Enrichment Analysis depicting gene sets that are enriched or depleted in Tumor, Macrophage/Dendritic Cells, or Neutrophils in mice treated with EZH2 inhibitor and anti-PD1 contrasted with either treatment alone. Normalized Enrichment Scores are plotted and bubble sizes estimate false discovery rate. See also Supp. Table 2. D) Heat maps showing differentially expressed genes among tumor, macrophages and dendritic cells, and neutrophils between GSK126, anti-PD1, and combination treated mice compared to placebo on the log2 fold change. E) UMAP of 5 neutrophil populations showing selected genes that are highly expressed in each cluster. See also Supplementary Figure 6.
Figure 7:
Figure 7:. Schematic of tumor cell-intrinsic and microenvironmental consequences of EZH2 inhibition that boost immunotherapy response in LSCC
In LSCC, tumors can evade the immune system through expression of PD-L1, inhibiting T cell activation. In addition, these tumors secrete high levels of CXCL1/2/3 (mouse orthologs Cxcl3/5/7) that attract T-cell suppressive neutrophils, and can express high levels of Arginase, that further drive T cell suppression. In response to EZH2 inhibition, the tumors up-regulation MHC Class I and Class II antigen presentation machinery, and switch from expression of CXCL1/2/3 to expression of the T cell promoting cytokines CXCL9/10/11 and the inflammatory resolution molecule ALOX15. IL1B and Arg1 are downregulated, and the neutrophils surrounding the tumor take on more tumor-repressive phenotypes. When anti-PD1 antibody is added, the net result is tumor regression through immune targeting of tumor cells.

References

    1. Thai A. A., Solomon B. J., Sequist L. V., Gainor J. F. & Heist R. S. Lung cancer. The Lancet 398, 535–554, doi:10.1016/S0140-6736(21)00312-3 (2021). - DOI - PubMed
    1. Socinski M. A. et al. Clinicopathologic Features of Advanced Squamous NSCLC. J Thorac Oncol 11, 1411–1422, doi:10.1016/j.jtho.2016.05.024 (2016). - DOI - PubMed
    1. Luo W. et al. Immunotherapy in non-small cell lung cancer: rationale, recent advances and future perspectives. Precision Clinical Medicine 4, 258–270, doi:10.1093/pcmedi/pbab027 (2021). - DOI - PMC - PubMed
    1. Borghaei H., Paz-Ares L. & Horn L. Nivolumab versus docetaxel in advanced nonsquamous non-small-cell lung cancer. N Engl J Med 373, doi:10.1056/NEJMoa1507643 (2015). - DOI - PMC - PubMed
    1. Bracken A. P. & Helin K. Polycomb group proteins: navigators of lineage pathways led astray in cancer. Nature Reviews Cancer 9, 773, doi:10.1038/nrc2736 (2009). - DOI - PubMed

Publication types