[Preprint]. 2024 Aug 31:2023.06.09.544428.
doi: 10.1101/2023.06.09.544428.

A Transient High-dimensional Geometry Affords Stable Conjunctive Subspaces for Efficient Action Selection

Affiliations

A Transient High-dimensional Geometry Affords Stable Conjunctive Subspaces for Efficient Action Selection

Atsushi Kikumoto et al. bioRxiv. .

Update in

Abstract

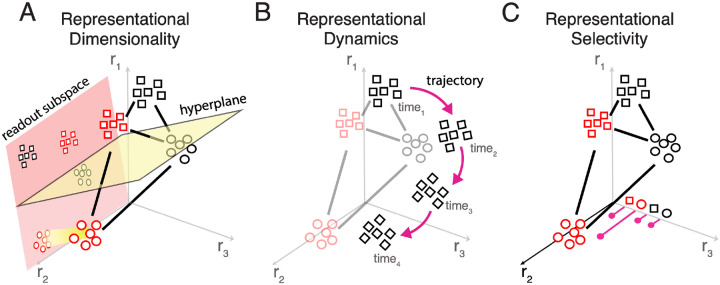
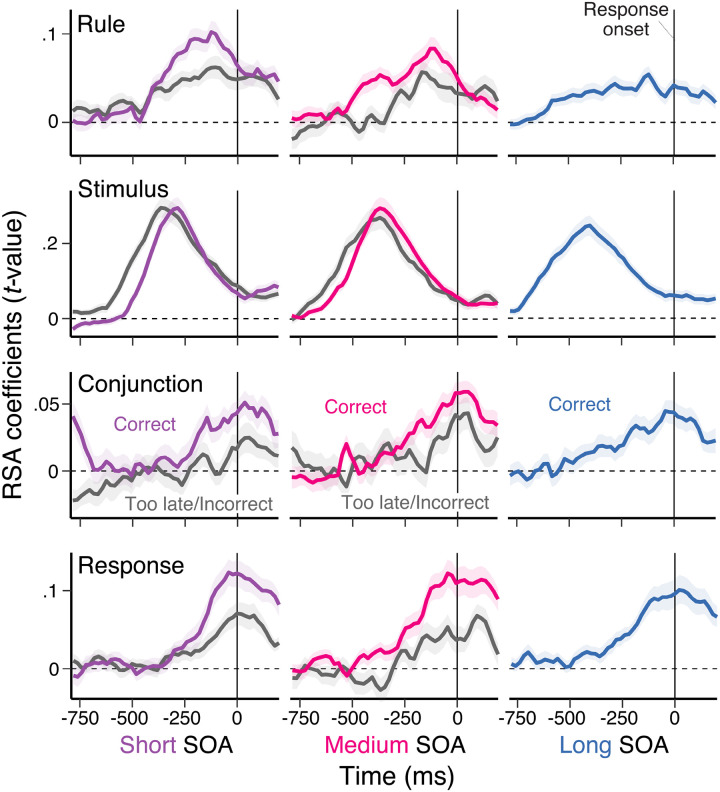
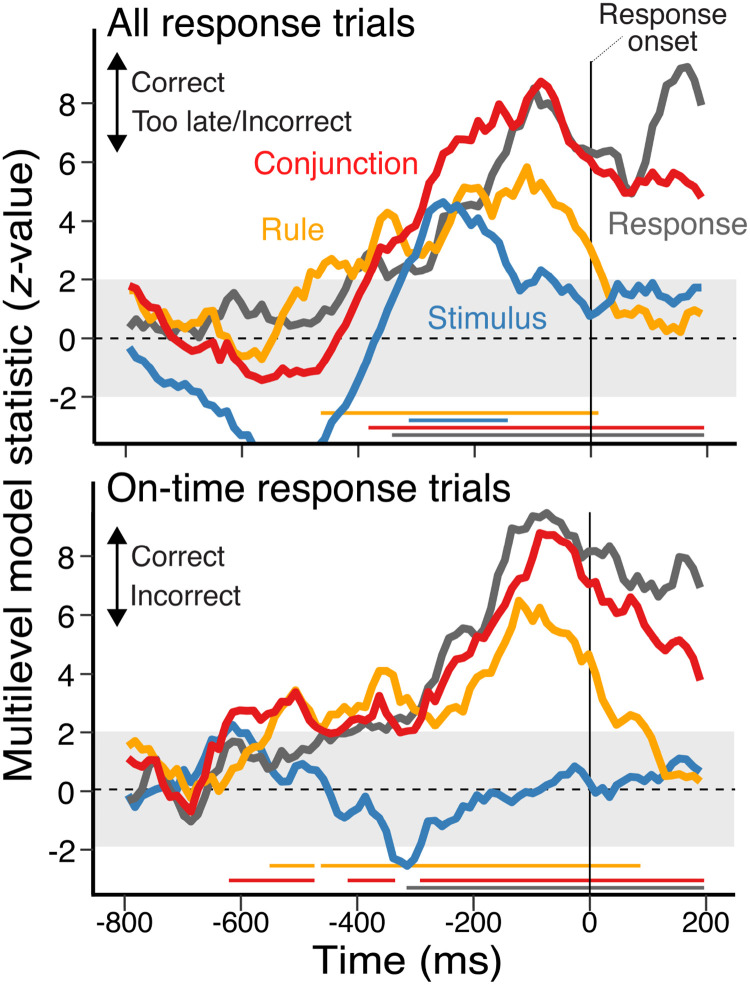
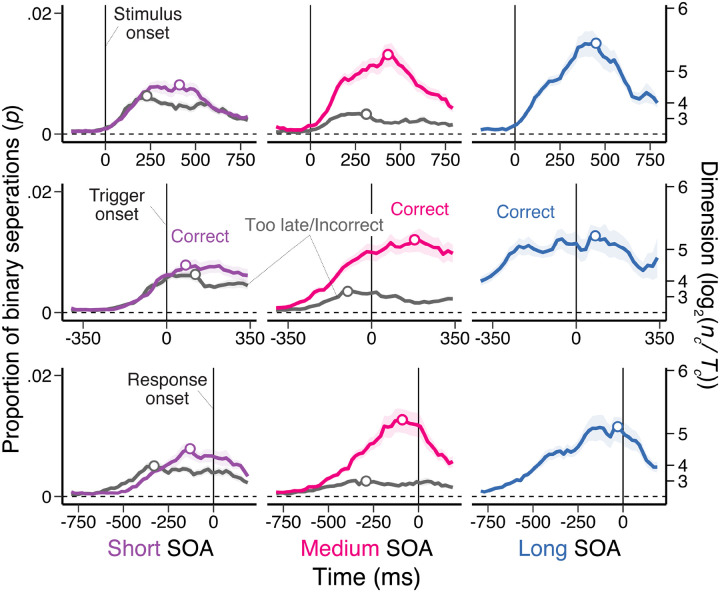
Flexible action selection requires cognitive control mechanisms capable of mapping the same inputs to different output actions depending on the context. From a neural state-space perspective, this requires a control representation that separates similar input neural states by context. Additionally, for action selection to be robust and time-invariant, information must be stable in time, enabling efficient readout. Here, using EEG decoding methods, we investigate how the geometry and dynamics of control representations constrain flexible action selection in the human brain. Participants performed a context-dependent action selection task. A forced response procedure probed action selection different states in neural trajectories. The result shows that before successful responses, there is a transient expansion of representational dimensionality that separated conjunctive subspaces. Further, the dynamics stabilizes in the same time window, with entry into this stable, high-dimensional state predictive of individual trial performance. These results establish the neural geometry and dynamics the human brain needs for flexible control over behavior.


Conflict of interest statement

Competing Interests The authors declare no competing interests.

Figures

Figure 1.
Figure 1.. Representational dimensionality, dynamics and selectivity.
Schematic illustration of representational dimensionality, dynamics, and selectivity of the conjunctive control representations. Each panel plots the response of a toy population of three units to input conditions varying in shape (square or circle) and color (red or black). Axes represent the firing rates of single units, collectively defining a neural activity space for the population. Each point within this activity space represents the population response for a given input (identified by colored shapes). Distance between points reflects how distinct responses are, and the jittered cloud of points reflect the trial-by-trial variability in responses to a given input. (A) The geometric format of the population neural responses is defined by response patterns arranged in 3 dimensions. A linear readout is implemented by a decision hyperplane (yellow) that divides the readout subspace into different classes (e.g., different shapes of inputs). The high-dimensional representation (traced by solid black lines), where no cluster of responses are aligned to each other, allows a wider variety of input conditions to be linearly separable. In addition, responses projected to a readout subspace defined by a linear hyperplane tend to dissociate input conditions (e.g., red-square and black-square) that are on the same side of the decision boundary, increasing the separability of neural responses overall. (B) Due to the time-varying nature of neural activity, the neural state space is changing and reshaping its underlying geometry over time. The dynamic neural trajectories potentially require changes in the weights for optimal linear hyperplanes for downstream readouts. (C) Units within the population show a heterogeneous turning profile or nonlinear mixed selectivity. To illustrate, the tuning profile for one unit (r2) is plotted along the corresponding axis. The bars plot activity of r2 to each of the four conditions of input and depict a non-linear mixed selective pattern. Note that similar geometric properties are expected at the level of a single unit (i.e., mixed-selectivity) or population of neurons (i.e. integrative subspaces). The event-file representations could be conceptualized as one form of mixed selectivity where a unit or groups of units are exclusively tuned to a specific combination of task critical factors more than other pairs.
Figure 2.
Figure 2.. Task design and the procedure of decoding analyses.
(A) Sequence of trial events in the rule-selection task with the response deadline. In the variable or sampled SOA phase, an audio trigger signal indicated the start of a response deadline time window. (B) Spatial translation of different rules (rows) mapping different stimuli (columns) to responses (arrows), yielding 12 independent conjunctions. (C) Schematic of the time-resolved representational similarity analysis. For each sample time (t), a scalp-distributed pattern of EEG was used to decode the specific rule/stimulus/response configuration of a required action. The decoder produced sets of classification probabilities for each of the possible action constellations. The profile of classification probabilities reflects the similarity structure of the underlying representations, where action constellations with shared features are more likely to be confused. For each trial and timepoint, the classification probabilities were regressed onto model vectors as predictors that reflect the different, possible representations. In each model matrix, the shading of squares indicates the theoretically predicted classification probabilities (darker shading means higher probabilities) in all possible pairs of constellations. The coefficients associated with each predictor (i.e., t- values) reflect the unique variance explained by each of the constituent features and their conjunction. (D) Schematic of the time-resolved binary classification method used to estimate the representational dimensionality (Rigotti et al., 2013). For each time point (t), a pattern of EEG associated with unique action constellations or input conditions (c1–12) take a position in the multidimensional neural space spanning in r1-e dimensions. By assigning new binary class labels (e.g., A or B) to the input conditions, we can generate arbitrary binary groupings given the task conditions. Because the higher dimensional geometry of neural responses generally affords more arbitrary linear separations by being more expressive, the count of successfully implementable binary classifications of newly defined groupings scales with the representational dimensionality. To adapt the method to EEG by lowering the cutoff threshold for classification, we used an exclusive cutoff method. In this method, classifications must exceed the cutoff threshold in all the different input conditions assigned to each trial, as opposed to the averaged performance across c1–12, to be marked as success.
Figure 3.
Figure 3.. Psychophysical curve of on-time response accuracies via SOA manipulation.
(A) Empirically observed changes in the probability of correct and on-time responses as a function of the subjects-specific SOA intervals. Each line plots an individual subject. (B) Predictions by the model for each subject of an exponential function approaching to the limit using the subjects-specific estimates of parameters. (C) Distributions of the parameters of the model with an exponential function to the limit: β is the rate parameter, which indexes the speed at which accuracy grows to asymptote; δ is the intercept reflecting the discrete point when accuracy departs from 0, and λ is the asymptotic accuracy level reflecting the overall probability of successful responses. (D) Empirically observed probability of correct responses during sampled SOA phase where we simultaneously measured EEG. The subjects-specific SOA intervals estimated from earlier phases were used to force expected number of errors for short SOA (p = .5), medium SOA (p = .75), and long SOA (p = .9) condition respectively. (C-D) The box plots show 25th, 50th, and 75th percentile as a box and minima/maxima of whiskers correspond to smallest/largest values within 1.5 times interquartile range below/above the 25th/75th percentile.
Figure 4.
Figure 4.. Response-aligned time-course of decoding of task representations.
Average, single-trial RSA coefficients (t-values) associated with each of the basis set task features (rule, stimulus, and response) and their conjunction that are aligned to the onset of trial-to-trial responses. The left, middle and right column correspond to the short, medium and long SOA conditions respectively. The two lines in each panel show the average scores in trials comparing correct vs. too late or incorrect responses. The patterns were aligned to the onset of responses in each trial. Shaded regions specify the 95% within-subject standard errors.
Figure 5.
Figure 5.. Time-course of impact of decoding of task representations on successful response selection.
The time-course of the effect of decoded task representation strength on response selection performance. The z-values were obtained from multilevel, logistic regression models predicting the variability in trial-to-trial accurate and on-time responses from the strength of task representations at each moment. The signals are aligned to the onset of trial-to-trial responses. The top panel shows the result using all responses except complete omissions and premature responses, whereas the bottom panel shows the result with responses made within the deadline. Positive z-values indicate more successful responses as the strength of decoded representations increases. The colored straight lines at the bottom denote the significant time points using a nonparametric permutation test (cluster-forming threshold, p < .01, cluster-significance threshold, p < .01, two-tailed).
Figure 6.
Figure 6.. Time-course of task representational dimensionality.
Average, dimension score during action selection. The dimensionality is estimated as the proportion of implementable binary separation, nc/Tc, out of all possible arbitrary binary pairs. The left, middle and right column corresponds to the short, medium, and long SOA conditions respectively. The top, middle and bottom row correspond to the results using signals aligned to the onset of stimulus, trigger or response in each trial. The two lines in each panel show the average scores in trials with correct vs. too late or incorrect responses. Shaded regions specify within-subject standard errors.
Figure 7.
Figure 7.. Relationship between the dimensionality and selectivity of task representations.
Changes in the representational dimensionality as a function of RSA scores of each of the basis set task features (rule, stimulus, and response) and their conjunction. The dimension scores (nc/Tc) are calculated separately in decile bins of RSA scores of each feature within subjects, which correspond to individual points in each panel. The t-value is the statistic of a linear regression model fitted to the results.
Figure 8.
Figure 8.. Representational dynamics in the subspace of conjunctive control representations.
Temporal generalization of linear hyperplanes that separate conjunctions of task basis features summarized as a decoding matrix. The X-axis denotes time points where signals were sampled to train decoders then submitted to single-trial RSA. The Y-axis denotes time points where the test sets were derived. Thus, the diagonal components of the matrix correspond to trajectories of time-resolved decoding analyses, as shown in Figure. 4. The off-diagonal components show the results of temporal generalization analysis. The regions surrounded by a white contour denote the significant clusters using a nonparametric permutation test (cluster-forming threshold, p < .01, cluster-significance threshold, p < .01, two-tailed). The top panel shows changes in the representational dimensionality relative to the onset of responses (Figure 7 bottom row) merging short and medium SOA conditions. The middle panel plots temporal generalization for correct responses, and the bottom panel plots temporal generalization for incorrect or too late responses. Shaded regions of the top panel specify within-subject standard errors.

Similar articles

References

    1. Ahlheim C., & Love B. C. (2018). Estimating the functional dimensionality of neural representations. NeuroImage, 179, 51–62. - PMC - PubMed
    1. Asaad W. F., Rainer G., & Miller E. K. (2000). Task-specific neural activity in the primate prefrontal cortex. Journal of Neurophysiology, 84(1), 451–459. - PubMed
    1. Badre D., Bhandari A., Keglovits H., & Kikumoto A. (2021). The dimensionality of neural representations for control. Current Opinion in Behavioral Sciences, 38, 20–28. - PMC - PubMed
    1. Badre D., Frank M. J., & Moore C. I. (2015). Interactionist Neuroscience. Neuron, 88(5), 855–860. - PubMed
    1. Bagur S., Bourg J., Kempf A., Tarpin T., Bergaoui K., Guo Y., Ceballo S., Schwenkgrub J., Puel J. L., Bourien J., & Bathellier B. (2022). Emergence of a time-independent population code in auditory cortex enables sound categorization and discrimination learning. In bioRxiv (p. 2022.12.14.520391). 10.1101/2022.12.14.520391 - DOI

Publication types