[Preprint]. 2023 Jun 8:2023.06.06.543899.
doi: 10.1101/2023.06.06.543899.

A ligation-independent sequencing method reveals tRNA-derived RNAs with blocked 3' termini

Affiliations

A ligation-independent sequencing method reveals tRNA-derived RNAs with blocked 3' termini

Alessandro Scacchetti et al. bioRxiv. .

Update in

Abstract

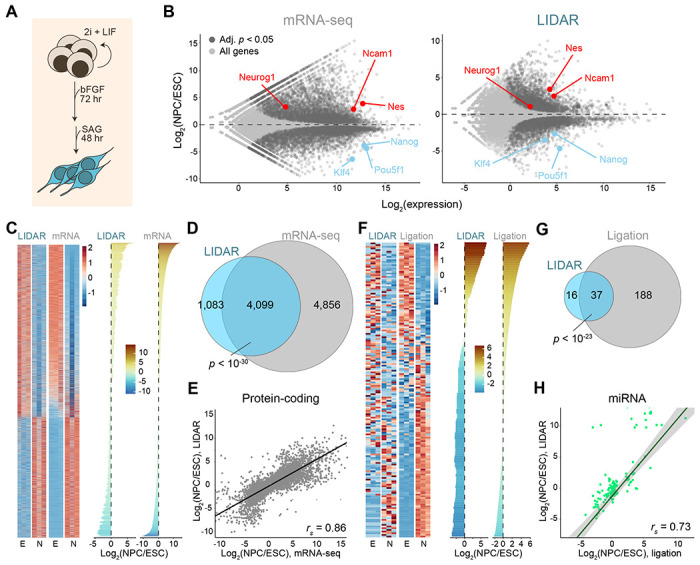
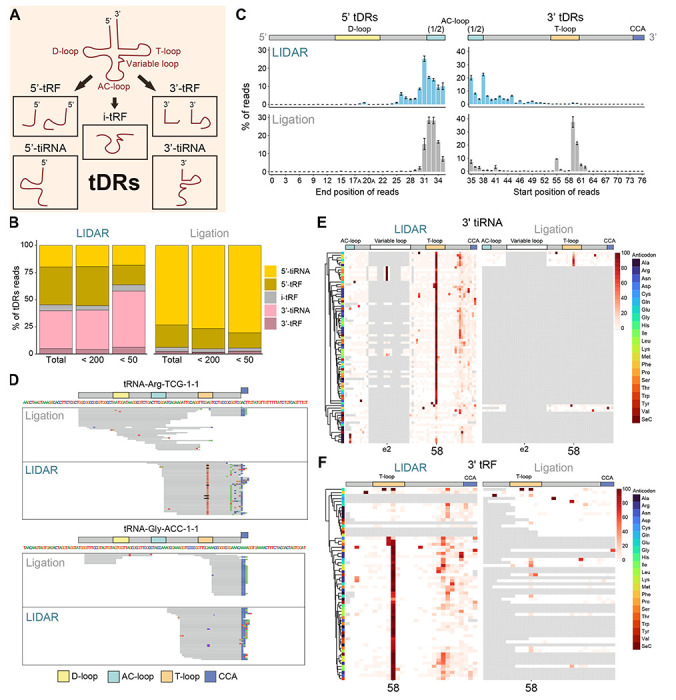
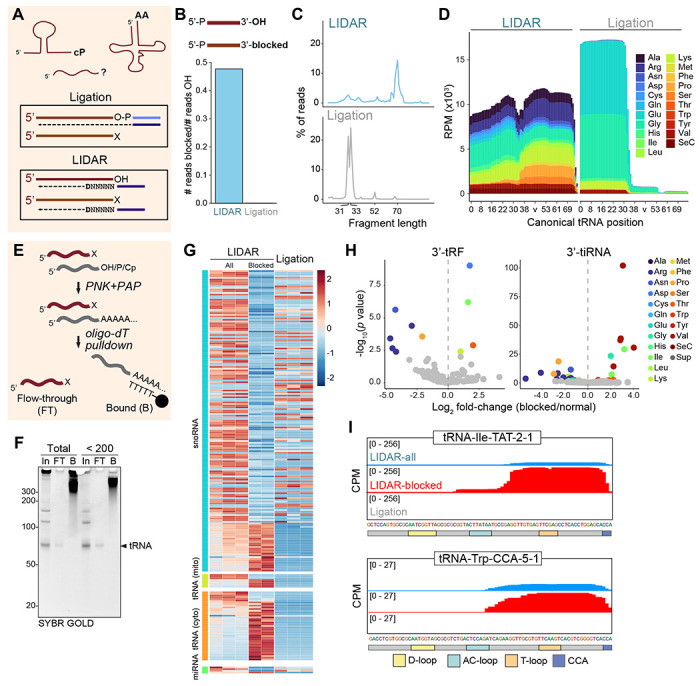
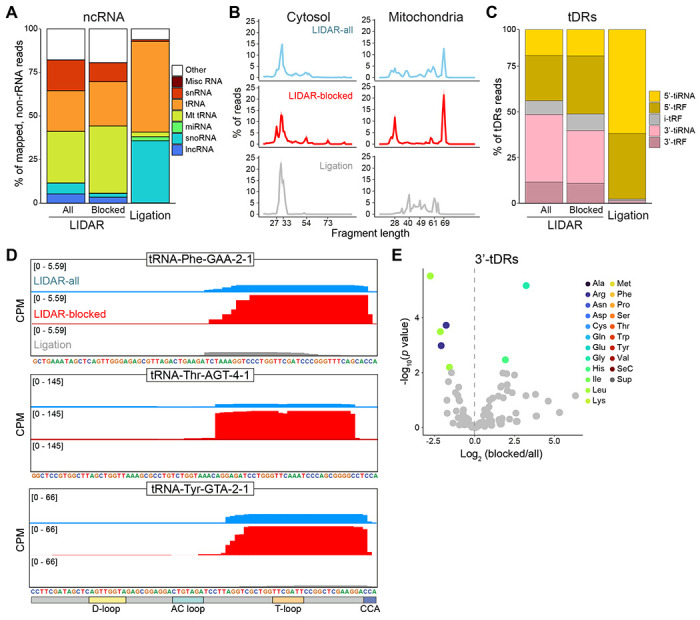
Despite the numerous sequencing methods available, the vast diversity in size and chemical modifications of RNA molecules makes the capture of the full spectrum of cellular RNAs a difficult task. By combining quasi-random hexamer priming with a custom template switching strategy, we developed a method to construct sequencing libraries from RNA molecules of any length and with any type of 3' terminal modification, allowing the sequencing and analysis of virtually all RNA species. Ligation-independent detection of all types of RNA (LIDAR) is a simple, effective tool to comprehensively characterize changes in small non-coding RNAs and mRNAs simultaneously, with performance comparable to separate dedicated methods. With LIDAR, we comprehensively characterized the coding and non-coding transcriptome of mouse embryonic stem cells, neural progenitor cells, and sperm. LIDAR detected a much larger variety of tRNA-derived RNAs (tDRs) compared to traditional ligation-dependent sequencing methods, and uncovered the presence of tDRs with blocked 3' ends that had previously escaped detection. Our findings highlight the potential of LIDAR to systematically detect all RNAs in a sample and uncover new RNA species with potential regulatory functions.


Conflict of interest statement

Declaration of interests J.E.W. serves as a consultant for Laronde.

Figures

Figure 1.
Figure 1.. A modified Smart-seq3 protocol captures small RNAs
(A) Schematic of LIDAR protocol. The four key modifications to the Smart-seq3 protocol are indicated with numbers highlighted in yellow. (B) Agarose gel electrophoresis of pre-amplification (step III) libraries constructed from total ESC RNA using the Smart-seq3 or LIDAR TSO, and random (R) or quasi-random (QR) RT primers. The black line on the side indicates productive libraries; the white arrowheads indicate adapter dimers. (C) Agarose gel electrophoresis of pre-amplified (step III), LIDAR libraries constructed from the indicated amounts of a synthetic 20 nts RNA. The black arrowhead indicates libraries with the 20 bp insert; the white arrowheads indicate adapter dimers. (D) Read coverage of a 20 nts RNA molecule cloned with LIDAR (blue) or with a conventional ligation-dependent protocol (gray). Read density is expressed as % of maximum coverage in each method. (E) Number of reads per million (RPM) sequenced mapping to 20 nts or 50 nts synthetic RNAs cloned by LIDAR or ligation. (F) Average (n = 3) biotype distribution of ncRNAs, expressed as % of mapped reads, in LIDAR and ligation-based libraries from total ESC RNA. (G) Genome browser snapshot of average LIDAR and ligation-based read coverage (expressed as counts per million, CPM) on two example miRNAs. (H) Average size distribution of reads mapping to miRNAs in LIDAR libraries starting from total ESC RNA (top) or ligation-based libraries (bottom). Data from 3 biological replicates.
Figure 2.
Figure 2.. LIDAR detects differential expression in small and large RNAs
(A) Schematic of ESC to NPC differentiation protocol. (B) MA plot of gene expression changes between NPC and ESC measured by mRNA-seq (left panel) or LIDAR (right panel) from total RNA. Dark grey, genes with significant changes (adjusted p value < 0.05, n = 3). Red, NPC markers. Blue, ESC markers. (C) Heatmap of z score-converted expression levels, calculated as transcripts per million (TPM), of differentially expressed protein-coding genes between NPC (N) and ESC (E), as measured by LIDAr or mRNA-seq. Individual replicates are shown. Rolling mean of log2 fold-change (n = 3) is shown on the right. (D) Venn diagram for differentially expressed protein-coding genes detected in LIDAR (blue) or mRNA-seq (grey). The p value for the overlap is from a hypergeometric test. (E) Correlation of average log2 fold changes (NPC vs. ESC, n = 3) of differentially expressed protein-coding genes detected by LIDAR and mRNA-seq. rs, Spearman’s rank correlation coefficient. (F) Heatmap as in (C) for miRNAs comparing LIDAR or ligation-based libraries starting from total RNA. (G) Venn diagram for differentially expressed miRNAs detected in LIDAR (blue) or ligation-based libraries (grey). The p value for the overlap is from a hypergeometric test. (H) Correlation plot as in (E) for differentially expressed miRNAs detected by LIDAR vs. ligation-based libraries.
Figure 3.
Figure 3.. LIDAR uncovers 3’ tDRs not efficiently captured by ligation
(A) Scheme of possible tRNA-derived RNAs (tDRs). (B) Average (n = 3) tDRs distribution, expressed as % of reads mapping to any tDR, in LIDAR and ligation-based libraries from total, < 200 nts, and < 50 nts ESC RNA. (C) Histogram of average (n = 3, ⊠ SEM) read end (left) or beginning (right) position frequency, expressed as % of all reads mapping to the corresponding tRNA fragment type, for 5’ tDRs (tRF or tiRNA) (left) and 3’ tDRs (tRF or tiRNA) (right) in LIDAR (blue) or ligation-based (grey) libraries starting from < 200 nt ESC RNA. (D) Example genome browser snapshots showing single collapsed mapped reads mapping to two different tRNAs in LIDAR or ligation-based libraries starting from < 200 nt ESC RNA. Position of various loops, as shown in Fig. 3A, are indicated on top of each panel. The non-templated 3’-terminal CCA sequence is depicted as a blue box. (E) Heatmap of average misincorporation rate (expressed as % detected) for every canonical position (column) in every 3’-tiRNA iso-acceptor (rows) in LIDAR (left) or ligation-based (right) libraries starting from < 200nt ESC RNA (n = 3). In gray, positions with coverage = 0. Position of loops, as shown in Fig. 3A, are indicated on top. (F) Same as (E) but for 3’-tRF.
Figure 4.
Figure 4.. LIDAR detects full-length tRNAs and tDRs with blocked 3’ ends
(A) Top: schematic of RNAs with possible blocked 3’ ends (Cp: 2’-3’ cyclic phosphate; AA: amino acid; ?: unknown). Bottom: only RNAs (red) with free 3’ ends can be efficiently cloned by both ligation-based protocols and LIDAR. RNA with blocked 3’ ends can only be captured by LIDAR. (B) Barplot of reads per million (RPM) ratio of sequences mapping to 3’ biotinylated (blocked) vs. 3’OH synthetic 20 nts RNA in LIDAR and ligation libraries. (C) Average (n = 3) size distribution of all reads mapping to tRNAs, expressed as a % of all tRNA reads, in LIDAR (blue, top) or ligation-based (grey, bottom) libraries from ESC RNA < 200 nts. (D) Average coverage and representation of ESC tRNA anticodons (color-coded) in LIDAR (left) or ligation (right) libraries from ESC RNA < 200 nts. v, collapsed variable loop position. Data from 3 biological replicates. (E) Scheme for the enrichment of RNA with blocked 3’ ends. Input RNAs with 3’OH, 3’P, and 2’-3’cP (cP) were end-repaired with T4 PNK and polyadenylated using E. coli PAP The artificially polyadenylated RNAs were removed via oligo-dT beads (B). RNA with blocked 3’ end were not polyadenylated and remained unbound in the flow-through (FT). (F) Urea PAGE of total and < 200 nts ESC blocked RNA (FT) isolated using the method represented in Fig. 4E. 100% Input (In) and polyA bound (B) fractions loaded as controls. (G) Heatmap of z-score normalized TPM expression of differentially expressed (adj. p < 0.05) snoRNA miRNA, and tRNA between LIDAR libraries from all and blocked ESC total RNA. Z-score normalized expression in ligation-based libraries from unfractionated (all) ESC RNA is also shown. (H) Volcano plot showing log2 fold-change in frequency, calculated over all reads mapping to tDRs of 3’-tRF and 3’-tiRNA isoencoders between LiDAR libraries from all < 200 nt RNA (n = 3) vs blocked (n = 2) RNA from ESC. Comparisons with adjusted p value < 0.05 are colored according to their anticodon. (I) Read density of LIDAR (from all or blocked ESC RNA < 200 nts) and ligation-based libraries on two example tRNAs.
Figure 5.
Figure 5.. Sperm contains full-length tRNAs and 30–40 nts 3’ tDRs
(A) Average (n = 2) biotype distribution of ncRNAs, expressed as % of mapped reads, in LIDAR from sperm RNA before or after enriching for blocked RNA and in ligation-based libraries. (B) Average (n = 2) size distribution of reads mapping to cytosolic or mitochondrial tRNAs, expressed as % of reads of all tRNA reads. Libraries obtained with LIDAR from all or blocked sperm RNA are shown as well as ligation-based libraries. (C) Average (n = 2) tDR distribution, expressed as % of reads mapping to any tDR, in LIDAR from all sperm RNA, blocked RNA, or ligation-based libraries. (D) Read density of LIDAR (from all or blocked sperm RNA) or ligation-based libraries on three example tRNAs. (E) Volcano plot showing log2 fold-change for LIDAR libraries on blocked vs. all RNA from sperm of individual 3’ tDRs (tRFs and tiRNAs) from isoencoders. Fragments for which the comparison has an adjusted p value < 0.05 are colored according to their anticodon.

References

    1. Arezi B., and Hogrefe H. (2009). Novel mutations in Moloney Murine Leukemia Virus reverse transcriptase increase thermostability through tighter binding to template-primer. Nucleic Acids Res 37, 473–481. - PMC - PubMed
    1. Baran-Gale J., Kurtz C.L., Erdos M.R., Sison C., Young A., Fannin E.E., Chines P.S., and Sethupathy R (2015). Addressing Bias in Small RNA Library Preparation for Sequencing: A New Protocol Recovers MicroRNAs that Evade Capture by Current Methods. Front Genet 6, 352. - PMC - PubMed
    1. Behrens A., and Nedialkova D.D. (2022). Experimental and computational workflow for the analysis of tRNA pools from eukaryotic cells by mim-tRNAseq. STAR Protoc 3, 101579. - PMC - PubMed
    1. Behrens A., Rodschinka G., and Nedialkova D.D. (2021). High-resolution quantitative profiling of tRNA abundance and modification status in eukaryotes by mim-tRNAseq. Mol Cell 81, 1802–1815 e1807. - PMC - PubMed
    1. Boccaletto P., Machnicka M.A., Purta E., Piatkowski P., Baginski B., Wirecki T.K., de Crecy-Lagard V, Ross R., Limbach P.A., Kotter A., et al. (2018). MODOMICS: a database of RNA modification pathways. 2017 update. Nucleic Acids Res 46, D303–D307. - PMC - PubMed

Publication types