[Preprint]. 2023 Apr 15:2023.04.13.536772.
doi: 10.1101/2023.04.13.536772.

Transgenerational Epigenetic Inheritance of MHC Class I Gene Expression is Regulated by the CCAAT Promoter Element

Affiliations

Transgenerational Epigenetic Inheritance of MHC Class I Gene Expression is Regulated by the CCAAT Promoter Element

Jocelyn D Weissman et al. bioRxiv. .

Update in

Abstract

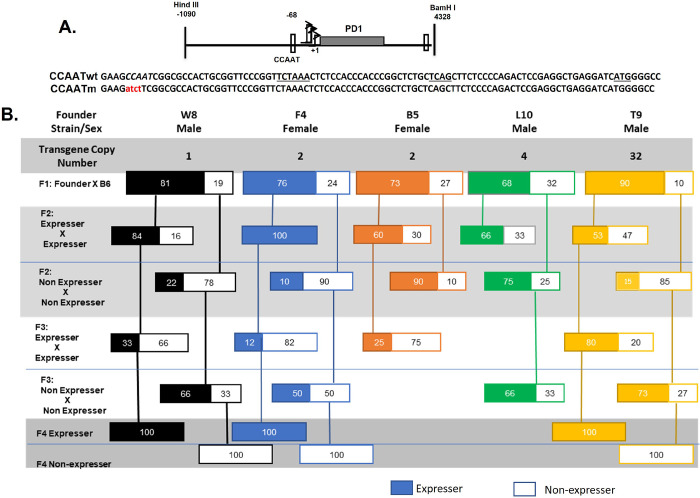
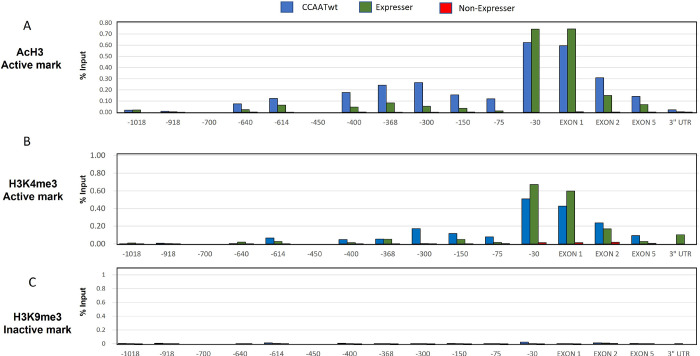
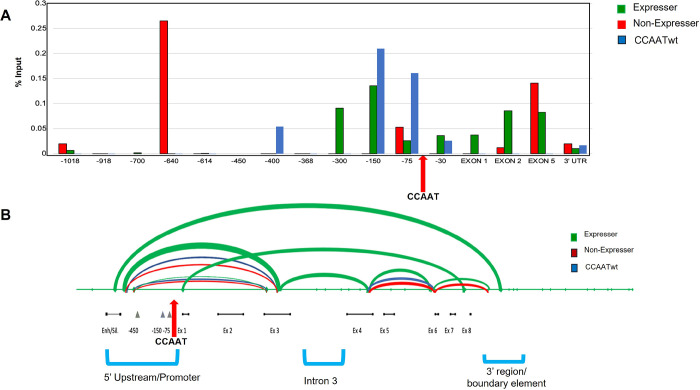
Transgenerational epigenetic inheritance is defined as the transmission of traits or gene expression patterns across multiple generations that do not derive from DNA alterations. The effect of multiple stress factors or metabolic changes resulting in such inheritance have been documented in plants, worms and flies and mammals. The molecular basis for epigenetic inheritance has been linked to histone and DNA modifications and non-coding RNA. In this study, we show that mutation of a promoter element, the CCAAT box, disrupts stable expression of an MHC Class I transgene, resulting in variegated expression among progeny for at least 4 generations in multiple independently derived transgenic lines. Histone modifications and RNA polII binding correlate with expression, whereas DNA methylation and nucleosome occupancy do not. Mutation of the CCAAT box abrogates NF-Y binding and results in changes to CTCF binding and DNA looping patterns across the gene that correlate with expression status from one generation to the next. These studies identify the CCAAT promoter element as a regulator of stable transgenerational epigenetic inheritance. Considering that the CCAAT box is present in 30% of eukaryotic promoters, this study could provide important insights into how fidelity of gene expression patterns is maintained through multiple generations.


Conflict of interest statement

CONFLICT OF INTEREST DISCLOSURE The authors have no conflicts of interest to disclose.

Figures

Fig. 1
Fig. 1. Mutation of the CCAAT box results in variable gene expression across generations
A. Both CCAATwt and CCAATm transgenes contain the same backbone DNA segment containing 1kb of 5’ flanking sequences, 3.3kb of MHC class I transgene, PD1, coding sequences (gray rectangle) and 1kb of 3’ sequences. The mutation introduced into the CCAAT sequence (italicized) is indicated; the CCAATwt and mutant CCAAT sequences within the proximal promoter are centered at −68 bp, relative to the major TSS at +1. Transcription of both CCAATwt and CCAAT mutant promoters initiate at the same sites, with a major site at +1. The positions of the TATAA-like element at −30 bp, the Inr at +1, and ATG translation start site are underlined. B. Variegated expression of MHC class I transgene, PD1, across multiple generations of transgenic mice with a mutated CCAAT core promoter element. The generational maps are representative of 5 different founder mice with the transgene copy number and sex of the founders indicated. Transgene-positive off-spring were analyzed by FACS for cell surface PD1 expression on PBL. Only transgene-positive mice that express (colored solid boxes) or do not express (outlined, white boxes) are shown.
Fig. 2
Fig. 2. CAATm transgenic mice differ in their MHC class I expression in multiple tissues
A. Representative FACS profiles of PBL of the three transgenic lines. PBL were stained with an anti-PD1 antibody (gray profile); secondary antibody alone served as the negative control (light gray profile). Data are representative of >3 independent experiments. B. Real-time qPCR was performed on total RNA extracted from tissues of CCAATwt and both CCAAT mutant transgenic lines. The levels of RNA were normalized to 18S RNA in each tissue. Data are average±SEM from 3 individuals of each line. RNA levels in the tissues were all normalized to the RNA level in spleen of CCAATwt mice which was set to 1. C. Frozen sections of spleen, kidney and brain from CCAATwt, CCAATm expresser and CCAATm non-expresser transgenic mice were immunostained with anti-PD1 antibody and fluorescent goat anti-mouse Ig. Slides were counterstained with DAPI. Images are representative of two independent experiments.
Fig. 3
Fig. 3. NF-Y binds PD1 CCAAT box both in vitro and in vivo, and regulates MHC class I expression
A. Gel shifts using a radiolabeled PD1 CCAATwt or CCAATm DNA fragment (1011–1060 bp) with or without HeLa nuclear extracts, in the presence or absence of NF-Y antibodies or 1000-fold excess of unlabeled double-stranded CCAATwt or CCAATm oligonucleotide competitors as indicated. B. ChIP analysis of NF-YB binding to chromatin from spleens of CCAATwt, CAATm expresser and CAATm non-expresser transgenic strains. Results are expressed as % of total Input. Note: X axis demarcates location relative to the TSS and is not to scale. Data are representative of 2 independent experiments. Pol II ChIP served as positive control where binding was seen in CCAATwt as well as CCAATm expressers but not in CCAATm non-expressers C. Quantitation of fold-induction of PD1 gene expression on siRNA knockdown of NF-YA in mouse L cells stably transfected with PD1 (93B2 cell line;NF-YA2 and NF-YA3 were 2 siRNAs targeting NF-YA). The bars labeled PD1 show PD1 RNA levels in cells treated with NF-Y siRNA, expressed relative to the PD1 levels in non-targeting siRNA treated cells set to 1. The bars labeled NF-Y show knock-down of NF-Y RNA levels in NF-Y siRNA treated cells versus cells treated with non-targeting siRNA set to 1. For both PD1 and NF-Y RNA, 18S RNA was used as internal control.
Fig. 4
Fig. 4. Pol II differs in its association with the CCAATm expresser and non-expresser transgenes
ChIP analysis of Pol II binding to chromatin from spleens of CCAATwt, CAATm expresser and CAATm non-expresser transgenic strains. Results are expressed as % of total Input. Note: X axis demarcates location relative to the TSS and is not to scale. Location of CCAAT box is denoted by arrow. Data are representative of 3 independent experiments.
Fig. 5
Fig. 5. Histone marks of active genes occur only on CCAATwt and CCAATm expressers transgenes
ChIP analysis of AcH3(A), H3K4me3 (B) and H3K9me3 (C) on chromatin from spleens of CCAATwt, expresser, and non-expresser CCAATm transgenic strains. Results are presented as % of total Input. Note: X axis demarcates location relative to the TSS and is not to scale. Data are representative of 3 independent experiments
Fig. 6
Fig. 6. Nucleosome occupancy is higher in both CCAATm transgene lines than in the CCAATwt transgene.
Nucleosome occupancy across CCAATm transgene of stable expressers and non-expressers and CCAATwt in spleen. The data include the levels of occupancy at −614, −30, exon 1 and exon 5. The Y axis displays the nucleosomal occupancy following chromatin treatment with 3 units MNase relative to the undigested control. Data are representative of 2 independent experiments.
Fig. 7
Fig. 7. CCAATm transgenes show distinct patterns of CTCF binding and DNA looping
A. ChIP analysis of CTCF binding on chromatin from spleens of CCAATwt, expresser and non-expresser CCAATm transgenic strains. Results are presented as % of total Input. Note: X axis denotes location relative to the TSS and is not to scale. Arrow indicates position of the CCAAT box. Data are representative of two independent experiments. B. CCAATm expresser transgenes generate DNA loops not seen in either CCAATwt or the CAATm non-expressers transgenes. The endpoints for each loop are located at sites of enzymatic digestion which were ligated as seen by flanking PCRs using the oligos listed in Methods. The thickness of the loop correlates with intensity of the PCR bands. The location of the CCAAT box is denoted by the red arrow. The 5’ Upstream/Promoter, Intron 3, and 3’ region/boundary element are indicated

References

    1. Fitz-James M.H. and Cavalli G. (2022) Molecular mechanisms of transgenerational epigenetic inheritance. Nat Rev Genet, 23, 325–341. - PubMed
    1. Cavalli G. and Heard E. (2019) Advances in epigenetics link genetics to the environment and disease. Nature, 571, 489–499. - PubMed
    1. Arzate-Mejia R.G. and Mansuy I.M. (2022) Epigenetic Inheritance: Impact for Biology and Society-recent progress, current questions and future challenges. Environ Epigenet, 8, dvac021. - PMC - PubMed
    1. Burton N.O. and Greer E.L. (2022) Multigenerational epigenetic inheritance: Transmitting information across generations. Semin Cell Dev Biol, 127, 121–132. - PMC - PubMed
    1. Heard E. and Martienssen R.A. (2014) Transgenerational epigenetic inheritance: myths and mechanisms. Cell, 157, 95–109. - PMC - PubMed

Publication types