[Preprint]. 2023 Jun 5:2023.06.03.543569.
doi: 10.1101/2023.06.03.543569.

Early Alzheimer's disease pathology in human cortex is associated with a transient phase of distinct cell states

Affiliations

Early Alzheimer's disease pathology in human cortex is associated with a transient phase of distinct cell states

Vahid Gazestani et al. bioRxiv. .

Update in

  • Early Alzheimer's disease pathology in human cortex involves transient cell states.
    Gazestani V, Kamath T, Nadaf NM, Dougalis A, Burris SJ, Rooney B, Junkkari A, Vanderburg C, Pelkonen A, Gomez-Budia M, Välimäki NN, Rauramaa T, Therrien M, Koivisto AM, Tegtmeyer M, Herukka SK, Abdulraouf A, Marsh SE, Hiltunen M, Nehme R, Malm T, Stevens B, Leinonen V, Macosko EZ. Gazestani V, et al. Cell. 2023 Sep 28;186(20):4438-4453.e23. doi: 10.1016/j.cell.2023.08.005. Cell. 2023. PMID: 37774681 Free PMC article.

Abstract

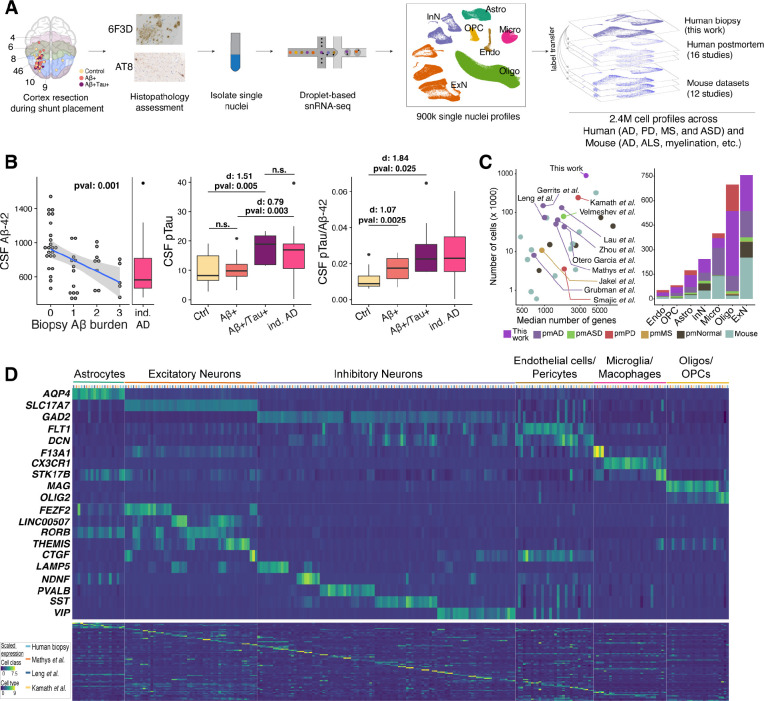
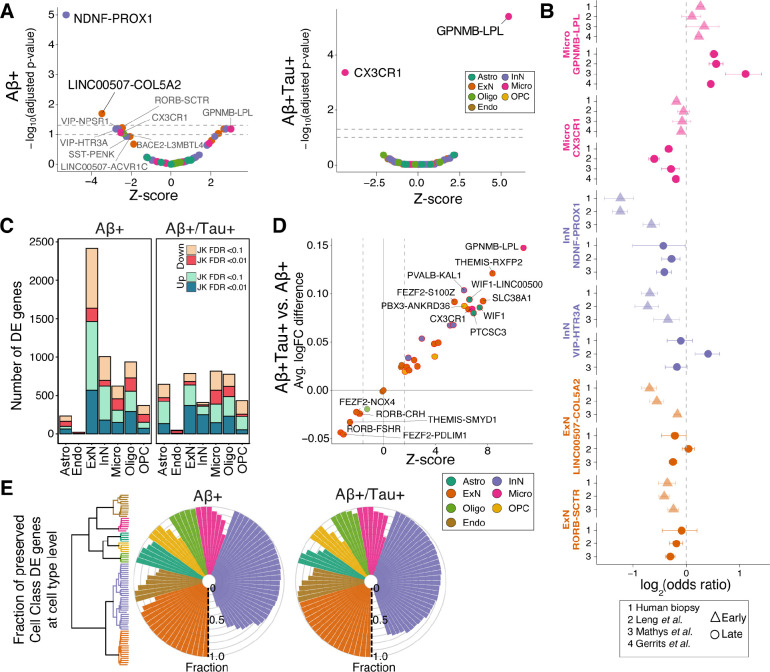
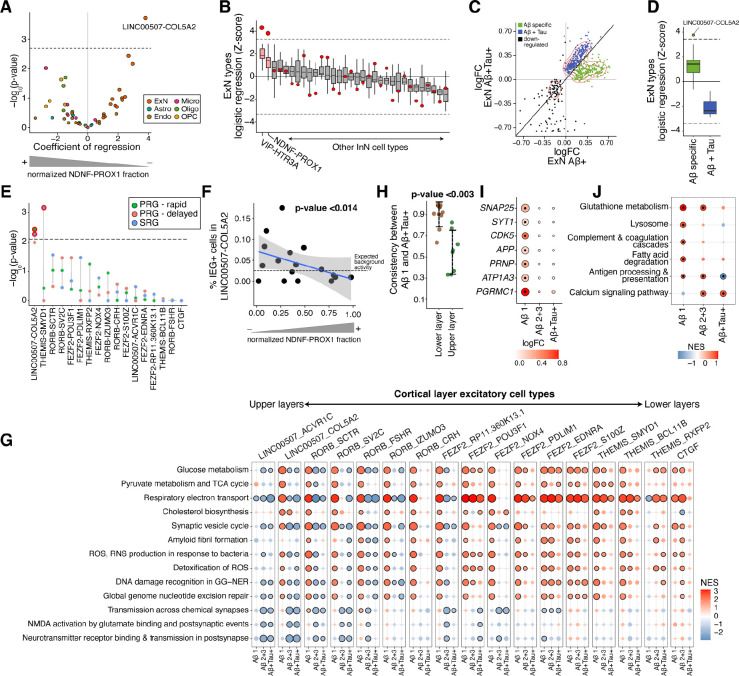
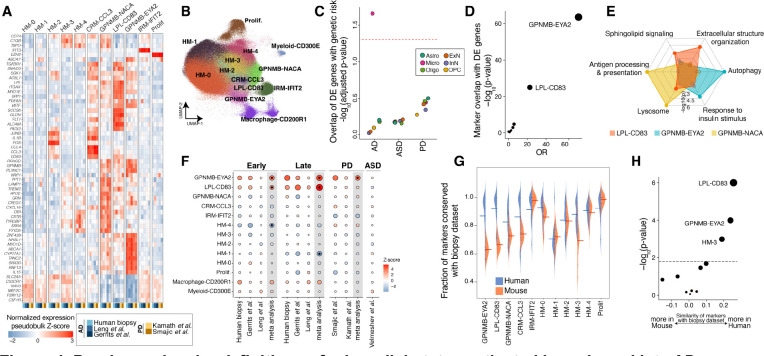
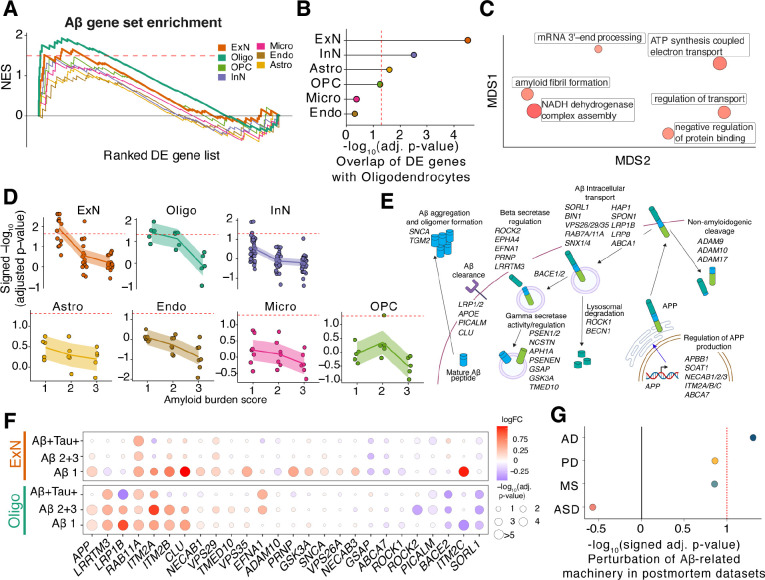
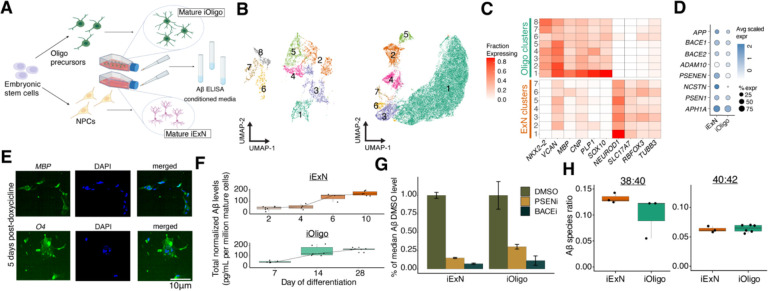
Cellular perturbations underlying Alzheimer's disease are primarily studied in human postmortem samples and model organisms. Here we generated a single-nucleus atlas from a rare cohort of cortical biopsies from living individuals with varying degrees of Alzheimer's disease pathology. We next performed a systematic cross-disease and cross-species integrative analysis to identify a set of cell states that are specific to early AD pathology. These changes-which we refer to as the Early Cortical Amyloid Response-were prominent in neurons, wherein we identified a transient state of hyperactivity preceding loss of excitatory neurons, which correlated with the selective loss of layer 1 inhibitory neurons. Microglia overexpressing neuroinflammatory-related processes also expanded as AD pathological burden increased. Lastly, both oligodendrocytes and pyramidal neurons upregulated genes associated with amyloid beta production and processing during this early hyperactive phase. Our integrative analysis provides an organizing framework for targeting circuit dysfunction, neuroinflammation, and amyloid production early in AD pathogenesis.


Figures

Figure 1.
Figure 1.. A fresh-tissue atlas of cortical states associated with AD pathology
A) Schematic of the frontal cortex brain biopsy sampling workflow. Samples were stained and quantitatively assessed for AD histopathology by the 6F3D (Aβ) and AT8 (phosphorylated tau) antibodies (Methods). Brodmann areas are color-coded in the first panel. B) CSF Aβ-42 (left), phosphorylated tau (middle) and ratio of the two (right) in association with Aβ and tau burden scores (see Methods) in 49 subjects sampled. We have excluded three individuals for whom the CSF measurements were missing. The “ind. AD” refers to an independent cohort of 36 NPH patients who were clinically diagnosed with AD prior to, or within one year after, CSF collection. Cohen d (d) effect sizes are reported. C) A summary of datasets included in the integrative analysis. Case-control datasets of human brain diseases are labeled. pm, postmortem; ASD, autism spectrum disorder; PD, Parkinson’s disease; MS, multiple sclerosis. D) Expression of markers of cell classes (top), main neuronal classes (middle), and individual cell types (bottom) across four human studies of neurodegenerative disease from the integrative analysis. Each row indicates the normalized expression level of each gene across the select human postmortem datasets (color-coded on y-axis) and 82 cell types. A detailed analysis of cell types and associated markers can be found in Table S3.
Figure 2.
Figure 2.. Identification of early- and late-stage cellular perturbations in AD
A) Volcano plot of a meta-analysis of cell type proportional changes (Methods) in early- and late-stage AD-related samples. Cell types reaching significance are labeled. Colors indicate cell class assignment. Dashed lines represent FDR thresholds of 0.05 and 0.1. B) Individual log-odds ratios of six significant cell types in Aβ+ (triangles) and Aβ+Tau+ samples (circles) for our biopsy cohort and published postmortem AD case-control datasets. Whiskers indicate standard errors. C) Number of DE genes in each cell class, stratified by biopsy histopathology. JK: Jack-knife. D) Fold change pattern concordance of DE genes between Aβ+ and Aβ+Tau+ samples. The y-axis shows the average logFC difference between Aβ+Tau+ and Aβ+. The Z-scores on x-axis are based on the transformation of p-values from a paired t-test analysis on the union of top 300 protein-coding genes (sorted by their jack-knifed p-value) from each condition. E) Fraction of DE genes in Aβ+ and Aβ+Tau+ biopsies that are similarly up- or down-regulated between the seven major cell classes and their associated subtypes in biopsy samples. The fraction was calculated by examining the top 300 protein-coding DE genes at the cell class. The dendrogram illustrates the subdivision of the seven major cell classes to a total of 82 subtypes.
Figure 3.
Figure 3.. NDNF-PROX1 inhibitory neuron loss is associated with a hyperactivity signature in L2/3 excitatory neurons.
A) Logistic mixed-effect model regression of NDNF-PROX1 proportion versus cell type transcriptional signature in Aβ+ subjects. The dashed horizontal line represents the FDR threshold of 0.05. B) Associations (by logistic mixed-effect model) between the proportion of each inhibitory neuron type with each ExN type’s transcriptional signature in Aβ+ subjects. The red dots indicate the regression Z-score of the LINC00507-COL5A2 neurons with the corresponding inhibitory neuron cell type. The dashed line represents an FDR threshold of 0.05. Center line, median; box limits, upper and lower quartiles; whiskers, 1.5x interquartile range. See Figure S7H for more details. C) Scatter plot comparing the logFC in the ExNs of Aβ+ (x-axis) and Aβ+Tau+ samples (y-axis). Visualization is based on the union of top 300 protein-coding DE genes (sorted by jack-knifed p-value) in either group. D) Logistic mixed-effect model regression of NDNF-PROX1 proportion versus early-specific up-regulated DE genes (green dots in C) and up-regulated DE genes shared in both Aβ+ and Aβ+Tau+ samples (blue dots in C) for each ExN cell type. The dashed lines represent an FDR threshold of 0.05. Center line, median; box limits, upper and lower quartiles; whiskers, 1.5x interquartile range. E) Logistic mixed-effect model regression of NDNF-PROX1 cell fraction versus expression of neural activity signatures in each ExN type in Aβ+ samples (one-sided). The dashed line represents a one-sided FDR threshold of 0.05. PRG, primary response genes; SRG, secondary response genes. F) Scatter plot showing normalized NDNF-PROX1 fraction (x-axis) and the percent of LINC00507-COL5A2 ExNs with high expression of the core immediate early genes FOS, JUNB, ARC, NPAS4, ERG1, and ERG2 (y-axis, Methods) in Aβ+ subjects. A logistic mixed-effect model was used to calculate the p-value. G) GSEA of Reactome pathways on DE results from subjects with varying Aβ and tau burdens, across ExN types. Dots outlined in black denote significant terms (FDR-adjusted p-value < 0.05). Aβ+ individuals with Aβ burden scores of 2 and 3 are grouped together. H) Concordance of DE genes between different stages of AD pathology within excitatory neuron cell types. The LINC00507+ and RORB+ were selected as upper layer excitatory neurons and FEZF2+, CTGF+, and THEMIS+ populations as lower layer. I) ExN DE genes whose products are involved in synapse vesicle cycle and trafficking (SYT1, SNAP25, and CDK5), amyloid precursor protein (APP), and receptors of oligomeric Aβ (PRNP, ATP1A3, and PGRMC1) across different Aβ and tau burdens. The outlined dots represent DE genes with jack-knifed FDR-adjusted p-value < 0.01. J) GSEA of human KEGG gene sets using DE genes of WIF1+ homeostatic astrocytes across increasing Aβ and tau burden. Outlined dots represent significant terms (FDR-adjusted p-value < 0.1).
Figure 4.
Figure 4.. Precise molecular definitions of microglial states activated in early and late AD.
A) Expression of select marker genes (Methods) across human neurodegeneration datasets in the microglia integrative analysis. The expression values represent pseudobulk expression of each marker in each cell state and dataset. B) Uniform manifold approximation and projection (UMAP) representation of microglia profiles from integrative analysis, colored by the 13 identified states. C) Dot plot of −log10-transformed p-values for MAGMA enrichment analysis (y-axis) of AD, PD, or ASD genetic risk in the up-regulated DE genes of each cell class. Dots are colored by cell class membership. Dashed line represents an FDR threshold of 0.05. D) Dot plot of −log10-transformed p-values for a Fisher’s exact test assessing the overlap between microglial DE genes with markers of each of the 13 microglial states (Methods). E) Radar plot representation of enriched gene sets in markers of the three GPNMB-LPL states. The marker analysis was conducted by comparing the three cell states against each other. See Table S6 for more details. F) Association of proportion of each microglial state with early and late AD pathology, as well as PD and ASD. In meta-analysis columns, black dots represent microglia states with significant changes in cell state proportions (FDR-adjusted p-value < 0.05). The scale of points is based on the absolute Z-score values. G) Distribution of the fraction of markers shared between the biopsy cohort and each other dataset (y-axis), in each microglial state (x-axis). Datasets are stratified by species. Mean values are denoted with a line. Only genes expressed in more than 1% of cells were considered in the analysis of each dataset. H) Statistical comparison of the differences in (G) by Student’s t-test. The dashed line represents an FDR threshold of 0.05.
Figure 5.
Figure 5.. Cell-type-specific dysregulation of amyloid formation in the human frontal cortex
A) GSEA trace plot of amyloid-associated gene set ordered by their signed p-value from DE analysis across the seven cell classes. The x-axis shows the rank order of the DE genes in corresponding cell classes; the y-axis is the normalized enrichment scores (NES) from GSEA. Bold lines indicate GSEA traces for significant cell classes, oligodendrocytes and excitatory neurons. The dashed line indicates NES score corresponding to FDR threshold of 0.05. B) Dot plot of −log10-transformed FDR-adjusted p-values of GSEA results of the top 300 upregulated protein-coding genes (sorted by their jack-knifed p-values) from each cell class against an ordered list of DE genes in oligodendrocytes. Dotted red line indicates significance at FDR threshold of 0.05. C) Multidimensional scaling (MDS) low-dimension embedding of gene ontology terms significantly enriched in intersect of DE genes between oligodendrocytes and excitatory neurons from REVIGO (see Methods). Size of dots indicate significance values. D) GSEA of amyloid gene set against cell type level DE genes across increasing levels of Aβ and tau burden. Cell types are grouped based on their major cell class annotations. The dashed line represents a significance threshold of FDR-adjusted p-value < 0.05. E) Schematic of regulation of Aβ formation, intracellular transport, and degradation/clearance pathways, showing the substituent in each pathway genes that together comprise the amyloid gene set (Table S7). F) Excitatory neuron and oligodendrocyte DE results across increasing levels of Aβ and tau burden for genes found by the leading edge analysis in A. The size of each dot is scaled by p-values and the color of each dot denotes the logFC. G) Signed −log10-transformed p-values from GSEA results for the amyloid gene set on Oligo DE genes from postmortem AD, PD, MS, and ASD cohorts.
Figure 6.
Figure 6.. Quantitation of Aβ production by human mature oligodendrocytes and excitatory neurons
A) Schematic of differentiation of ESCs and ELISA-based quantification of Aβ from conditioned media. B) Two-dimension UMAP embeddings of single-cell expression profiling for ESC-derived iOligo (left) and iExN (right) cultures. C) Expression of key marker genes in ESC-derived iOligo and iExN cultures. D) Dot plot depicting scaled expression of essential Aβ machinery in ESC-derived cultures of iOligos and iExNs. E) Representative images of immunofluorescence stains of O4 and MBP in ESC-derived iOligo cultures five days after doxycycline addition. F) Normalized Aβ protein abundance for ESC-derived iExNs (top) and iOligos (bottom) across days of differentiation. Center line, median; box limits, upper and lower quartiles; whiskers, 1.5× interquartile range; points, outliers. G) Fractional abundance of Aβ protein levels relative to median Aβ protein levels in DMSO condition for PSEN inhibitor-treated and BACE inhibitor-treated conditioned media samples for ESC-derived iOligos and iExNs. Error bars indicate one standard deviation above and below the mean value. H) Ratio of Aβ-38 to Aβ-40 and Aβ-40 to Aβ-42 species from conditioned media obtained from ESC-derived cultures of iExNs (left) and iOligos (right). Center line, median; box limits, upper and lower quartiles; whiskers, 1.5× interquartile range; points, outliers.

References

    1. De Strooper B., and Karran E. (2016). The Cellular Phase of Alzheimer’s Disease. Cell 164, 603–615. - PubMed
    1. Long J.M., and Holtzman D.M. (2019). Alzheimer Disease: An Update on Pathobiology and Treatment Strategies. Cell 179, 312–339. - PMC - PubMed
    1. Mathys H., Davila-Velderrain J., Peng Z., Gao F., Mohammadi S., Young J.Z., Menon M., He L., Abdurrob F., Jiang X., et al. (2019). Single-cell transcriptomic analysis of Alzheimer’s disease. Nature 570, 332–337. - PMC - PubMed
    1. Leng K., Li E., Eser R., Piergies A., Sit R., Tan M., Neff N., Li S.H., Rodriguez R.D., Suemoto C.K., et al. (2021). Molecular characterization of selectively vulnerable neurons in Alzheimer’s disease. Nat. Neurosci. 24, 276–287. - PMC - PubMed
    1. Lau S.-F., Cao H., Fu A.K.Y., and Ip N.Y. (2020). Single-nucleus transcriptome analysis reveals dysregulation of angiogenic endothelial cells and neuroprotective glia in Alzheimer’s disease. Proc. Natl. Acad. Sci. U. S. A. 117, 25800–25809. - PMC - PubMed

Publication types