[Preprint]. 2023 Jun 5:2023.06.02.23290880.
doi: 10.1101/2023.06.02.23290880.

Tau accumulation and its spatial progression across the Alzheimer's disease spectrum

Affiliations

Tau accumulation and its spatial progression across the Alzheimer's disease spectrum

Frédéric St-Onge et al. medRxiv. .

Update in

Abstract

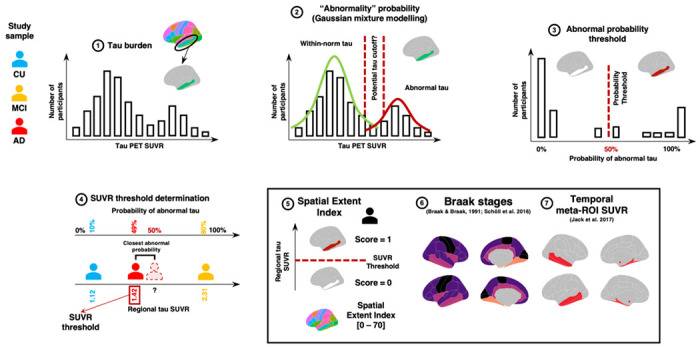
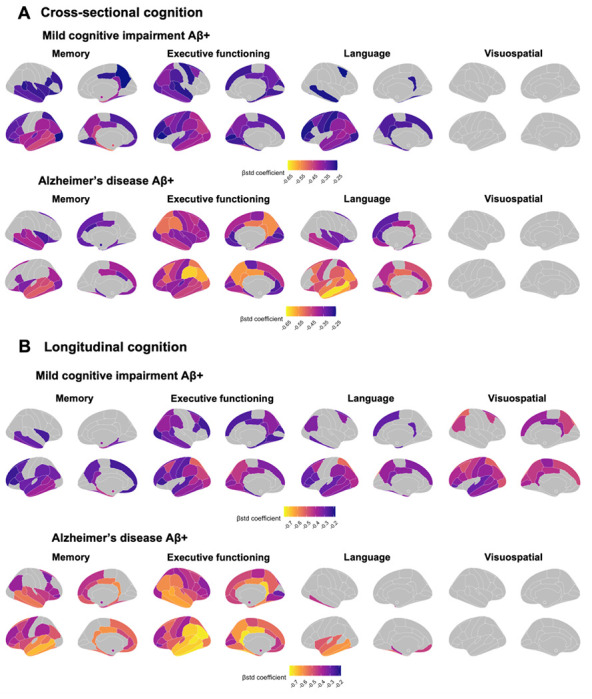
The spread of tau abnormality in sporadic Alzheimer's disease is believed typically to follow neuropathologically defined Braak staging. Recent in-vivo positron emission tomography (PET) evidence challenges this belief, however, as spreading patterns for tau appear heterogenous among individuals with varying clinical expression of Alzheimer's disease. We therefore sought better understanding of the spatial distribution of tau in the preclinical and clinical phases of sporadic Alzheimer's disease and its association with cognitive decline. Longitudinal tau-PET data (1,370 scans) from 832 participants (463 cognitively unimpaired, 277 with mild cognitive impairment (MCI) and 92 with Alzheimer's disease dementia) were obtained from the Alzheimer's Disease Neuroimaging Initiative. Among these, we defined thresholds of abnormal tau deposition in 70 brain regions from the Desikan atlas, and for each group of regions characteristic of Braak staging. We summed each scan's number of regions with abnormal tau deposition to form a spatial extent index. We then examined patterns of tau pathology cross-sectionally and longitudinally and assessed their heterogeneity. Finally, we compared our spatial extent index of tau uptake with a temporal meta region of interest-a commonly used proxy of tau burden-assessing their association with cognitive scores and clinical progression. More than 80% of amyloid-beta positive participants across diagnostic groups followed typical Braak staging, both cross-sectionally and longitudinally. Within each Braak stage, however, the pattern of abnormality demonstrated significant heterogeneity such that overlap of abnormal regions across participants averaged less than 50%. The annual rate of change in number of abnormal tau-PET regions was similar among individuals without cognitive impairment and those with Alzheimer's disease dementia. Spread of disease progressed more rapidly, however, among participants with MCI. The latter's change on our spatial extent measure amounted to 2.5 newly abnormal regions per year, as contrasted with 1 region/year among the other groups. Comparing the association of tau pathology and cognitive performance in MCI and Alzheimer's disease dementia, our spatial extent index was superior to the temporal meta-ROI for measures of executive function. Thus, while participants broadly followed Braak stages, significant individual regional heterogeneity of tau binding was observed at each clinical stage. Progression of spatial extent of tau pathology appears to be fastest in persons with MCI. Exploring the spatial distribution of tau deposits throughout the entire brain may uncover further pathological variations and their correlation with impairments in cognitive functions beyond memory.

Keywords: Alzheimer’s disease; positron emission tomography; spatial extent; tau.


Conflict of interest statement

Competing interests The authors report no competing interests.

Figures

Figure 1
Figure 1. Spatial extent methodology.
For each cortical region of the Desikan atlas and the bilateral amygdalae, we extract the standardized uptake value ratio (SUVR) of our participants (1). Then, a two-component gaussian mixture modelling technique is applied to the SUVR values in each region (2-3). The second distribution is considered to reflect abnormally high SUVR tau values. We extract the probability that each participant belongs to the “abnormal” distribution and establish a threshold that individuals with over 50% probability are considered positive for the given region (4). Once thresholds are derived across all regions, we derive the spatial extent index for each participant by summing the number of positive regions across the brain. (5). We also apply the same methodology to the average SUVR within each aggregate composing Braak stages I and III through VI (warmer to colder colors) (6). To compare our spatial extent index in the cognition analyses, we also compute the average SUVR in a classic temporal meta-ROI. (7) CU = Cognitively unimpaired, MCI = Mild cognitive impairment, AD = Alzheimer’s disease. Figure adapted from sihnpy’s documentation (https:sihnpy.readthedocs.io/) with permission of the first author.
Figure 2
Figure 2. Amyloid and tau status in the cohort.
(A) Aβ/tan (AT) status in the included participants from ADNI. Aβ positivity was established using ADNI’s tracer-specific recommendations for both florbetapir and florbetaben. Tau positivity was defined as having at least one region positive for tau pathology (spatial extent index of one and above). (B) Scatterplot of the probability of having at least one positive tau region (i.e., spatial extent index equal to or higher than one) as a function of the Aβ load (in centiloid). The probability was extracted from a logitistic regression. Odds ratio (and confidence interval) derived from a logistic regression is presented at the bottom of the graph. Note that the points were jittered by a factor of 0.065x0.065 for visualization purposes.
Figure 3
Figure 3. Spatial extent of abnormal tau deposition in amyloid positive participants of the ADNI cohort.
(A) Based on the method discussed in Figure 1, abnormality thresholds were determined for each I. Braak stages (except stage II) and for each II. region of the cortical mantle and the bilateral amygdalae (70 regions). One row on the heatmap correspond to an individual participant, while each column represents a distinct cortical region. Within each diagnostic group, participants were sorted from individuals with lowest to highest spatial extent index. Regions on the x-axis in II. are sorted by Braak stages. (B) Regional average SUVR, by diagnostic status. (C) Brain maps representing the percentage of participants having abnormal levels of tau in each region, by diagnostic status.
Figure 4
Figure 4. Spatial localization of abnormal tau accumulation over time in amyloid-positive participants of the ADNI cohort.
(A) Abnormal accumulation is presented by (I.) Braak stages and (II.) all 70 individual brain regions of the Desikan atlas. Colors denote the change in the region between the baseline and the last available visit. A stable region (negative or positive; blue or yellow) did not change status during the follow-up. A progressing region (red) was originally negative and subsequently became positive over time. A regressing region (teal) was originally positive and became negative over time. (B) Brain maps presenting the average SUVR change per region per year. (C) Brain maps representing the percentage of participants becoming tau positive in each region annually. In both (B) and (C), values in the bilateral amygdalae are represented by small colored circles in the medial view of the brain, and the annual change is calculated in each region using linear mixed effect models with random slopes and intercepts. Only participants with at least three tan scans (n = 100) were kept for (B) and (C) to ensure a constant sample across the longitudinal follow-ups.
Figure 5
Figure 5. Association between tau-PET measures, and memory performance and decline.
(A) Memory performance closest in time to the tau-PET scan and (B) memory decline computed across the study period were associated to both temporal meta-ROI SUVR and spatial extent index in Aβ-positive participants using linear regressions. Cognitive decline was computed for each participant with more than two cognitive timepoints using linear mixed effect models with random slopes and intercepts. In each panel, columns represent a diagnostic group (leftmost black: whole sample, second from the left/blue: cognitively unimpaired, second from the right orange: mild cognitive impairment, right-most/red: Alzheimer’s disease). Simple and standardized β coefficients, adjusted R2 and AIC, controlled for age sex and education, are shown on the graphs. P-value of models are indicated next to the simple beta coefficients. (° : P < 0.1, * : P < 0.05, ** : P < 0.01, *** P < 0.001) Results remained significant after a multiple comparison false discovery rate (FDR) correction.
Figure 6
Figure 6. Region-wise associations between regional tau-PET SUVR and cognitive performance and decline in participants with MCI and Alzheimer’s disease.
Association between tau-PET SUVR and cognitive performance (A) and cognitive decline (B) in participants with MCI and with Alzheimer’s disease across four cognitive domains (memory, executive functioning, language and visuospatial). Cognitive decline was computed for each participant with more than two cognitive timepoints using linear mixed effect models with random slopes and intercepts. The standardized β coefficients of the associations between tau-PET SUVR in a specific region and each cognition measure is displayed if it survives adjustment for age, sex and education and a multiple comparison false discovery rate (FDR) Correction (Pcorrected < 0.05).

Similar articles

References

    1. Xia C, Arteaga J, Chen G, et al. [ 18 F]T807, a novel tau positron emission tomography imaging agent for Alzheimer’s disease. Alzheimers Dement. 2013;9(6):666–676. doi:10.1016/j.jalz.2012.11.008 - DOI - PubMed
    1. Leuzy A, Chiotis K, Lemoine L, et al. Tau PET imaging in neurodegenerative tauopathies—still a challenge. Mol Psychiatry. 2019;24(8):1112–1134. doi:10.1038/s41380-018-0342-8 - DOI - PMC - PubMed
    1. Lowe VJ, Curran G, Fang P, et al. An autoradiographic evaluation of AV-1451 Tau PET in dementia. Acta Neuropathol Commun. 2016;4(1):58. doi:10.1186/s40478-016-0315-6 - DOI - PMC - PubMed
    1. Marquié M, Normandin MD, Vanderburg CR, et al. Validating novel tau positron emission tomography tracer [F-18]-AV-1451 (T807) on postmortem brain tissue: Validation of PET Tracer. Ann Neurol. 2015;78(5):787–800. doi:10.1002/ana.24517 - DOI - PMC - PubMed
    1. Schöll M, Lockhart SN, Schonhaut DR, et al. PET Imaging of Tau Deposition in the Aging Human Brain. Neuron. 2016;89(5):971–982. doi:10.1016/j.neuron.2016.01.028 - DOI - PMC - PubMed

Publication types