

This is a preprint.
Combined GWAS and single cell transcriptomics uncover the underlying genes and cell types in disorders of gut-brain interaction
- PMID: 37333423
- PMCID: PMC10275016
- DOI: 10.1101/2023.06.02.23290906
Combined GWAS and single cell transcriptomics uncover the underlying genes and cell types in disorders of gut-brain interaction
Abstract
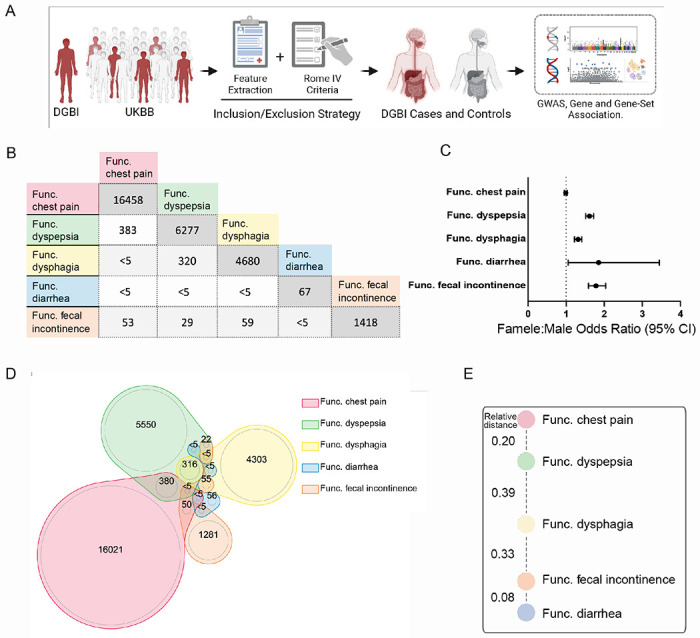
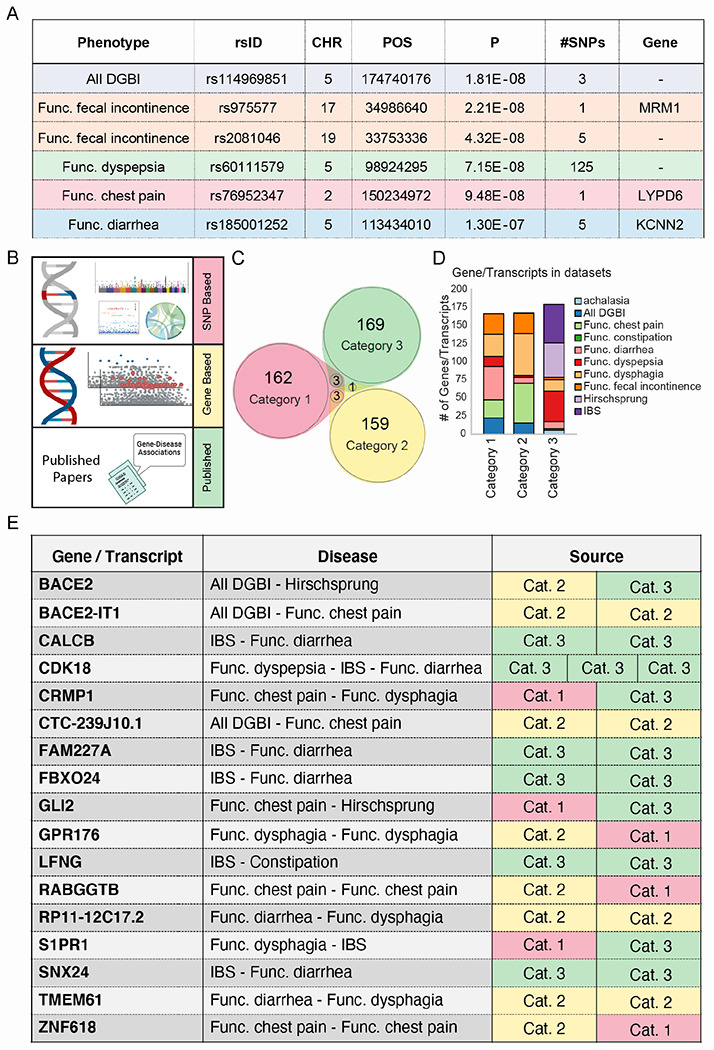
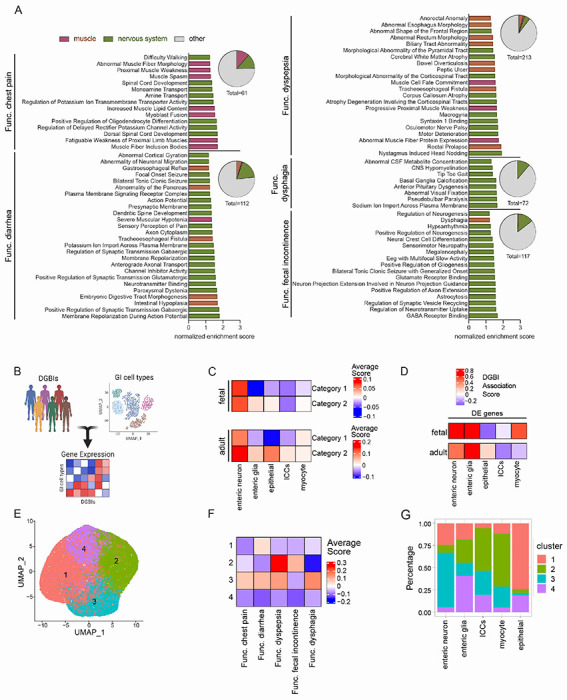
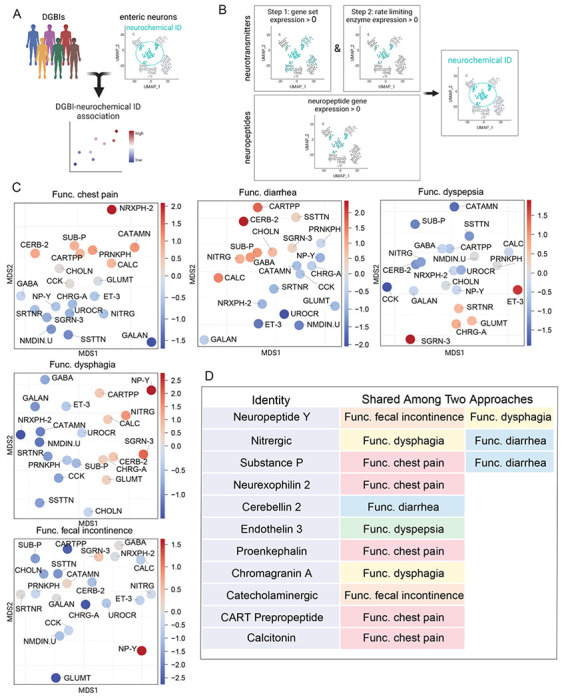
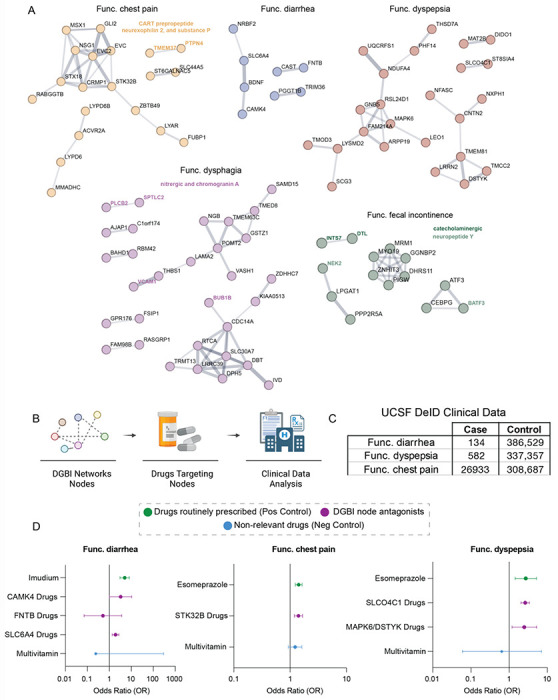
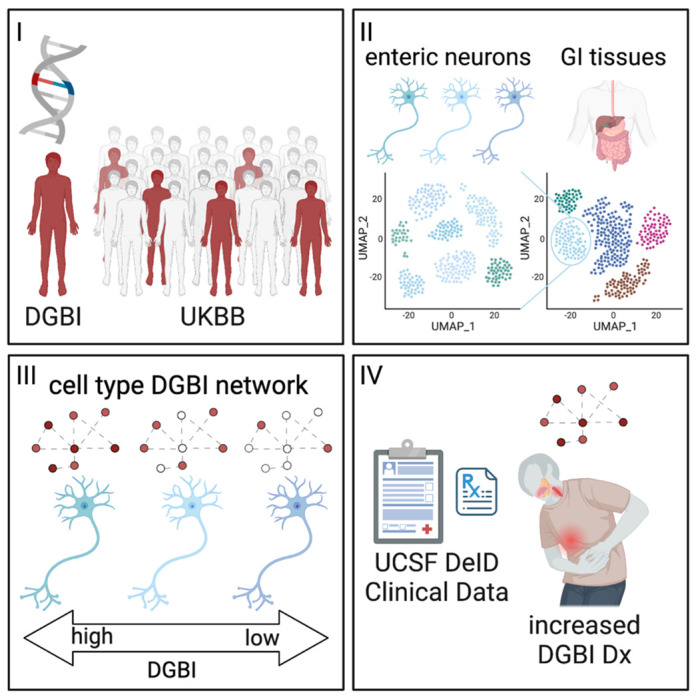
Disorders of gut-brain interaction (DGBIs), formerly known as functional gastrointestinal disorders, are extremely common and historically difficult to manage. This is largely because their cellular and molecular mechanisms have remained poorly understood and understudied. One approach to unravel the molecular underpinnings of complex disorders such as DGBIs is performing genome wide association studies (GWASs). However, due to the heterogenous and non-specific nature of GI symptoms, it has been difficult to accurately classify cases and controls. Thus, to perform reliable studies, we need to access large patient populations which has been difficult to date. Here, we leveraged the UK Biobank (UKBB) database, containing genetic and medical record data of over half a million individuals, to perform GWAS for five DGBI categories: functional chest pain, functional diarrhea, functional dyspepsia, functional dysphagia, and functional fecal incontinence. By applying strict inclusion and exclusion criteria, we resolved patient populations and identified genes significantly associated with each condition. Leveraging multiple human single-cell RNA-sequencing datasets, we found that the disease associated genes were highly expressed in enteric neurons, which innervate and control GI functions. Further expression and association testing-based analyses revealed specific enteric neuron subtypes consistently linked with each DGBI. Furthermore, protein-protein interaction analysis of each of the disease associated genes revealed protein networks specific to each DGBI, including hedgehog signaling for functional chest pain and neuronal function and neurotransmission for functional diarrhea and functional dyspepsia. Finally, through retrospective medical record analysis we found that drugs that inhibit these networks are associated with an increased disease risk, including serine/threonine kinase 32B drugs for functional chest pain, solute carrier organic anion transporter family member 4C1, mitogen-activated protein kinase 6, and dual serine/threonine and tyrosine protein kinase drugs for functional dyspepsia, and serotonin transporter drugs for functional diarrhea. This study presents a robust strategy for uncovering the tissues, cell types, and genes involved in DGBIs, presenting novel predictions of the mechanisms underlying these historically intractable and poorly understood diseases.
Figures
Similar articles
-
Disorders of gut-brain interaction: Highly prevalent and burdensome yet under-taught within medical education.United European Gastroenterol J. 2022 Sep;10(7):736-744. doi: 10.1002/ueg2.12271. Epub 2022 Jul 3. United European Gastroenterol J. 2022. PMID: 35781806 Free PMC article.
-
Role of microRNAs in Disorders of Gut-Brain Interactions: Clinical Insights and Therapeutic Alternatives.J Pers Med. 2021 Oct 12;11(10):1021. doi: 10.3390/jpm11101021. J Pers Med. 2021. PMID: 34683162 Free PMC article. Review.
-
The aging gut: Symptoms compatible with disorders of gut-brain interaction (DGBI) in older adults in the general population.J Am Geriatr Soc. 2024 Feb;72(2):479-489. doi: 10.1111/jgs.18679. Epub 2023 Nov 9. J Am Geriatr Soc. 2024. PMID: 37945291
-
Early life adversity promotes gastrointestinal dysfunction through a sex-dependent phenotypic switch in enteric glia.bioRxiv [Preprint]. 2024 Jun 3:2024.05.31.596805. doi: 10.1101/2024.05.31.596805. bioRxiv. 2024. PMID: 38895433 Free PMC article. Preprint.
-
The gut microbiome in disorders of gut-brain interaction.Gut Microbes. 2024 Jan-Dec;16(1):2360233. doi: 10.1080/19490976.2024.2360233. Epub 2024 Jul 1. Gut Microbes. 2024. PMID: 38949979 Free PMC article. Review.
References
-
- Drossman D. A. Functional Gastrointestinal Disorders: History, Pathophysiology, Clinical Features, and Rome IV. Gastroenterology 150, 1262–1279.e2 (2016). - PubMed
-
- Sperber A. D. et al. Worldwide Prevalence and Burden of Functional Gastrointestinal Disorders, Results of Rome Foundation Global Study. Gastroenterology 160, 99–114.e3 (2021). - PubMed
Publication types
Grants and funding
LinkOut - more resources
Full Text Sources