. 2022 Dec 7:4:xtac029.
doi: 10.1093/femsmc/xtac029. eCollection 2023.

Organic and inorganic nutrients modulate taxonomic diversity and trophic strategies of small eukaryotes in oligotrophic oceans

Affiliations

Organic and inorganic nutrients modulate taxonomic diversity and trophic strategies of small eukaryotes in oligotrophic oceans

Naomi Villiot et al. FEMS Microbes. .

Abstract

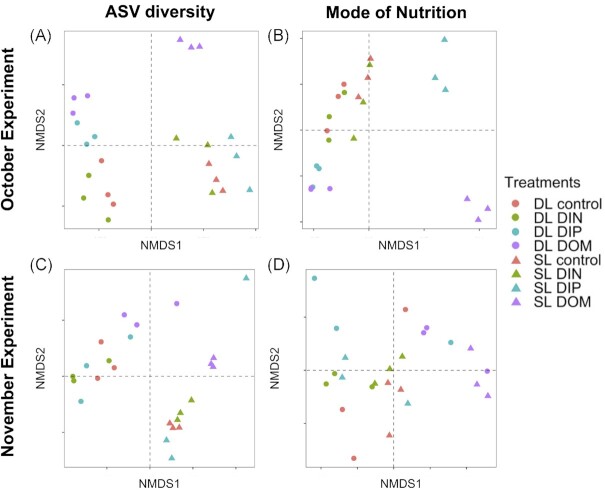
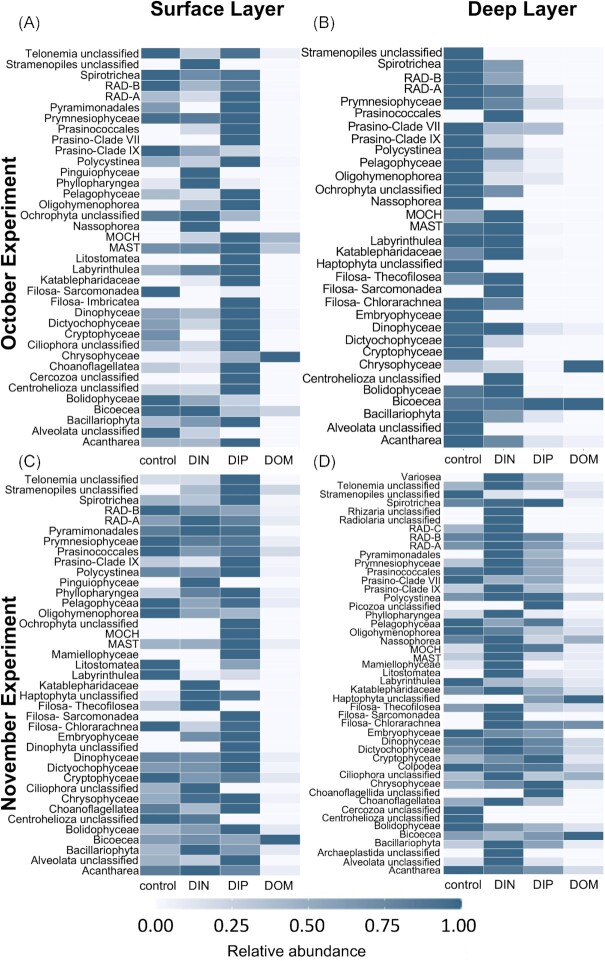
As the oligotrophic gyres expand due to global warming, exacerbating resource limitation impacts on primary producers, predicting changes to microbial assemblages and productivity requires knowledge of the community response to nutrient availability. This study examines how organic and inorganic nutrients influence the taxonomic and trophic composition (18S metabarcoding) of small eukaryotic plankton communities (< 200 µm) within the euphotic zone of the oligotrophic Sargasso Sea. The study was conducted by means of field sampling of natural microbial communities and laboratory incubation of these communities under different nutrient regimes. Dissimilarity in community composition increased along a depth gradient, with a homogeneous protist community within the mixed layer and distinct microbial assemblages at different depths below the deep chlorophyll maximum. A nutrient enrichment assay revealed the potential of natural microbial communities to rapidly shift in composition in response to nutrient addition. Results highlighted the importance of inorganic phosphorus availability, largely understudied compared to nitrogen, in constraining microbial diversity. Dissolved organic matter addition led to a loss of diversity, benefiting a limited number of phagotrophic and mixotrophic taxa. Nutrient history of the community sets the physiological responsiveness of the eukaryotic community to changing nutrient regimes and needs to be considered in future studies.

Keywords: biodiversity; dissolved inorganic phosphorus; marine protists; metabarcoding; nutrient competition; trophic strategy.


Conflict of interest statement

None declared

Figures

Figure 1.
Figure 1.
Vertical profiles of the physico-chemical and biological parameters at Hydrostation ‘S’ during sampling in October (A, B) and November (C, D). Temperature (grey dots) and fluorescence (solid black line) data correspond to in situ measurements recorded with a CTD. Normalized Chl-a (green diamonds), dissolved inorganic nitrogen (blue dots) and dissolved organic phosphorus (red dots), and normalized abundances of cyanobacteria (cross shape with dotted cyan line) and photosynthetic eukaryotes (cross shape with dotted green line) detected by flow cytometry (in November only), were all computed from samples collected with a rosette and processed in the laboratory.
Figure 2.
Figure 2.
Analysis of the ASVs community composition along the depth gradient in November 2020: vertical profile of Bray–Curtis dissimilarity (A) and Shannon measures diversity (B), as well as non-metric multidimensional scaling (nMDS) ordination of the samples ASVs composition (C). Two-D stress indicated good fits (Kruskal, 1964) in the nMDS ordination, with a value less than 0.1.
Figure 3.
Figure 3.
Taxonomic and functional composition (relative abundance, %) of the eukaryotic communities (excluding parasites and saprotrophs) in samples collected from different depths in the water column during October (A) and November (B). The two most abundant taxonomic classes are displayed for each functional group. Surface layers (SL), deep layers (DL) and deep chlorophyll maximum (DCM) are indicated.
Figure 4.
Figure 4.
Magnitude of change in trophic groups between initials (t0) and controls for the month of October (A, B) and November (C, D). Magnitude of change is expressed in log2 fold change, as estimated by the DESeq2 analysis. Dark bars represent groups for which the change was statistically significant (P-values < 0.05, two-sided Wald test corrected with the Benjamini & Hochberg method). Horizontal lines show the standard error.
Figure 5.
Figure 5.
Relative abundances of the taxonomic classes within the functional groups mixotrophs (A, E), phagotrophs (B, F), photoautotrophs (C, G), and ‘trophy undetermined’ including the ‘unclassified Dynophyceae’ (D, H) between sampling times (t0s) and controls from the surface layer (SL) and deep layer (DL) in October 2020 (A, B, C, D) and November (E, F, G, H) 2020.
Figure 6.
Figure 6.
Comparison of Shannon measures of diversity between the different experimental treatments (controls; dissolved inorganic nitrogen, DIN; dissolved inorganic phosphorus, DIP; dissolved organic matter, DOM) by ASV diversity (A, C) and mode of nutrition (B, D) for October (A, B) and November (C, D) 2020 in both the surface layer (SL) and the deep layer (DL).
Figure 7.
Figure 7.
Non-metric multidimensional scaling (nMDS) ordinations of sample composition in the different experimental treatments (controls; dissolved inorganic nitrogen, DIN; dissolved inorganic phosphorus, DIP; dissolved organic matter, DOM) in terms of taxonomic composition (A, C) and nutritional mode (B, D) for October (A, B) and November (C, D) 2020 in both the surface layer (SL) and the deep layer (DL). Two-D stress indicated good fits (Kruskal, 1964) in all nMDS ordinations, with values less than 0.1 (A, 0.04; B, 0.02; C, 0.06; D, 0.01).
Figure 8.
Figure 8.
Comparison of the relative abundances of each taxonomic class between treatments (controls; dissolved inorganic nitrogen, DIN; dissolved inorganic phosphorus, DIP; dissolved organic matter, DOM) in communities sampled both at the surface layer (A, C) and deep layer (B, D) for the experiment of October (A, B) and the experiment of November (C, D) 2020. Saturated blue tiles corresponded to the treatments with the highest relative abundances of each class while white tiles corresponded to the treatment with the lowest relative abundance. Heatmaps showing the relative abundances for the individual replicates of the November experiment are available in Fig. S3.
Figure 9.
Figure 9.
Relative abundances (%) of cyanobacteria, including Synechococcus and Prochlorococcus, and eukaryotes determined by flow cytometry (FL3/FSC) for each treatment (before incubation, t0; after incubation, controls; dissolved inorganic nitrogen, DIN; dissolved inorganic phosphorus, DIP; dissolved organic matter, DOM) in communities sampled both in the surface layer (SL) and deep layer (DL) in November 2020.
Figure 10.
Figure 10.
Magnitude of change in trophic groups between treatments (dissolved inorganic nitrogen, DIN; dissolved inorganic phosphorus, DIP) and controls in communities sampled both in the surface layer (SL) and deep layer (DL) for the month of October(A) and November(B). Magnitude of change is expressed in log2 fold change, as estimated by the DESeq2 analysis. Dark bars represent groups for which the change was found to be statistically significant (P-value < 0.05, two-sided Wald test corrected with the Benjamini & Hochberg method). The significance of changes in phagotrophs in the treatment DIP at the DL in November (H) was not determined (P-value = NA) due to the presence of an extreme count outlier detected by Cook's distance. Horizontal lines show the standard error.
Figure 11.
Figure 11.
Magnitude of change in trophic groups between treatments dissolved organic matter (DOM) and controls for communities sampled in both the surface layer (SL) and deep layer (DL) in October (A, B) and November (C, D) 2020. Magnitude of change is expressed in log2 fold change, as estimated by the DESeq2 analysis. Dark bars represent groups for which the change was statistically significant (P-value < 0.05, two-sided Wald test corrected with the Benjamini & Hochberg method). The photoautotrophs change significance at the DL (B) in October 2020 as well as the phagotrophs change significance of at the DL (D) were not determined (P-value = NA) due to the presence of an extreme count outlier detected by Cook's distance. Horizontal lines show the standard error.

Similar articles

Cited by

References

    1. Adl SM, Bass D, Lane CEet al. . Revisions to the classification, nomenclature, and diversity of eukaryotes. J Eukaryot Microbiol. 2019;66:4–119. - PMC - PubMed
    1. Agis M, Granda A, Dolan JR. A cautionary note: examples of possible microbial community dynamics in dilution grazing experiments. J Exp Mar Biol Ecol. 2007;341:176–83.
    1. Anderson R, Charvet S, Hansen PJ. Mixotrophy in chlorophytes and haptophytes—effect of irradiance, macronutrient, micronutrient and vitamin limitation. Front Microbiol. 2018;9:1704. - PMC - PubMed
    1. Antia NJ, Harrison PJ, Oliveira L. The role of dissolved organic nitrogen in phytoplankton nutrition, cell biology and ecology. Phycologia. 1991;30:1–89.
    1. Arrigo KR. Marine microorganisms and global nutrient cycles. Nature. 2005;437:349–55. - PubMed

LinkOut - more resources