

An amino acid metabolism-based seventeen-gene signature correlates with the clinical outcome and immune features in pancreatic cancer
- PMID: 37333498
- PMCID: PMC10272610
- DOI: 10.3389/fgene.2023.1084275
An amino acid metabolism-based seventeen-gene signature correlates with the clinical outcome and immune features in pancreatic cancer
Abstract
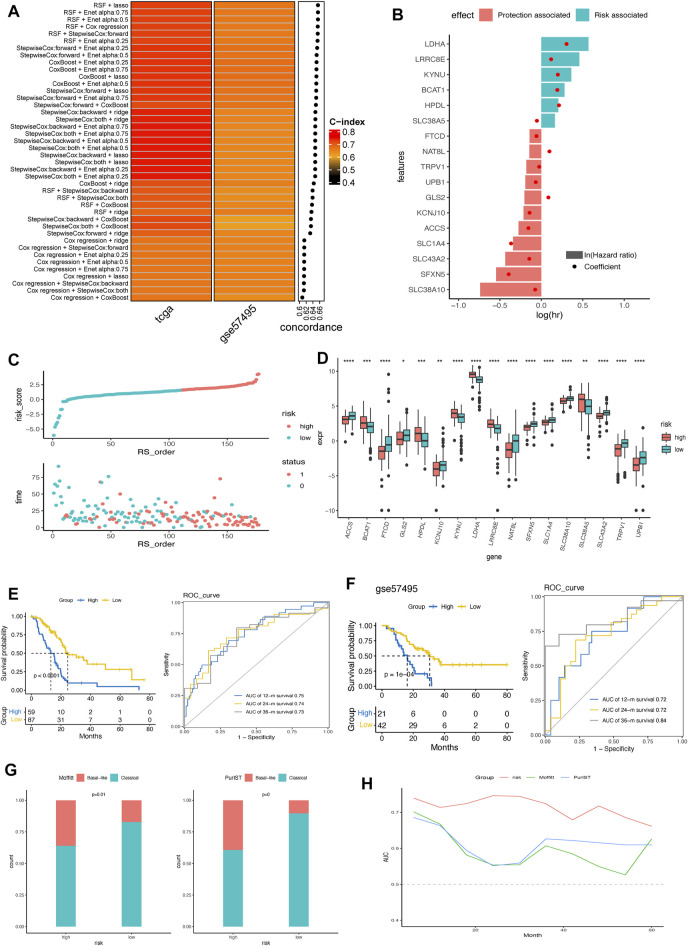
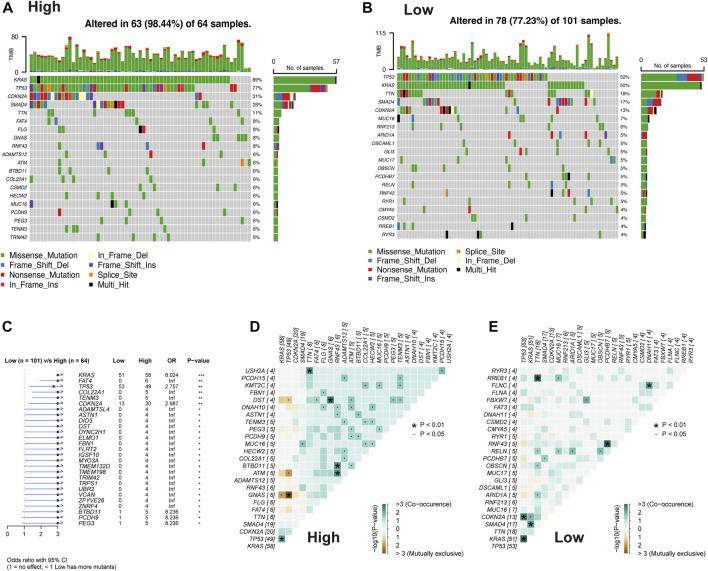
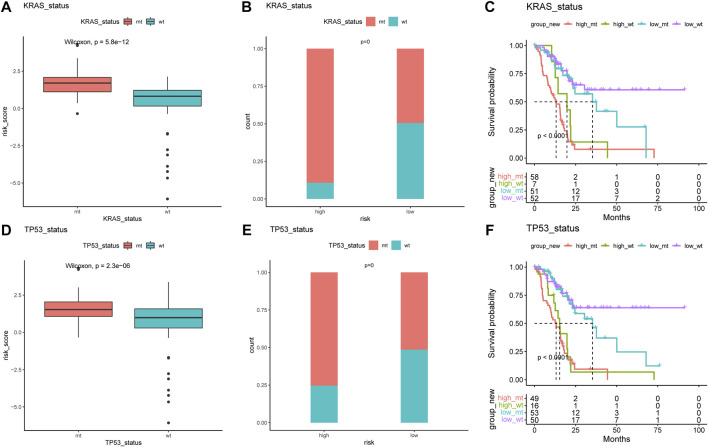
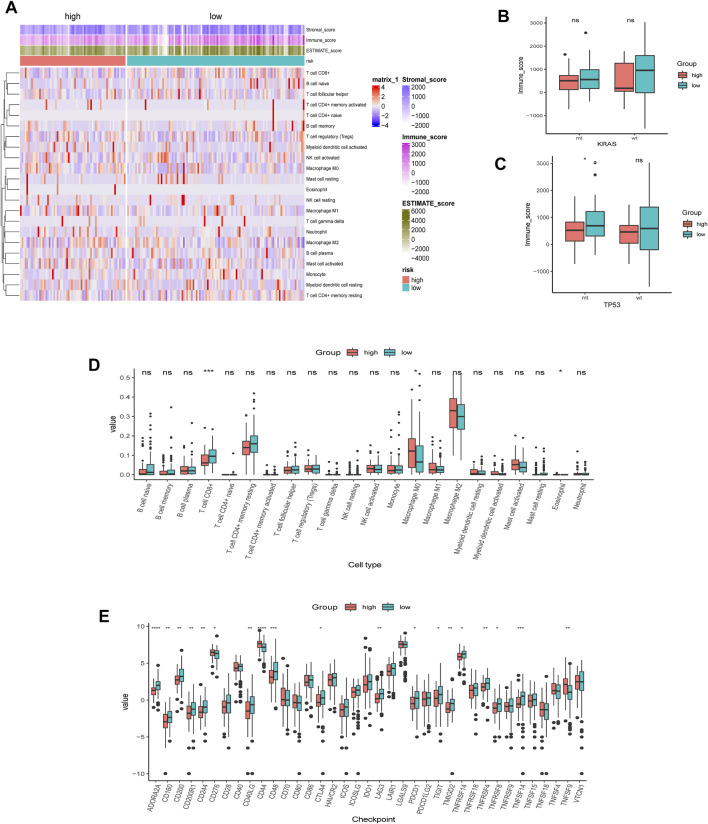
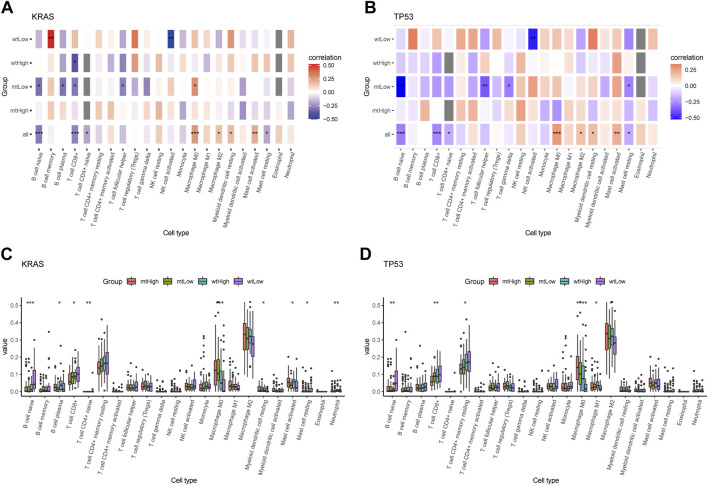
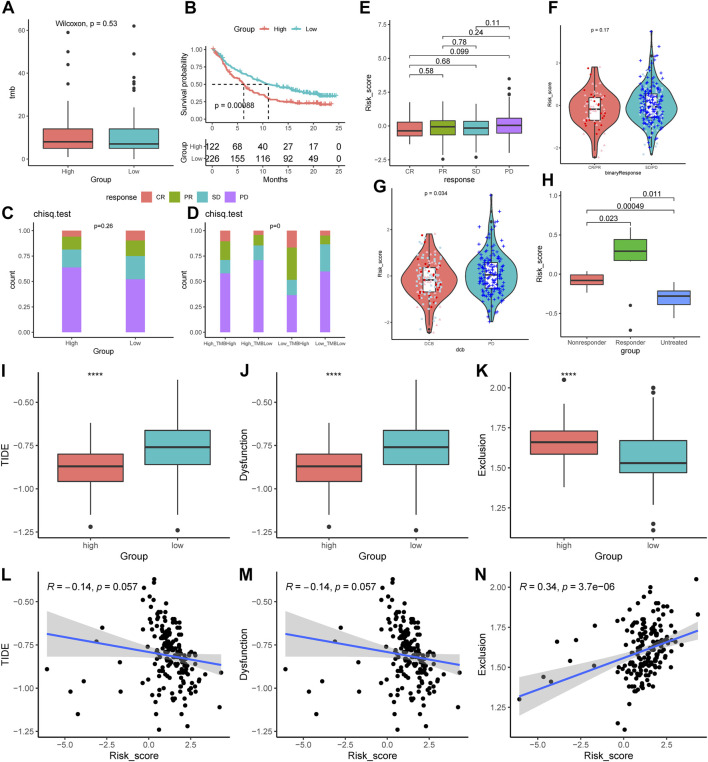
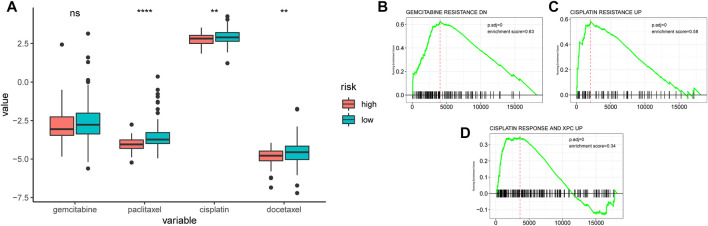
Background: Pancreatic cancer is an aggressive tumor with a low 5-year survival rate and primary resistance to most therapy. Amino acid (AA) metabolism is highly correlated with tumor growth, crucial to the aggressive biological behavior of pancreatic cancer; nevertheless, the comprehensive predictive significance of genes that regulate AA metabolism in pancreatic cancer remains unknown. Methods: The mRNA expression data downloaded from The Cancer Genome Atlas (TCGA) were derived as the training cohort, and the GSE57495 cohort from Gene Expression Omnibus (GEO) database was applied as the validation cohort. Random survival forest (RSF) and the least absolute shrinkage and selection operator (LASSO) regression analysis were employed to screen genes and construct an AA metabolism-related risk signature (AMRS). Kaplan-Meier analysis and receiver operating characteristic (ROC) curve were performed to assess the prognostic value of AMRS. We performed genomic alteration analysis and explored the difference in tumor microenvironment (TME) landscape associated with KRAS and TP53 mutation in both high- and low-AMRS groups. Subsequently, the relationships between AMRS and immunotherapy and chemotherapy sensitivity were evaluated. Results: A 17-gene AA metabolism-related risk model in the TCGA cohort was constructed according to RSF and LASSO. After stratifying patients into high- and low-AMRS groups based on the optimal cut-off value, we found that high-AMRS patients had worse overall survival (OS) in the training cohort (a median OS: 13.1 months vs. 50.1 months, p < 0.0001) and validation cohort (a median OS: 16.2 vs. 30.5 months, p = 1e-04). Genetic mutation analysis revealed that KRAS and TP53 were significantly more mutated in high-AMRS group, and patients with KRAS and TP53 alterations had significantly higher risk scores than those without. Based on the analysis of TME, low-AMRS group displayed significantly higher immune score and more enrichment of T Cell CD8+ cells. In addition, high-AMRS-group exhibited higher TMB and significantly lower tumor immune dysfunction and exclusion (TIDE) score and T Cells dysfunction score, which suggested a higher sensitive to immunotherapy. Moreover, high-AMRS group was also more sensitive to paclitaxel, cisplatin, and docetaxel. Conclusion: Overall, we constructed an AA-metabolism prognostic model, which provided a powerful prognostic predictor for the clinical treatment of pancreatic cancer.
Keywords: amino acid metabolism; chemosensitivity; genomic alterations; immunotherapy; pancreatic cancer; prognosis; tumor microenvironment.
Copyright © 2023 Hao, Zhou, Wang, Ma, Wu, Lv and Wu.
Conflict of interest statement
The authors declare that the research was conducted in the absence of any commercial or financial relationships that could be construed as a potential conflict of interest.
Figures

Similar articles
-
Comprehensive FGFR3 alteration-related transcriptomic characterization is involved in immune infiltration and correlated with prognosis and immunotherapy response of bladder cancer.Front Immunol. 2022 Jul 26;13:931906. doi: 10.3389/fimmu.2022.931906. eCollection 2022. Front Immunol. 2022. PMID: 35958598 Free PMC article.
-
Mitochondrial-Related Transcriptome Feature Correlates with Prognosis, Vascular Invasion, Tumor Microenvironment, and Treatment Response in Hepatocellular Carcinoma.Oxid Med Cell Longev. 2022 Apr 30;2022:1592905. doi: 10.1155/2022/1592905. eCollection 2022. Oxid Med Cell Longev. 2022. PMID: 35535359 Free PMC article.
-
Integrative transcriptional characterization of cell cycle checkpoint genes promotes clinical management and precision medicine in bladder carcinoma.Front Oncol. 2022 Aug 11;12:915662. doi: 10.3389/fonc.2022.915662. eCollection 2022. Front Oncol. 2022. PMID: 36033441 Free PMC article.
-
Identification of cuproptosis-related subtypes, construction of a prognosis model, and tumor microenvironment landscape in gastric cancer.Front Immunol. 2022 Nov 21;13:1056932. doi: 10.3389/fimmu.2022.1056932. eCollection 2022. Front Immunol. 2022. PMID: 36479114 Free PMC article.
-
A novel immunogenomic signature to predict prognosis and reveal immune infiltration characteristics in pancreatic ductal adenocarcinoma.Precis Clin Med. 2022 Apr 25;5(2):pbac010. doi: 10.1093/pcmedi/pbac010. eCollection 2022 Jun. Precis Clin Med. 2022. PMID: 35694712 Free PMC article.
Cited by
-
Roles of non-coding RNAs in the metabolism and pathogenesis of bladder cancer.Hum Cell. 2023 Jul;36(4):1343-1372. doi: 10.1007/s13577-023-00915-5. Epub 2023 May 20. Hum Cell. 2023. PMID: 37209205 Review.
References
-
- Bednar F., Pasca di Magliano M. (2020). Chemotherapy and tumor evolution shape pancreatic cancer recurrence after resection. Cancer Discov. 10, 762–764. 10.1158/2159-8290.CD-20-0359 - DOI - PubMed
LinkOut - more resources
Full Text Sources
Research Materials
Miscellaneous