. 2023;11(1):127.
doi: 10.1186/s40494-023-00957-w. Epub 2023 Jun 16.

Visualising varnish removal for conservation of paintings by fluorescence lifetime imaging (FLIM)

Affiliations

Visualising varnish removal for conservation of paintings by fluorescence lifetime imaging (FLIM)

Christine B Wilda et al. Herit Sci. 2023.

Abstract

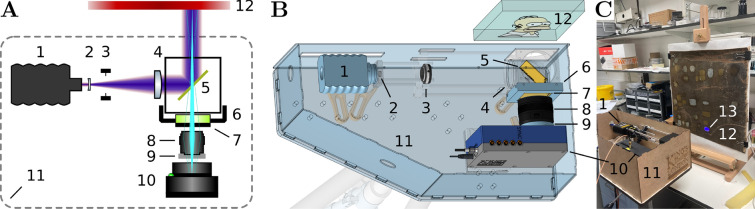
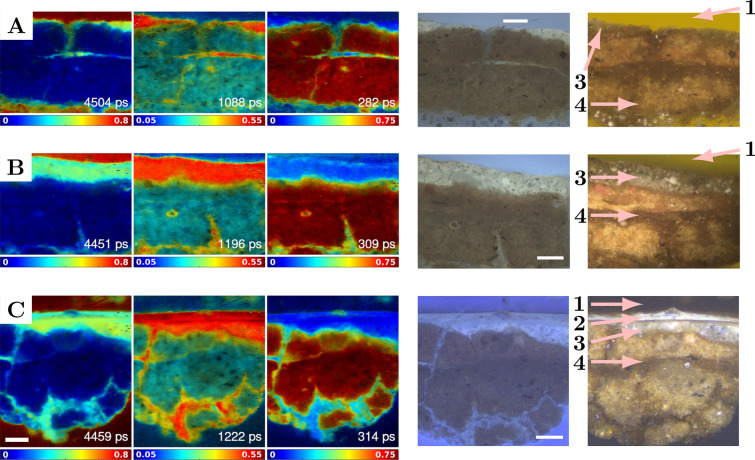
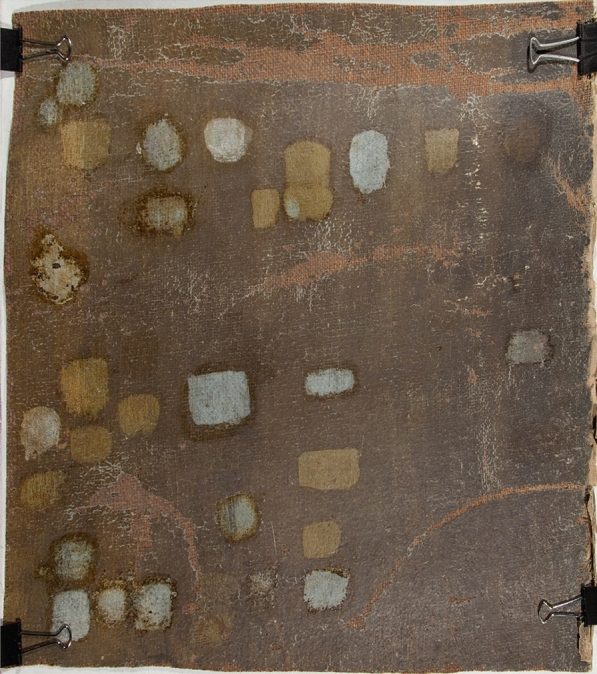
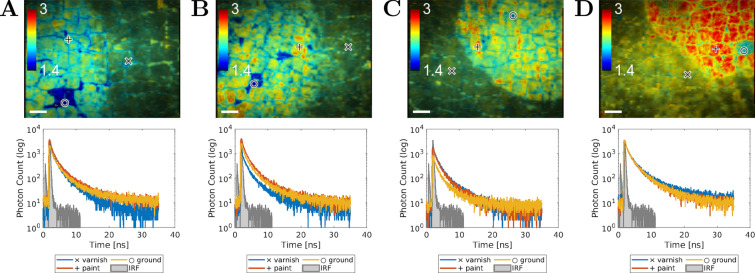
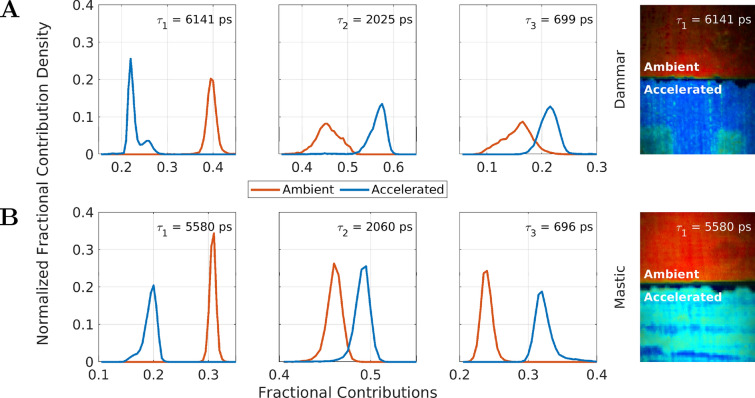
The removal of varnish from the surface is a key step in painting conservation. Varnish removal is traditionally monitored by examining the painting surface under ultraviolet illumination. We show here that by imaging the fluorescence lifetime instead, much better contrast, sensitivity, and specificity can be achieved. For this purpose, we developed a lightweight (4.8 kg) portable instrument for macroscopic fluorescence lifetime imaging (FLIM). It is based on a time-correlated single-photon avalanche diode (SPAD) camera to acquire the FLIM images and a pulsed 440 nm diode laser to excite the varnish fluorescence. A historical model painting was examined to demonstrate the capabilities of the system. We found that the FLIM images provided information on the distribution of the varnish on the painting surface with greater sensitivity, specificity, and contrast compared to the traditional ultraviolet illumination photography. The distribution of the varnish and other painting materials was assessed using FLIM during and after varnish removal with different solvent application methods. Monitoring of the varnish removal process between successive solvent applications by a swab revealed an evolving image contrast as a function of the cleaning progress. FLIM of dammar and mastic resin varnishes identified characteristic changes to their fluorescence lifetimes depending on their ageing conditions. Thus, FLIM has a potential to become a powerful and versatile tool to visualise varnish removal from paintings.

Keywords: Fluorescence lifetime; Fluorescence lifetime imaging (FLIM); Painting conservation; Single-photon avalanche diode (SPAD); Time-correlated single photon counting (TCSPC); Time-resolved fluorescence spectroscopy; Varnish removal.


Conflict of interest statement

Competing interestsAuthors declare no competing financial interests.

Figures

Fig. 1
Fig. 1
Optical setup. Panel A presents the diagram of the optical setup. Panel B shows the top-view 3D rendering of the optical setup. The critical optical components were emphasised by making the the supportive components appear semi-transparent. Panel C is a photo of the assembled optical setup in use with the model painting. The components in the panels are numbered: 1 − laser, 2 − concave lens, 3 − variable iris aperture, 4 − convex lens, 5 − chromatic mirror, 6 − removable emission filter holder, 7 − emission filter, 8 − objective lens, 9 − objective lens holder, 10 − SPAD camera, 11 − wooden case with its lid removed, 12 − painting, and 13 − illuminated spot on the painting. The illuminated spot was larger (≈ 35 mm in diameter) than the field of view (13.5 × 18 mm2) captured by the camera
Fig. 2
Fig. 2
Varnish removal imaged by UV, visible light, and average fluorescence lifetime contrast. Four different varnish removal methods were used on the same painting: A swab with no mechanical action (Swab NMA), B swab with mechanical action (Swab MA), C gel with no mechanical action (Gel NMA), and D gel with mechanical action (Gel MA). In the left column are photos under UV illumination, in the middle column under white light illumination, and in the right column are the intensity-weighted average fluorescence lifetime images. The fluorescence lifetime range is 1.4 ns to 3.0 ns (false-colour scale in A) and the scale bars 5 mm (A) apply to (AD)
Fig. 3
Fig. 3
Image mosaicking. A Section of UV-illuminated photograph of the painting corresponding to a B 4 × 3 mosaic of fluorescence lifetime images. Fluorescence lifetime range is 1.4 ns to 3.0 ns. Scale bars 5 mm
Fig. 4
Fig. 4
FLIM of gradual varnish removal. Rows of images showing the intensity-weighted fractional contributions as they developed during the gradual varnish removal treatment. The representative fluorescence lifetimes and the false-colour scale representing the fractional contributions for each row are shown in the images in the first column. The numbers of solvent applications are indicated in the top-right corners in the first rows of the images in A and B. A The solvent was applied to the painting by a swab without mechanical action. In total, 120 rolls of the swab were performed with 30 rolls between imaging. B The solvent was applied by a swab with mechanical action in a total of 40 rolls with 10 rolls between imaging. Text boxes and arrows in A highlighted the materials of the painting assigned to their characteristic lifetimes. Scale bars 5 mm
Fig. 5
Fig. 5
Painting cross-sections. Samples from the painting were extracted where solvent was A applied by a swab with no mechanical action, B applied by a swab with mechanical action, and C not applied to leave the varnish intact. The left three columns show the intensity-weighted fractional contributions. The representative global three-exponential fluorescence lifetimes are shown in the bottom right corner of each inset. The ranges of the fractional contributions and the false-colour scales are underneath each inset. The fourth column shows the UV-excited broadband visible fluorescence images of the cross-sections. The rightmost column shows dark-field reflectance images with the labels and arrows pointing to the different painting layers. 1 is the embedding resin, 2 is the varnish, 3 is the paint, and 4 is the ground. Scale bars 100 μm
Fig. 6
Fig. 6
Natural resin varnish samples. A dammar and B mastic resin-based varnish samples following ambient ageing (Amb., top row) and accelerated ageing (Acc., bottom row) are displayed. Each row contains images of (i) intensity-weighted fluorescence lifetime fractional contributions, (ii) UV-excited broadband fluorescence intensity, and (iii) visible-light illumination photographs. The ranges of the fractional contributions and the false-colour scales are below each fractional contribution image. The characteristic global fluorescence lifetimes are in the top-right corners. A The visible rectangles are the consequence of historical varnish removal treatment. (i) Elliptical rings visible in the top-right quadrant result from the inhomogeneous illumination, which influences only the grey-scale intensity weighting and not the colour-scale fluorescence lifetime fractional contributions. (i, ii) Visible streaks are caused by variable varnish layer thickness due to its application by brush. Scale bar 5 mm
Fig. 7
Fig. 7
Photograph of the studied painting. The painting is dotted with varnish removal treatment areas, some of which are historical and others result of the work presented here
Fig. 8
Fig. 8
Representative fluorescence decays of varnish removal FLIM. The average fluorescence lifetime contrast images, same as in Fig. 2, are in the top row. Three example pixels representing varnish (blue line), paint (red line), and ground (yellow line) were marked by a cross (×), a plus (+), and a circle (), respectively. The fluorescence decays in these pixels are plotted in the graphs in the lower row. The IRF is shown in grey. The columns of the figure contain data taken after the following solvent application methods: A swab rolling with no mechanical action, B swab rolling with mechanical action, C gel application with no mechanical action, and D gel application with mechanical action. The fluorescence lifetime ranges and false-colour scales are in the top-left corner of each panel. Scale bars 2 mm
Fig. 9
Fig. 9
Phasor analysis separated varnish samples by their ageing conditions. Point clouds from phasor analysis of fluorescence intensity decays were produced for samples of A dammar and B mastic natural resin varnishes. Varnish aged under ambient conditions is shown in green and varnish undergoing accelerated ageing in brown. Points closer to the right end of the unity semicircle (accelerated ageing) correspond to shorter lifetimes. Points inside the unity circle (all) indicated multi-exponential fluorescence intensity decays. Plots were derived from the same data used in producing Fig. 6. g(ω) is the real part and s(ω) is the imaginary part of the Fourier transform of the fluorescence intensity decay in each pixel
Fig. 10
Fig. 10
Fractional contribution histograms of gradual varnish removal. A Fractional contribution histograms were created from the image data acquired during the gradual varnish removal done by solvent application using a swab without mechanical action. The top row shows three sets of histograms for each representative lifetime from the inside of the area of the image highlighted by the black line in B. The bottom row of histograms is from the outer control area, where no solvent was being applied. C, D Same as above, but done on the image data acquired during solvent application using a swab with mechanical action. All histograms were normalised to make their integrals equal to 1
Fig. 11
Fig. 11
Fractional contribution histograms separated varnish samples by their ageing conditions. A Fractional contribution histograms were created from the FLIM data of dammar varnish subject to ambient (red lines) or accelerated (blue lines) ageing conditions. The graph panels show the fractional contribution histograms for the three different representative lifetimes (top-right corner). The image on the right shows the fractional contribution contrast for the longest lifetime component. B The same as above, but based on the mastic varnish FLIM data. All histograms were normalised to make their integrals equal to 1

Similar articles

References

    1. Romani A, Clementi C, Miliani C, Favaro G. Fluorescence spectroscopy: a powerful technique for the noninvasive characterization of artwork. Accounts Chem Res. 2010;43(6):837–46. doi: 10.1021/ar900291y. - DOI - PubMed
    1. Berezin MY, Achilefu S. Fluorescence lifetime measurements and biological imaging. Chem Rev. 2010;210(7):2641–84. doi: 10.1021/cr900343z. - DOI - PMC - PubMed
    1. Becker W. Fluorescence lifetime imaging - techniques and applications. J Microsc. 2012;247(2):119–36. doi: 10.1111/j.1365-2818.2012.03618.x. - DOI - PubMed
    1. Nevin A, Cesaratto A, Bellei S, D’Andrea C, Toniolo L, Valentini G, et al. Time-resolved photoluminescence spectroscopy and imaging: new approaches to the analysis of cultural heritage and its degradation. Sensors. 2014;14(4):6338–55. doi: 10.3390/s140406338. - DOI - PMC - PubMed
    1. Suhling K, Hirvonen LM, Levitt JA, Chung PH, Tregidgo C, Le Marois A, et al. Fluorescence lifetime imaging (FLIM): basic concepts and some recent developments. Med Photonics. 2015;27:3–40. doi: 10.1016/j.medpho.2014.12.001. - DOI

LinkOut - more resources