. 2023 Jun 2:13:1181660.
doi: 10.3389/fonc.2023.1181660. eCollection 2023.

NF-κB fingerprinting reveals heterogeneous NF-κB composition in diffuse large B-cell lymphoma

Affiliations

NF-κB fingerprinting reveals heterogeneous NF-κB composition in diffuse large B-cell lymphoma

Eleanor Jayawant et al. Front Oncol. .

Abstract

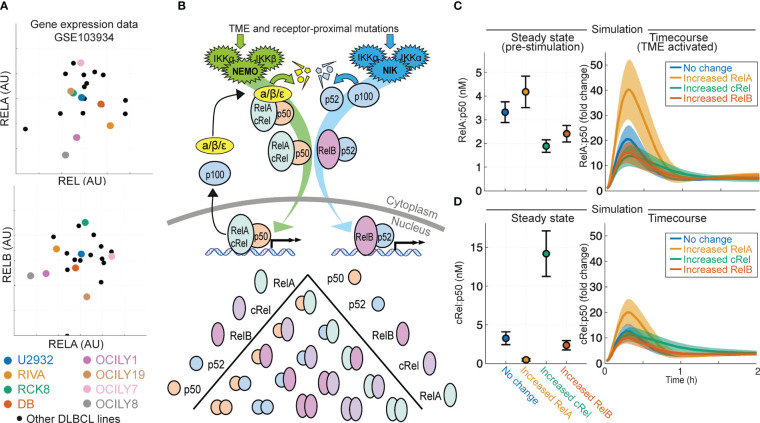
Introduction: Improving treatments for Diffuse Large B-Cell Lymphoma (DLBCL) is challenged by the vast heterogeneity of the disease. Nuclear factor-κB (NF-κB) is frequently aberrantly activated in DLBCL. Transcriptionally active NF-κB is a dimer containing either RelA, RelB or cRel, but the variability in the composition of NF-κB between and within DLBCL cell populations is not known.

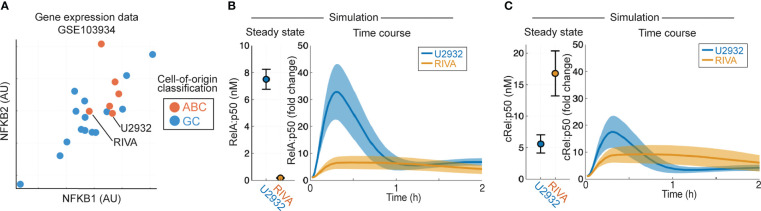
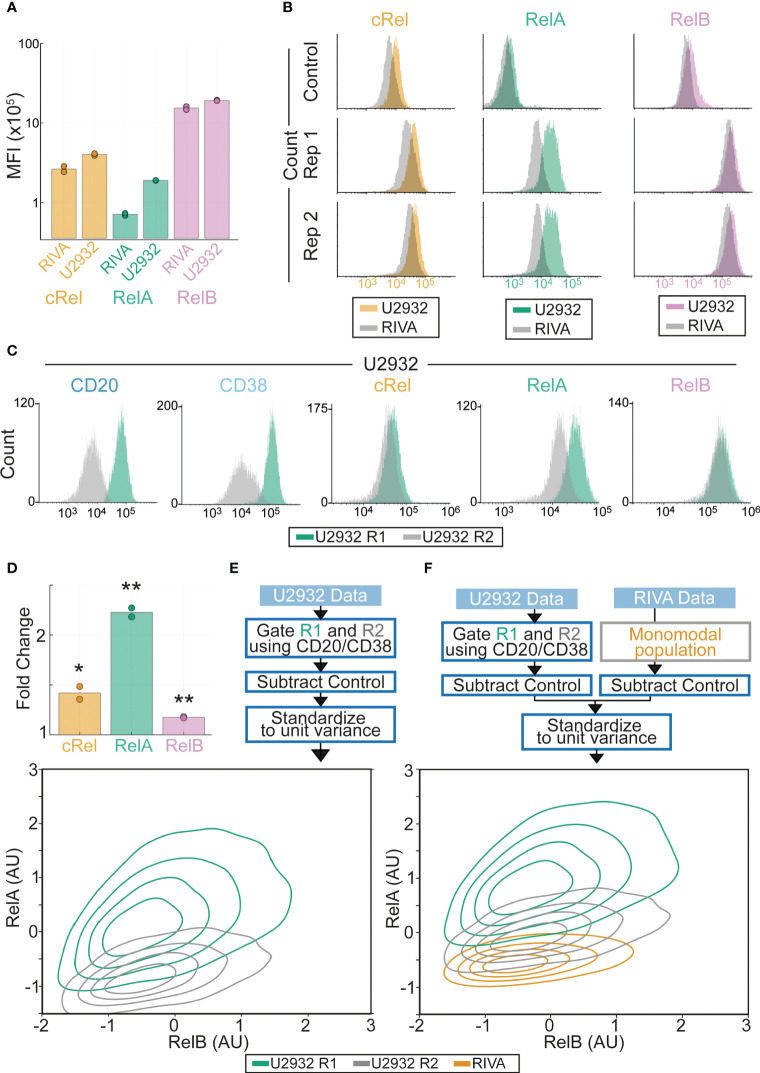
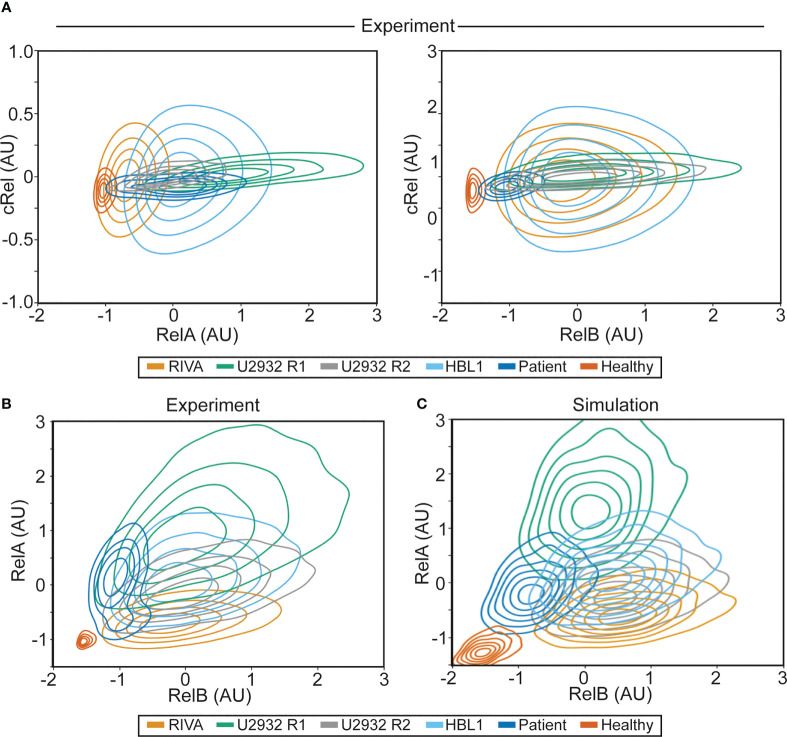
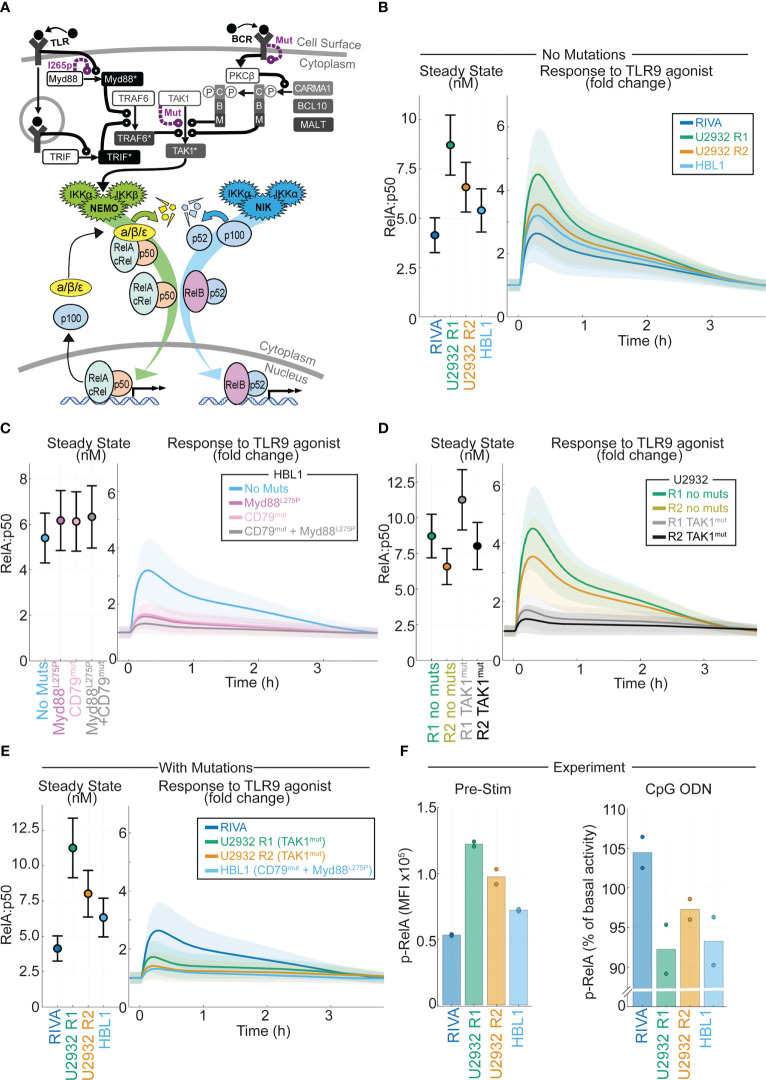
Results: Here we describe a new flow cytometry-based analysis technique termed "NF-κB fingerprinting" and demonstrate its applicability to DLBCL cell lines, DLBCL core-needle biopsy samples, and healthy donor blood samples. We find each of these cell populations has a unique NF-κB fingerprint and that widely used cell-of-origin classifications are inadequate to capture NF-κB heterogeneity in DLBCL. Computational modeling predicts that RelA is a key determinant of response to microenvironmental stimuli, and we experimentally identify substantial variability in RelA between and within ABC-DLBCL cell lines. We find that when we incorporate NF-κB fingerprints and mutational information into computational models we can predict how heterogeneous DLBCL cell populations respond to microenvironmental stimuli, and we validate these predictions experimentally.

Discussion: Our results show that the composition of NF-κB is highly heterogeneous in DLBCL and predictive of how DLBCL cells will respond to microenvironmental stimuli. We find that commonly occurring mutations in the NF-κB signaling pathway reduce DLBCL's response to microenvironmental stimuli. NF-κB fingerprinting is a widely applicable analysis technique to quantify NF-κB heterogeneity in B cell malignancies that reveals functionally significant differences in NF-κB composition within and between cell populations.

Keywords: DLCBL; NFkB; TME (tumor microenvironment); computational biology; lymphoma; math modeling; systems biology.


Conflict of interest statement

The authors declare that the research was conducted in the absence of any commercial or financial relationships that could be construed as a potential conflict of interest.

Figures

Figure 1
Figure 1
Computational modeling predicts that expression of NF-κB subunit RelA determines response to the tumor microenvironment in DLBCL. (A) Expression of RELA (encoding RelA), REL (encoding cRel) and RELB (encoding RelB) in published gene expression data (GSE103934) for a library of DLBCL cell lines (53). Some well-studied cell lines are highlighted with distinct colors. (B) Schematic of the scope of the computational model used here (54), which includes both canonical and non-canonical NF-κB signaling and dimer formation between 5 NF-κB component proteins. (C, D) Nuclear RelA:p50 (C) and cRel:p50 (D) concentration in computational simulations using model with no change in parameters, and a 10-fold increase in RelA, cRel and RelB expression. Steady state abundances are shown on the left, with time course responses to TME activation shown on the right. Mean and standard deviation of 25 single cell simulations is indicated.
Figure 2
Figure 2
Computational modeling predicts that DLBCL cell lines of the same cell of origin have distinct basal RelA activity. (A) Expression of NFKB1 (encoding p105/p50) and NFKB2 (encoding p100/p52) in published gene expression data (GSE103934) for a library of DLBCL cell lines (53). ABC/GC-DLBCL is indicated in red and blue respectively. (B, C) Nuclear RelA:p50 (B) and cRel:p50 (C) concentration in computational simulations using gene expression values to scale the expression of NF-κB components and create cell line-specific models. Steady state abundances are shown on the left, with TME-activated time course responses shown on the right. Mean and standard deviation of 25 single cell simulations is indicated.
Figure 3
Figure 3
Flow cytometry-based NF-κB fingerprinting reveals unique NF-κB signaling states in subclones of the U2932 cell lines and between ABC-DLBCL cell lines. (A) Median Fluorescence Intensity (MFI) of NF-κB components cRel (orange), RelA (green) and RelB (pink) in U2932 and RIVA cell line measured by flow cytometry. (B) Histograms of NF-κB components cRel, RelA and RelB in U2932 (color) DLBCL cell line compared to RIVA (gray) DLBCL cell line. Control indicates isotype control. Histograms are normalized to equal peak height. (C) Flow cytometry histograms for the indicated proteins in the U2932 R1 and R2 subclones as determined by gating CD38hi/CD20hi compared to CD38lo/CD20lo respectively. (D) Fold change in MFI of the indicated NF-κB components between the U2932 R1 and R2 subclones identified as CD20hi (R1) and CD20lo (R2). Mean of two replicates is shown with individual experiments indicated with a dot. * = p<0.05, **=p<0.01 (E) NF-κB fingerprinting approach (above) and contour plot (below) for U2932 cell line. Cell density is indicated with a contour plot with the R1 subclone in green and R2 subclone in yellow. (F) Same as (E) but with the inclusion of data from the RIVA cell line.
Figure 4
Figure 4
NF-κB fingerprinting can be applied to cell lines, DLBCL patient samples and healthy blood and reveals a unique NF-κB state in each cell population. (A) Experimentally measured NF-κB fingerprinting based on RelA and cRel abundance (left), and cRel and RelB abundance (right). Cell density is indicated with a contour plot and each cell population is shown in distinct colors. (B) Experimentally measured NF-κB fingerprinting based on RelA and RelB abundance. Cell density is indicated with a contour plot and each cell population is shown in distinct colors. (C) Computationally simulated NF-κB fingerprints in six cell population specific computational simulations informed by experimental NF-κB fingerprinting (B). 1,000 cells were simulated in each cell population (6,000 simulations in total), with cell-to-cell variability incorporated as described previously (32), cell density is indicated with a contour plot and each cell population is shown in distinct colors.
Figure 5
Figure 5
Computational modeling of DLBCL, including receptor-proximal signaling, enables integration of NF-kB fingerprints and mutational data to predict response to the tumor microenvironment. (A) Schematic of the computational model constructed by combining existing models of TLR signaling (55), BCR signaling (37), and NF-kB/IkB regulation (54). All models are run as published with active IKK species summed from the BCR and TLR models to determine the active IKK input curve to the NF-kB model. Schematic combines some repeated species, a more detailed schematic is included in Figure S3. (B) Cell line specific simulations of nuclear RelA:p50 in each virtual cell line at steady state (left) and the fold change in nuclear RelA:p50 in response to stimuli (right). Mean and standard deviation of 25 single cell simulations is indicated. (C) Simulated abundance of nuclear RelA:p50 in virtual HBL1 cell line with no changes (blue), with auto-activating Myd88 to recapitulate MYD88l265p (purple), and with high basal BCR signaling to recapitulate CD79B mutations present in this cell line (pink), and the combination of the two mutations (grey). Mean and standard deviation of 25 single cell simulations is indicated. (D) Simulated nuclear RelA:p50 in virtual U2932 cell line with no changes (R1 green, R2 yellow), with increased TAK1 activity recapitulate the TAK1 mutation present in this cell line (R1 grey, R2 black). Mean and standard deviation of 25 single cell simulations is indicated. (E) Cell line specific simulations of nuclear RelA:p50 in each virtual cell line at steady state (left) and the fold change in nuclear RelA:p50 in response to stimuli (right), with mutational event included from panels (C, D). Mean and standard deviation of 25 single cell simulations is indicated. (F) Experimentally measured median fluorescence intensity (MFI) of phosphorylated RelA in each indicated cell line. The mean of two replicates is shown with individual experiments indicated with a dot. The unstimulated MFI is shown (left) with the percentage change in MFI following 45 mins of activation of TLR9 with CpG ODN shown (right).

Similar articles

Cited by

References

    1. Smith A, Crouch S, Lax S, Li J, Painter D, Howell D, et al. . Lymphoma incidence, survival and prevalence 2004–2014: sub-type analyses from the UK’s haematological malignancy research network. Br J Cancer (2015) 112(9):1575–84. doi: 10.1038/bjc.2015.94 - DOI - PMC - PubMed
    1. Wright GW, Huang DW, Phelan JD, Coulibaly ZA, Roulland S, Young RM, et al. . A probabilistic classification tool for genetic subtypes of diffuse Large b cell lymphoma with therapeutic implications. Cancer Cell (2020) 37(4):551–68.e14. doi: 10.1016/j.ccell.2020.03.015 - DOI - PMC - PubMed
    1. Alizadeh AA, Eisen MB, Davis RE, Ma C, Lossos IS, Rosenwald A, et al. . Distinct types of diffuse large b-cell lymphoma identified by gene expression profiling. Nature (2000) 403(6769):503–11. doi: 10.1038/35000501 - DOI - PubMed
    1. Schmitz R, Wright GW, Huang DW, Johnson CA, Phelan JD, Wang JQ, et al. . Genetics and pathogenesis of diffuse large b-cell lymphoma. New Engl J Med (2018) 378(15):1396–407. doi: 10.1056/NEJMoa1801445 - DOI - PMC - PubMed
    1. Chapuy B, Stewart C, Dunford AJ, Kim J, Kamburov A, Redd RA, et al. . Molecular subtypes of diffuse large b cell lymphoma are associated with distinct pathogenic mechanisms and outcomes. Nat Med (2018) 24(5):679. doi: 10.1038/s41591-018-0016-8 - DOI - PMC - PubMed

LinkOut - more resources