Evaluating whole HIV-1 genome sequence for estimation of incidence and migration in a rural South African community
- PMID: 37333843
- PMCID: PMC10276198
- DOI: 10.12688/wellcomeopenres.17891.1
Evaluating whole HIV-1 genome sequence for estimation of incidence and migration in a rural South African community
Abstract
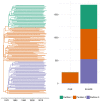
Background: South Africa has the largest number of people living with HIV (PLWHIV) in the world, with HIV prevalence and transmission patterns varying greatly between provinces. Transmission between regions is still poorly understood, but phylodynamics of HIV-1 evolution can reveal how many infections are attributable to contacts outside a given community. We analysed whole genome HIV-1 genetic sequences to estimate incidence and the proportion of transmissions between communities in Hlabisa, a rural South African community. Methods: We separately analysed HIV-1 for gag, pol, and env genes sampled from 2,503 PLWHIV. We estimated time-scaled phylogenies by maximum likelihood under a molecular clock model. Phylodynamic models were fitted to time-scaled trees to estimate transmission rates, effective number of infections, incidence through time, and the proportion of infections imported to Hlabisa. We also partitioned time-scaled phylogenies with significantly different distributions of coalescent times. Results: Phylodynamic analyses showed similar trends in epidemic growth rates between 1980 and 1990. Model-based estimates of incidence and effective number of infections were consistent across genes. Parameter estimates with gag were generally smaller than those estimated with pol and env. When estimating the proportions of new infections in Hlabisa from immigration or transmission from external sources, our posterior median estimates were 85% (95% credible interval (CI) = 78%-92%) for gag, 62% (CI = 40%-78%) for pol, and 77% (CI = 58%-90%) for env in 2015. Analysis of phylogenetic partitions by gene showed that most close global reference sequences clustered within a single partition. This suggests local evolving epidemics or potential unmeasured heterogeneity in the population. Conclusions: We estimated consistent epidemic dynamic trends for gag, pol and env genes using phylodynamic models. There was a high probability that new infections were not attributable to endogenous transmission within Hlabisa, suggesting high inter-connectedness between communities in rural South Africa.
Keywords: HIV; phylodynamics.
Copyright: © 2022 Nascimento FF et al.
Conflict of interest statement
No competing interests were disclosed.
Figures


References
-
- Benjamini Y, Hochberg Y: Controlling the false discovery rate: A practical and powerful approach to multiple testing. J R Stat Soc Series B. 1995;57(1):289–300. 10.1111/j.2517-6161.1995.tb02031.x - DOI
Grants and funding
LinkOut - more resources
Full Text Sources

