

Neurometabolic and structural alterations of medial septum and hippocampal CA1 in a model of post-operative sleep fragmentation in aged mice: a study combining 1H-MRS and DTI
- PMID: 37333891
- PMCID: PMC10272368
- DOI: 10.3389/fncel.2023.1160761
Neurometabolic and structural alterations of medial septum and hippocampal CA1 in a model of post-operative sleep fragmentation in aged mice: a study combining 1H-MRS and DTI
Abstract
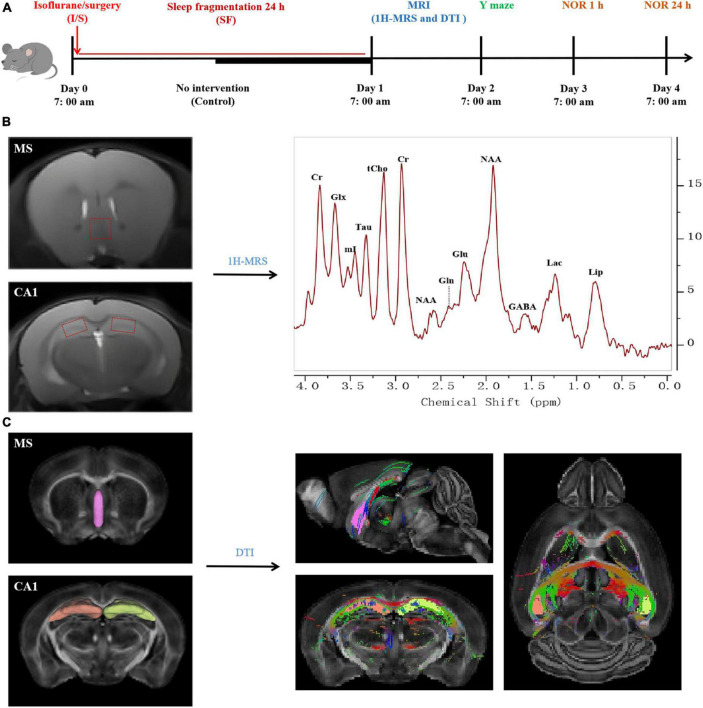
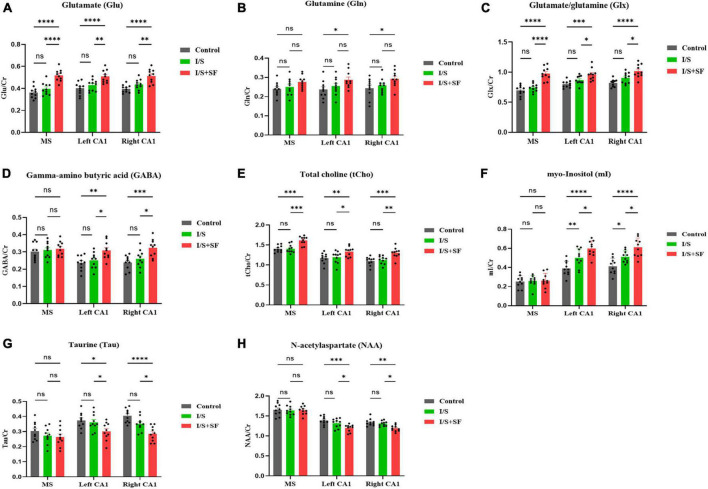
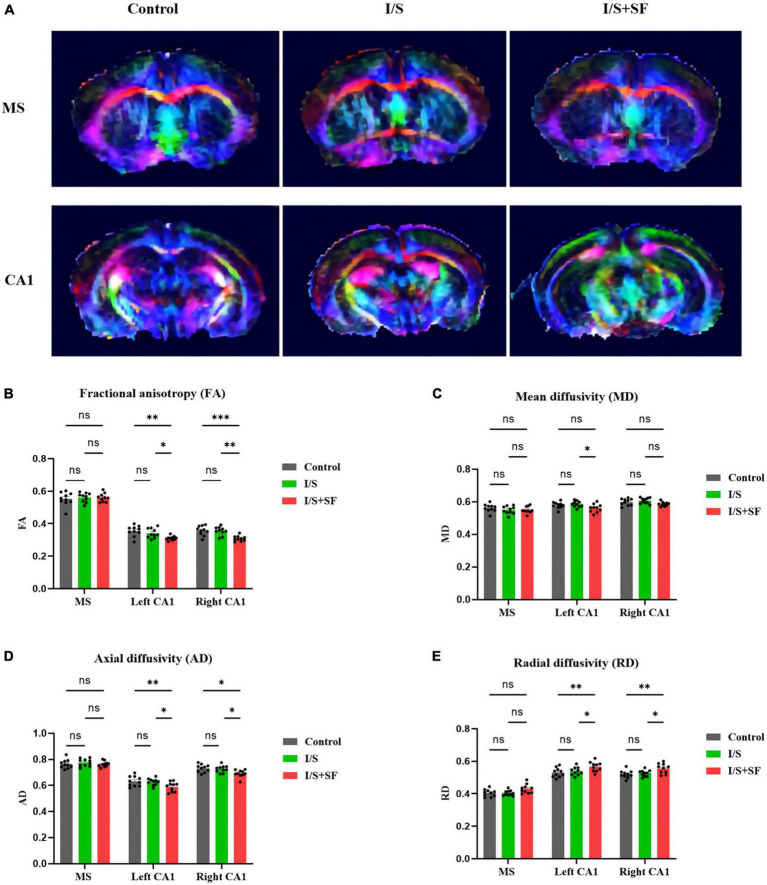
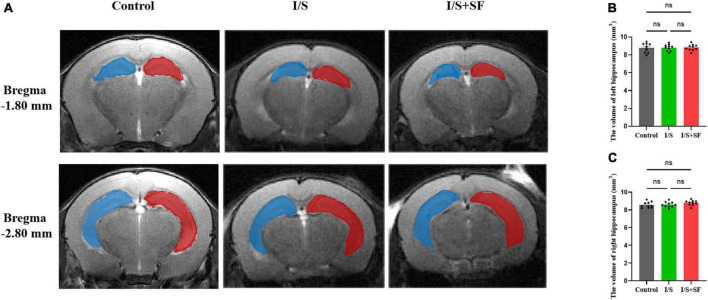
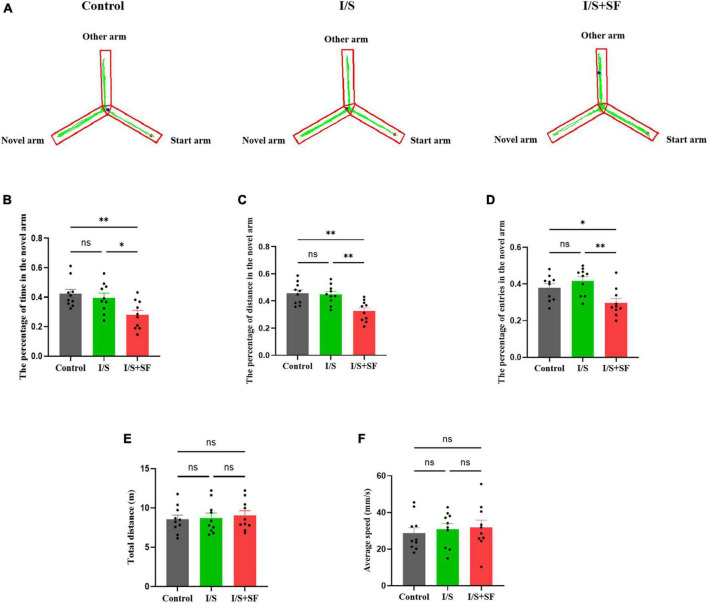
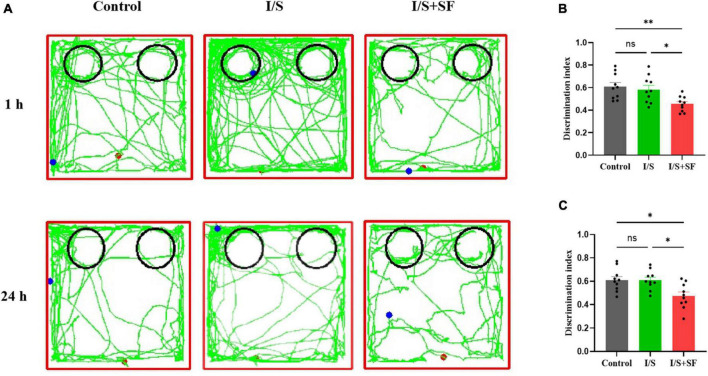
Post-operative sleep disturbance is a common feature of elderly surgical patients, and sleep fragmentation (SF) is closely related to post-operative cognitive dysfunction (POCD). SF is characterized by sleep interruption, increased number of awakenings and sleep structure destruction, similar to obstructive sleep apnea (OSA). Research shows that sleep interruption can change neurotransmitter metabolism and structural connectivity in sleep and cognitive brain regions, of which the medial septum and hippocampal CA1 are key brain regions connecting sleep and cognitive processes. Proton magnetic resonance spectroscopy (1H-MRS) is a non-invasive method for the evaluation of neurometabolic abnormalities. Diffusion tensor imaging (DTI) realizes the observation of structural integrity and connectivity of brain regions of interest in vivo. However, it is unclear whether post-operative SF induces harmful changes in neurotransmitters and structures of the key brain regions and their contribution to POCD. In this study, we evaluated the effects of post-operative SF on neurotransmitter metabolism and structural integrity of medial septum and hippocampal CA1 in aged C57BL/6J male mice. The animals received a 24-h SF procedure after isoflurane anesthesia and right carotid artery exposure surgery. 1H-MRS results showed after post-operative SF, the glutamate (Glu)/creatine (Cr) and glutamate + glutamine (Glx)/Cr ratios increased in the medial septum and hippocampal CA1, while the NAA/Cr ratio decreased in the hippocampal CA1. DTI results showed post-operative SF decreased the fractional anisotropy (FA) of white matter fibers in the hippocampal CA1, while the medial septum was not affected. Moreover, post-operative SF aggravated subsequent Y-maze and novel object recognition performances accompanied by abnormal enhancement of glutamatergic metabolism signal. This study suggests that 24-h SF induces hyperglutamate metabolism level and microstructural connectivity damage in sleep and cognitive brain regions in aged mice, which may be involved in the pathophysiological process of POCD.
Keywords: 1H-MRS; CA1; DTI; aging; hippocampus; medial septum; post-operative sleep disturbance; sleep fragmentation.
Copyright © 2023 Li, Zhao, Zhang, Shen, Li, Yu, Yu, Feng, Xie and Yu.
Conflict of interest statement
The authors declare that the research was conducted in the absence of any commercial or financial relationships that could be construed as a potential conflict of interest.
Figures
Similar articles
-
Alterations in hippocampal somatostatin interneurons, GABAergic metabolism, and ASL perfusion in an aged male mouse model of POCD aggravated by sleep fragmentation.Physiol Rep. 2024 Dec;12(23):e70153. doi: 10.14814/phy2.70153. Physiol Rep. 2024. PMID: 39648073 Free PMC article.
-
Preoperative recovery sleep ameliorates postoperative cognitive dysfunction aggravated by sleep fragmentation in aged mice by enhancing EEG delta-wave activity and LFP theta oscillation in hippocampal CA1.Brain Res Bull. 2024 Jun 1;211:110945. doi: 10.1016/j.brainresbull.2024.110945. Epub 2024 Apr 10. Brain Res Bull. 2024. PMID: 38608544
-
Correlations between Diffusion Tensor Imaging (DTI) and Magnetic Resonance Spectroscopy (1H MRS) in schizophrenic patients and normal controls.BMC Psychiatry. 2007 Jun 19;7:25. doi: 10.1186/1471-244X-7-25. BMC Psychiatry. 2007. PMID: 17578565 Free PMC article.
-
[In-vivo analysis for human brain maturation using MRI].Rinsho Shinkeigaku. 2013;53(11):1100-3. doi: 10.5692/clinicalneurol.53.1100. Rinsho Shinkeigaku. 2013. PMID: 24291891 Review. Japanese.
-
The role of diffusion tensor imaging and fractional anisotropy in the evaluation of patients with idiopathic normal pressure hydrocephalus: a literature review.Neurosurg Focus. 2016 Sep;41(3):E12. doi: 10.3171/2016.6.FOCUS16192. Neurosurg Focus. 2016. PMID: 27581308 Review.
Cited by
-
Preoperative Sleep Deprivation Exacerbates Anesthesia/Surgery-induced Abnormal GABAergic Neurotransmission and Neuronal Damage in the Hippocampus in Aged Mice.Mol Neurobiol. 2025 Jul;62(7):9385-9398. doi: 10.1007/s12035-025-04851-3. Epub 2025 Mar 19. Mol Neurobiol. 2025. PMID: 40106167
-
Alterations in hippocampal somatostatin interneurons, GABAergic metabolism, and ASL perfusion in an aged male mouse model of POCD aggravated by sleep fragmentation.Physiol Rep. 2024 Dec;12(23):e70153. doi: 10.14814/phy2.70153. Physiol Rep. 2024. PMID: 39648073 Free PMC article.
References
LinkOut - more resources
Full Text Sources
Miscellaneous