. 2023 Jun 16:6:0175.
doi: 10.34133/research.0175. eCollection 2023.

LonP1 Links Mitochondria-ER Interaction to Regulate Heart Function

Affiliations

LonP1 Links Mitochondria-ER Interaction to Regulate Heart Function

Yujie Li et al. Research (Wash D C). .

Abstract

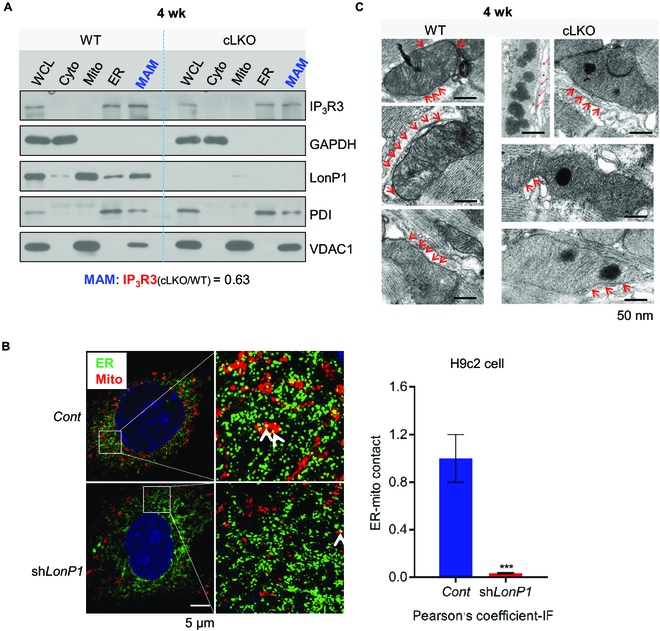
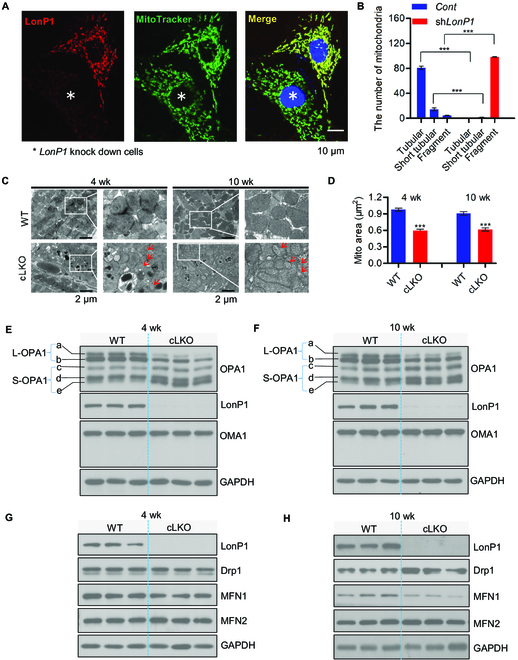
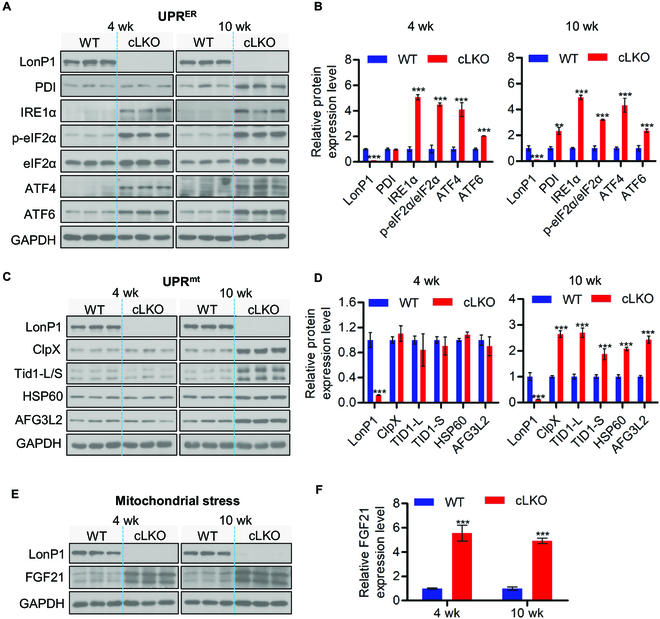
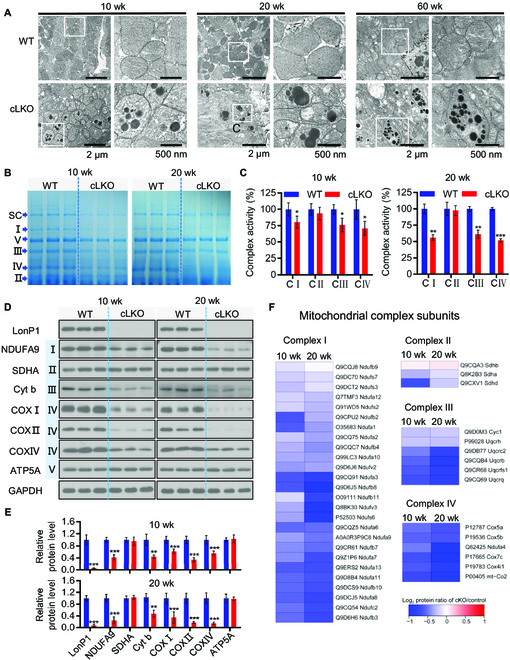
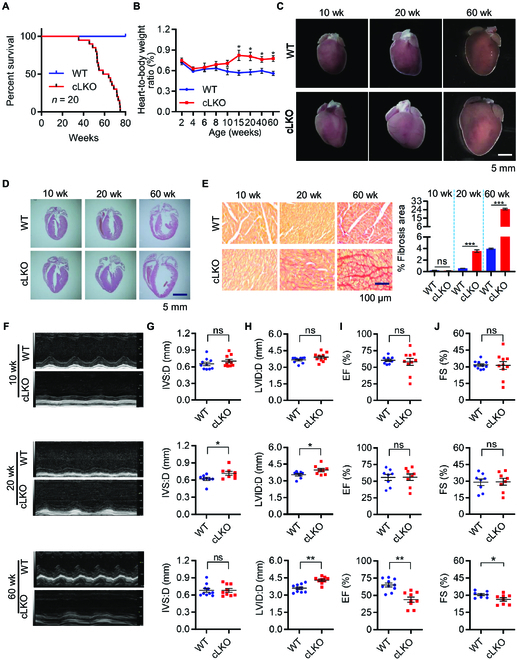
Interorganelle contacts and communications are increasingly recognized to play a vital role in cellular function and homeostasis. In particular, the mitochondria-endoplasmic reticulum (ER) membrane contact site (MAM) is known to regulate ion and lipid transfer, as well as signaling and organelle dynamics. However, the regulatory mechanisms of MAM formation and their function are still elusive. Here, we identify mitochondrial Lon protease (LonP1), a highly conserved mitochondrial matrix protease, as a new MAM tethering protein. The removal of LonP1 substantially reduces MAM formation and causes mitochondrial fragmentation. Furthermore, deletion of LonP1 in the cardiomyocytes of mouse heart impairs MAM integrity and mitochondrial fusion and activates the unfolded protein response within the ER (UPRER). Consequently, cardiac-specific LonP1 deficiency causes aberrant metabolic reprogramming and pathological heart remodeling. These findings demonstrate that LonP1 is a novel MAM-localized protein orchestrating MAM integrity, mitochondrial dynamics, and UPRER, offering exciting new insights into the potential therapeutic strategy for heart failure.


Figures

Fig. 1.
Fig. 1.
LonP1 deletion impairs MAMs. (A) Western blot analysis of the LonP1 protein level in homogenate (WCL), cytosolic (Cyto), mitochondria (Mito), ER, and MAM fractions in 4-week-old LonP1-deficient heart. VDAC1 was used as a mitochondrial marker, PDI was used as an ER marker, and IP3R3 was used as a marker of MAM. (B) Subcellular localization of ER and mitochondria in control and LonP1 knockdown H9c2 cells. Representative images show colocalization of mitochondria (MitoTracker Red) and the ER marker protein PDI (green). Scale bar, 5 μm. The amount of ER colocalizing with mitochondria is represented by Pearson’s correlation coefficient. Data are represented as means ± SEM (n = 3, ***P < 0.001). (C) Representative TEM images indicating the ER and mitochondrial contacts in the hearts of 4-week-old cLKO mice and their littermate controls. Arrows indicate the contacts between ER and mitochondria. Scale bars, 50 nm. See also Fig. S1. IF, immunofluorescence.
Fig. 2.
Fig. 2.
LonP1 deficiency leads to mitochondrial fragmentation. (A) The LonP1 protein levels and mitochondrial morphologies in control and LonP1 knockdown H9c2 cells were investigated by immunofluorescence with specific LonP1 antibody and MitoTracker Green. Representative confocal microscopy images are shown. Scale bar, 10 μm. Data are presented as means ± SEM (n = 3, ***P < 0.001). (B) Mitochondrial morphologies described in (A) were counted according to the criteria detailed in the Fluorescence detection in cultured cells section. (C) Representative TEM images of 4- and 10-week-old cLKO and WT hearts. Arrows indicate mitochondria with typical morphology. Scale bars, 2 μm. (D) The mitochondrial area of TEM images in (C) was quantified by ImageJ. Data are represented as means ± SEM (n = 3, ***P < 0.001). (E and F) Western blot analysis of OPA1, OMA1, and LonP1 protein levels in the heart tissue of 4-week-old (E) and 10-week-old (F) cLKO mice and WT mice. GAPDH was used as a loading control. (G and H) Western blot analysis of Drp1, MFN1, MFN2, and LonP1 protein levels in the heart tissue of 4-week-old (G) and 10-week-old (H) WT and cLKO mice. GAPDH was used as a loading control. See also Figs. S2 and S3.
Fig. 3.
Fig. 3.
Deletion of LonP1 induces UPRER and UPRmt. (A and B) Western blot analysis (A) and quantification (B) of ER stress proteins PDI, IRE1α, p-eIF2α, ATF4, and ATF6 in WT and cLKO hearts at 4 and 10 weeks of age. GAPDH was used as a loading control. Data are presented as means ± SEM (n = 3, **P < 0.01 and ***P < 0.001). (C and D) Western blot analysis (C) and quantification (D) of LonP1 and the UPRmt related proteins ClpX, Tid1-L/S, HSP60, and AFG3L2 in WT and cLKO hearts at 4 and 10 weeks of age. GAPDH was used as a loading control. Data are represented as means ± SEM (n = 3, ***P < 0.001). (E and F) Western blot analysis and quantification of the mitochondrial stress marker FGF21 protein level in WT and cLKO hearts at 4 and 10 weeks of age. GAPDH was used as a loading control. Data are represented as means ± SEM (n = 3, ***P < 0.001). See also Fig. S4
Fig. 4.
Fig. 4.
Cardiomyocyte-specific deletion of LonP1 leads to abnormal mitochondrial morphology and dysfunction. (A) TEM of 10-, 20-, and 60-week-old WT and cLKO hearts. Scale bars, 2 μm and 500 nm, respectively. (B) Coomassie Brilliant Blue staining of BN-PAGE with indicated positions and quantifications of SC (mitochondrial respiratory chain supercomplex), specific complexes I to V of WT and cLKO hearts at 10 and 20 weeks of age. (C) Enzymatic activity of complexes I to IV (C I to C IV) of the mitochondrial electron transport chain from the heart tissue of 10- and 20-week-old WT and cLKO mice. Data are represented as means ± SEM (n = 3, *P < 0.05, **P < 0.01, and ***P < 0.001). (D and E) Western blot analysis (D) and quantification by ImageJ (E) of protein levels for representative electron transport chain complex subunits from the heart tissue of 10- and 20-week-old WT and cLKO mice. GAPDH was used as the loading control. Data are represented as means ± SEM (n = 3, **P < 0.01 and ***P < 0.001). (F) Heatmap showing protein abundance changes in the subunits of complexes I to IV obtained via high-throughput quantitative proteomics of enriched mitochondrial preparations. The relative abundance changes in WT and cLKO mice are presented using the protein ratio in relation to each control at 10 and 20 weeks of age.
Fig. 5.
Fig. 5.
Loss of LonP1 in cardiomyocytes leads to metabolic reprogramming through enhancing glycogenesis and amino acid metabolism. (A) Western blot analysis demonstrating LonP1 stable knockdown in H9c2 cells. (B) LonP1 stable knockdown increases intracellular ROS (H2O2) production in H9c2 cells, as measured using ROS assay kit (DCFH-DA). Data are plotted as percentages of increase in the MFI and are shown as means ± SEM (n = 3, ***P < 0.001). (C) Mitochondrial superoxide levels of control and LonP1 knockdown stable H9c2 cells were detected by MitoSOX staining and analyzed by flow cytometry. Data are plotted as percentages of alteration of the MFI and are shown as means ± SEM (n = 3, ***P < 0.001). (D) LonP1 stable knockdown reduces the mitochondrial membrane potential of H9c2 cells. Cells were stained with JC-1 and analyzed by flow cytometry. The ratio of fluorescence intensities Ex/Em = 490/590 and 490/530 nm (FL590/FL530) were recorded to show the mitochondrial membrane potential level of each sample. Data are presented as means ± SEM (n = 3, ***P < 0.001). (E and F) The intact cellular OCR of H9c2 cells in the indicated conditions were measured in real time using the Seahorse XF-96 Extracellular Flux Analyzer. Basal OCRs were measured at 3 time points, followed by sequential injection of the ATP synthase inhibitor oligomycin (1 μM), the uncoupler carbonyl cyanide p-trifluoromethoxyphenylhydrazone (1 μM), the complex I inhibitor rotenone (1 μM), and the complex III inhibitor antimycin A (1 μM). Data are represented as means ± SEM (***P < 0.001). (G) Heatmap showing protein abundance changes in some proteins involved in gluconeogenesis, aspartate and glutamate metabolism, and the biosynthesis of amino acids obtained via high-throughput quantitative proteomics of enriched heart tissues. The relative abundance changes in WT and cLKO mice are expressed using the protein ratio in relation to each control at 10 and 20 weeks of age. (H and I) Western blot and quantification of representative protein levels of ATF4 and PCK2 in WT and cLKO hearts at 4 and 10 weeks, using GAPDH as the loading control. Data are represented as means ± SEM (n = 3, ***P < 0.001). (J) qRT-PCR analysis the transcripts of Suclg2, Pck2, Gls, Phgdh, and Psat1 in WT and cLKO hearts at 10 weeks. Data are represented as means ± SEM (n = 3, *P < 0.05, **P < 0.01, and ***P < 0.001).
Fig. 6.
Fig. 6.
Cardiomyocyte-specific deletion of LonP1 causes pathological heart remodeling and impaired heart function. (A) Kaplan–Meier survival curves in WT and cLKO mice (n = 20). (B) Heart weight-to-body weight ratios in WT and cLKO mice of 2, 4, 6, 8, 10, 15, 20, 40, and 60 weeks of age (n = 6, *P < 0.05). (C) Heart morphologies of 10-, 20-, and 60-week-old WT and cLKO mice. (D) Hematoxylin and eosin staining of WT and cLKO hearts of 10-, 20-, and 60-week-old cLKO and WT mice. (E) Representative images showing Sirius Red staining of the cardiac tissues from 10-, 20-, and 60-week-old cLKO mice and their littermate controls (left). Scale bars, 100 μm. Quantitative analysis of myocardial fibrosis in 10-, 20-, and 60-week-old WT and cLKO mice (right). Data are represented as means ± SEM (n = 3, ***P < 0.001). (F to J) Representative images of transthoracic M-mode echocardiographic tracings and echocardiographic parameters of 10-, 20-, and 60-week-old WT and cLKO mice. IVS:D, interventricular septal thickness; LVID:D, LV internal diameter in diastole; EF, ejection fraction; FS, LV fraction shortening. Data are represented as means ± SEM (n = 8 to 10, *P < 0.05 and **P < 0.01). See also Fig. S5.

References

    1. Wu H, Carvalho P, Voeltz GK. Here, there, and everywhere: The importance of ER membrane contact sites. Science. 2018;361(6401):eaan5835. - PMC - PubMed
    1. Valm AM, Cohen S, Legant WR, Melunis J, Hershberg U, Wait E, Cohen AR, Davidson MW, Betzig E, Lippincott-Schwartz J. Applying systems-level spectral imaging and analysis to reveal the organelle interactome. Nature. 2017;546:162–167. - PMC - PubMed
    1. Hoyer MJ, Chitwood PJ, Ebmeier CC, Striepen JF, Qi RZ, Old WM, Voeltz GK. A novel class of ER membrane proteins regulates ER-associated endosome fission. Cell. 2018;175:254–265.e14. - PMC - PubMed
    1. Phillips MJ, Voeltz GK. Structure and function of ER membrane contact sites with other organelles. Nat Rev Mol Cell Biol. 2016;17:69–82. - PMC - PubMed
    1. Pickett CB, Montisano D, Eisner D, Cascarano J. The physical association between rat liver mitochondria and rough endoplasmic reticulum. I. Isolation, electron microscopic examination and sedimentation equilibrium centrifugation analyses of rough endoplasmic reticulum-mitochondrial complexes. Exp Cell Res. 1980;128:343–352. - PubMed

LinkOut - more resources