. 2023 Jan 1;7(1):160-183.
doi: 10.1162/netn_a_00277. eCollection 2023.

Exploring personalized structural connectomics for moderate to severe traumatic brain injury

Affiliations

Exploring personalized structural connectomics for moderate to severe traumatic brain injury

Phoebe Imms et al. Netw Neurosci. .

Abstract

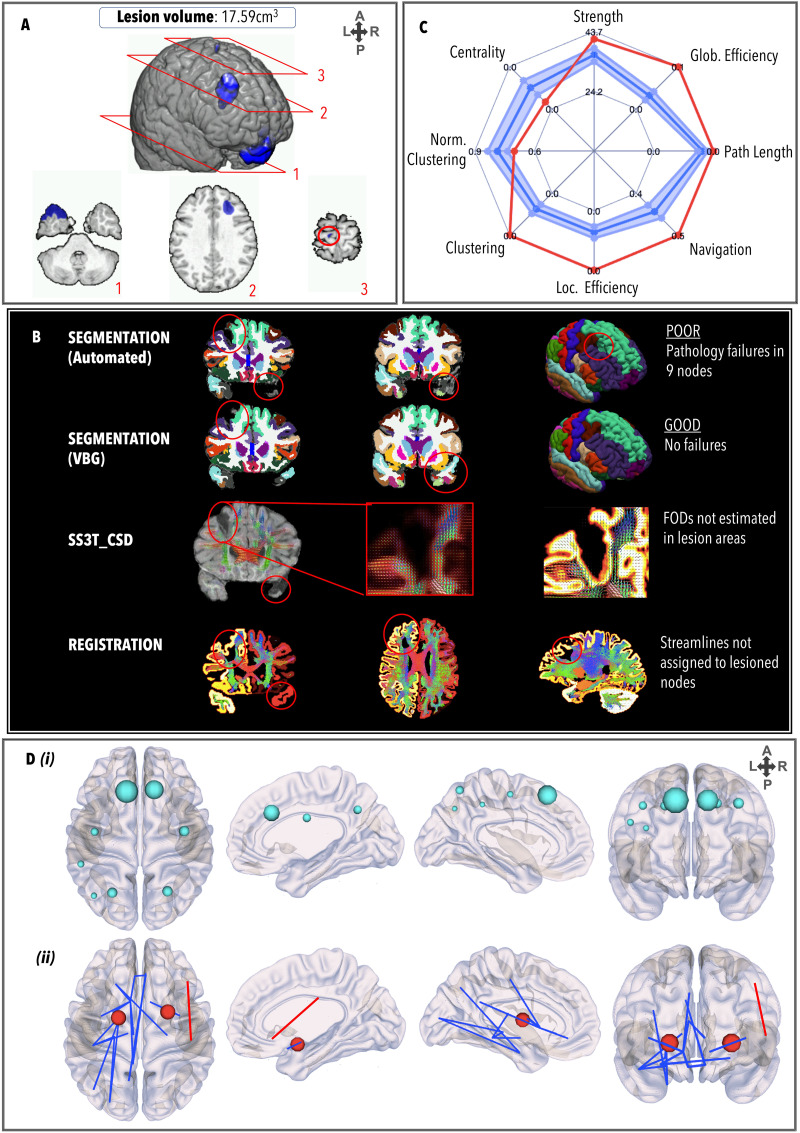
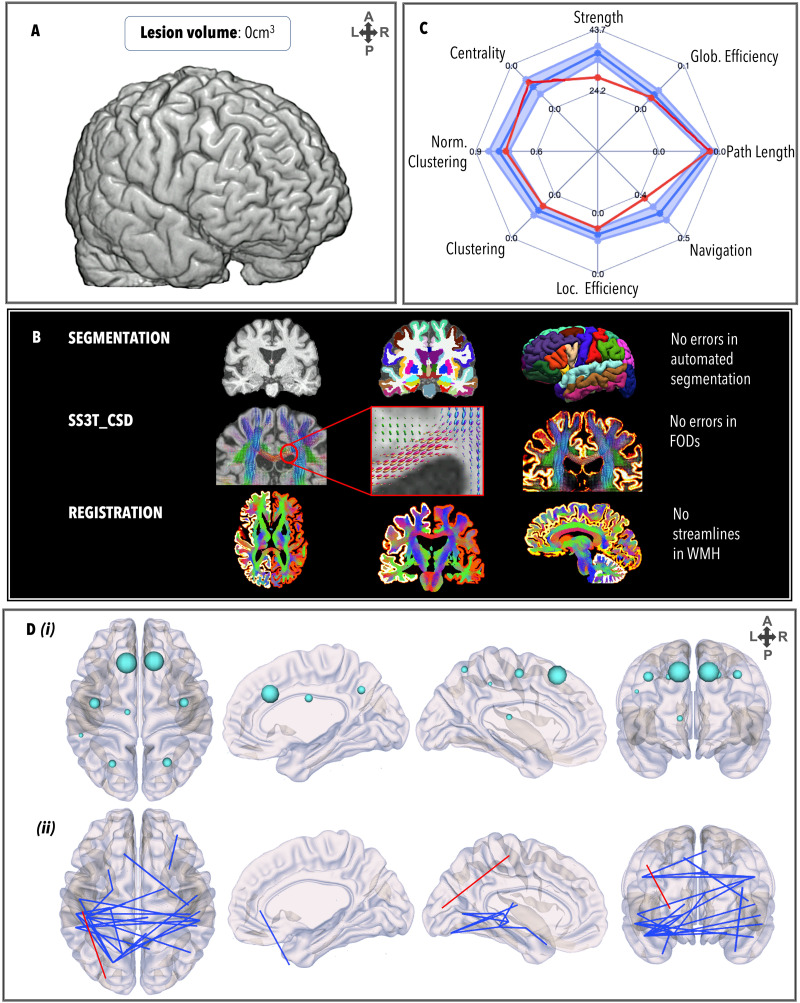
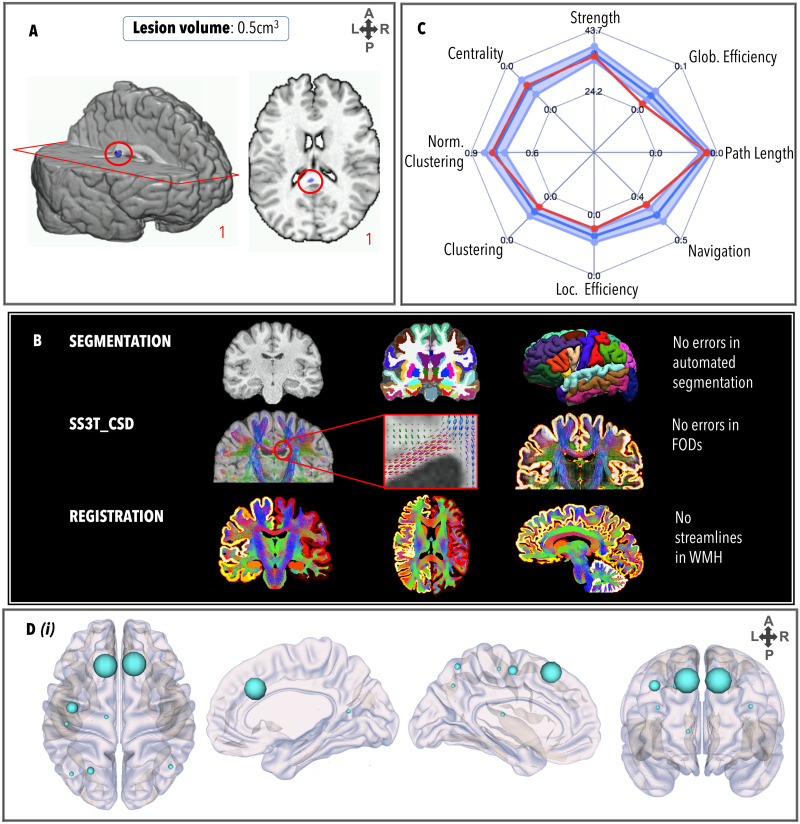
Graph theoretical analysis of the structural connectome has been employed successfully to characterize brain network alterations in patients with traumatic brain injury (TBI). However, heterogeneity in neuropathology is a well-known issue in the TBI population, such that group comparisons of patients against controls are confounded by within-group variability. Recently, novel single-subject profiling approaches have been developed to capture inter-patient heterogeneity. We present a personalized connectomics approach that examines structural brain alterations in five chronic patients with moderate to severe TBI who underwent anatomical and diffusion magnetic resonance imaging. We generated individualized profiles of lesion characteristics and network measures (including personalized graph metric GraphMe plots, and nodal and edge-based brain network alterations) and compared them against healthy reference cases (N = 12) to assess brain damage qualitatively and quantitatively at the individual level. Our findings revealed alterations of brain networks with high variability between patients. With validation and comparison to stratified, normative healthy control comparison cohorts, this approach could be used by clinicians to formulate a neuroscience-guided integrative rehabilitation program for TBI patients, and for designing personalized rehabilitation protocols based on their unique lesion load and connectome.

Keywords: Graph theory; Lesion filling; Personalized connectomics; Personalized medicine; Structural connectomics; Traumatic brain injury.


Figures

<b>Figure 1.</b>
Figure 1.
Overview of the processing pipeline for connectome mapping. (A) In the raw diffusion images, noise (Cordero-Grande et al., 2019; Veraart et al., 2016), Gibbs ringing artifacts (Kellner et al., 2016), as well as distortions induced by motion, eddy current artifacts, and EPI/susceptibility distortions were detected and corrected (Andersson et al., 2003; Andersson & Sotiropoulos, 2016). (B) Concurrently, T1 volumes were registered to diffusion volumes. The advanced normalization tools package (ANTS; Avants et al., 2009) was used to remove non-brain structures from the T1-weighted images for white matter extraction (Zhang et al., 2011). FSL FLIRT (Jenkinson et al., 2002; Jenkinson & Smith, 2001) was used to perform the boundary-based registration between brain-extracted anatomical and diffusion images. Registered images are provided to (i) 5ttgen (brain extracted), to create priors for anatomically constrained tractography (ACT), and (ii) FreeSurfer (non-brain extracted), to parcellate the nodes for the connectome analysis. All subcortical gray matter structures were segmented (Fischl et al., 2002); image intensity normalized (Sled et al., 1998); pial surfaces and the gray-white matter boundaries estimated (Dale et al., 1999); and the entire brain “inflated” to smooth the gyri and sulci (Fischl et al., 1999). (C) Lesion masks of subjects who failed the quality assessment after FreeSurfer parcellation were provided along with the T1 image to VBG. (D) Average response functions for white matter, gray matter, and cerebrospinal fluid were estimated from the dMRI data using an automated unsupervised approach (Dhollander et al., 2019; Dhollander et al., 2016). Preprocessed data were upsampled to a voxel size of 1.3 mm3 to assume higher spatial resolution for image registration before binary masks were created. Fiber orientation distributions (FODs) were estimated from the group average response functions on upsampled images, and corrected for intensity inhomogeneity and global intensity level differences (Raffelt et al., 2017). (E) Anatomically constrained tractography (ACT) was performed using the FODs from panel D and the 5ttgen images from panel B(i). The FOD cutoff threshold, step size, and angle were determined to attain a reasonable trade-off between false negatives and false positives (seed points = dynamic; maximum length = 250 mm; minimum length = 5 mm; step size = 1.25; angle = 45°; FOD amplitude = 0.08). Spherically informed filtering of tractograms (SIFT2) is applied to make the weight of the streamlines proportional to the underlying fiber orientation distribution. (F) The connectome is created using the FreeSurfer parcellation and the sifted tractogram.
<b>Figure 2.</b>
Figure 2.
Healthy control hubs (top 10% of nodes with highest betweenness centrality), in teal. Larger nodes represent higher values. Hubs (bilaterally) were the superior frontal gyrus (BCleft = 1,493; BCright = 1,533), superior parietal gyrus (BCleft = 610; BCright = 665), precentral gyrus (BCleft = 588; BCright = 616), and thalamus (BCleft = 336; BCright = 346). The strongest edges (0.5th percentile) are colored by strength (yellow = weaker; red = stronger). Visualization in NeuroMArVL (https://immersive.erc.monash.edu/neuromarvl/).
<b>Figure 3.</b>
Figure 3.
Personalized connectome profile for TBI1 including (A) lesion profile; (B) quality assessment; (C) radar plot showing the patient’s personalized connectome profile (red indicates patient’s scores, dark blue indicates healthy control average and the 95% CI is represented by the blue shade); and (D) (i) hub nodes (size indicates betweenness centrality value) and (ii) regional analysis (blue = edges/nodes lower than the healthy control average; red = edges/nodes stronger than the healthy control average).
<b>Figure 4.</b>
Figure 4.
Same as Figure 3, for TBI3.
<b>Figure 5.</b>
Figure 5.
Same as Figure 3, for TBI4.
<b>Figure 6.</b>
Figure 6.
Same as Figure 3, for TBI5.
<b>Figure 7.</b>
Figure 7.
Same as Figure 3, for TBI6.

Similar articles

Cited by

References

    1. Adams, J. H., Graham, D. I., Murray, L. S., & Scott, G. (1982). Diffuse axonal injury due to nonmissile head injury in humans: An analysis of 45 cases. Annuals of Neurology, 12(6), 557–563. 10.1002/ana.410120610, - DOI - PubMed
    1. Andersson, J. L. R., Skare, S., & Ashburner, J. (2003). How to correct susceptibility distortions in spin-echo echo-planar images: Application to diffusion tensor imaging. NeuroImage, 20(2), 870–888. 10.1016/S1053-8119(03)00336-7, - DOI - PubMed
    1. Andersson, J. L. R., & Sotiropoulos, S. N. (2016). An integrated approach to correction for off-resonance effects and subject movement in diffusion MR imaging. NeuroImage, 125, 1063–1078. 10.1016/j.neuroimage.2015.10.019, - DOI - PMC - PubMed
    1. Attyé, A., Renard, F., Baciu, M., Roger, E., Lamalle, L., Dehail, P., … Calamante, F. (2020). TractLearn: A geodesic learning framework for quantitative analysis of brain bundles. medRxiv. 10.1101/2020.05.27.20113027 - DOI - PubMed
    1. Avants, B. B., Tustison, N., & Song, G. (2009). Advanced normalization tools (ANTS). Insight Journal, 2(365), 1–35. 10.54294/uvnhin - DOI

LinkOut - more resources