. 2023 Jan 1;7(1):213-233.
doi: 10.1162/netn_a_00279. eCollection 2023.

Increased structural connectivity in high schizotypy

Affiliations

Increased structural connectivity in high schizotypy

Eirini Messaritaki et al. Netw Neurosci. .

Abstract

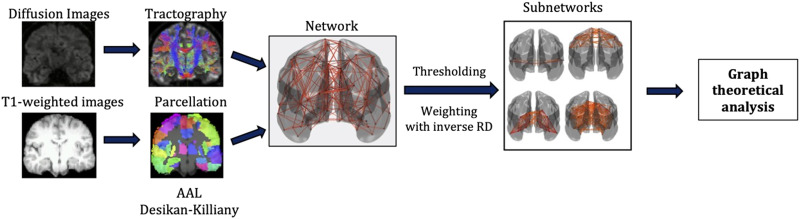
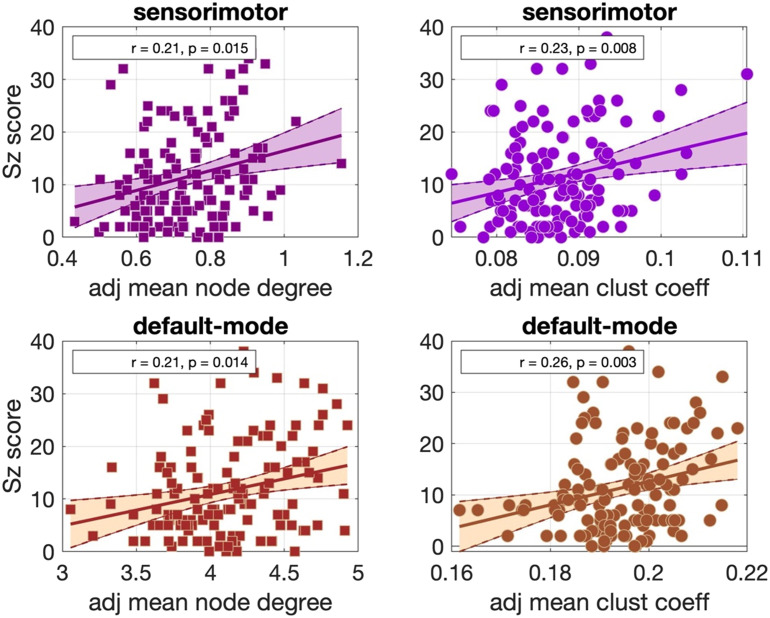
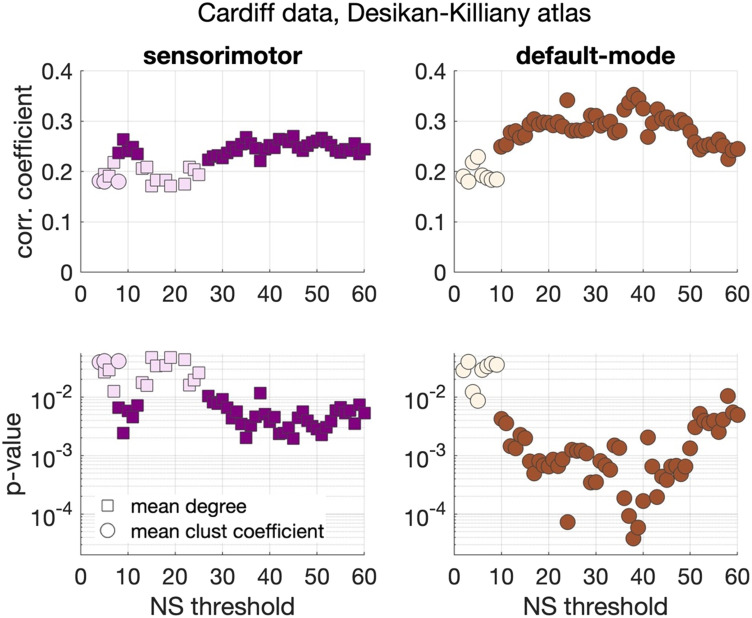
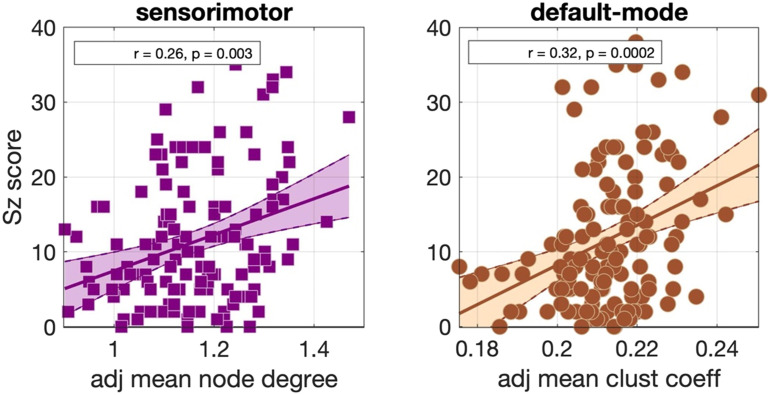
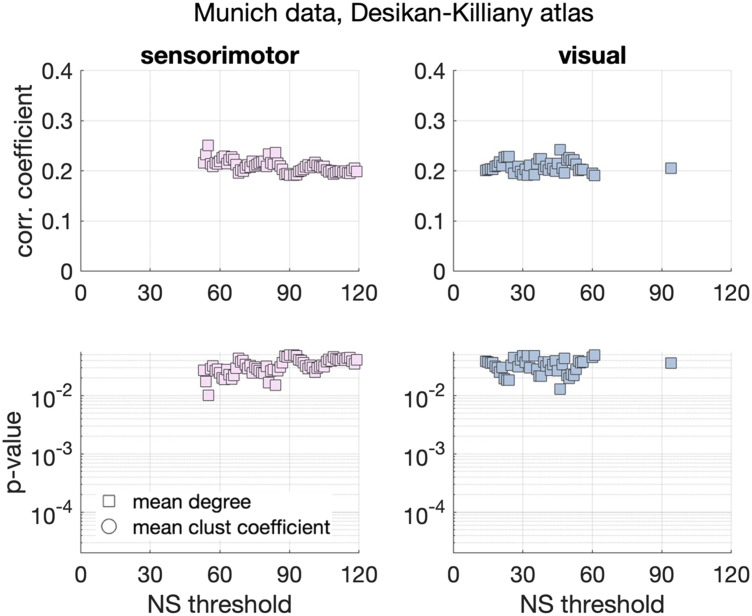
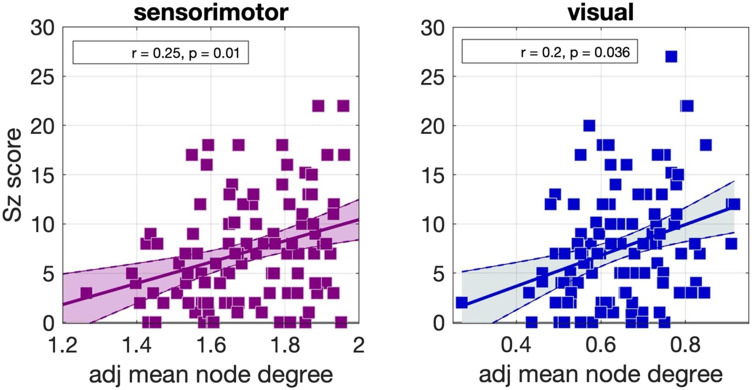
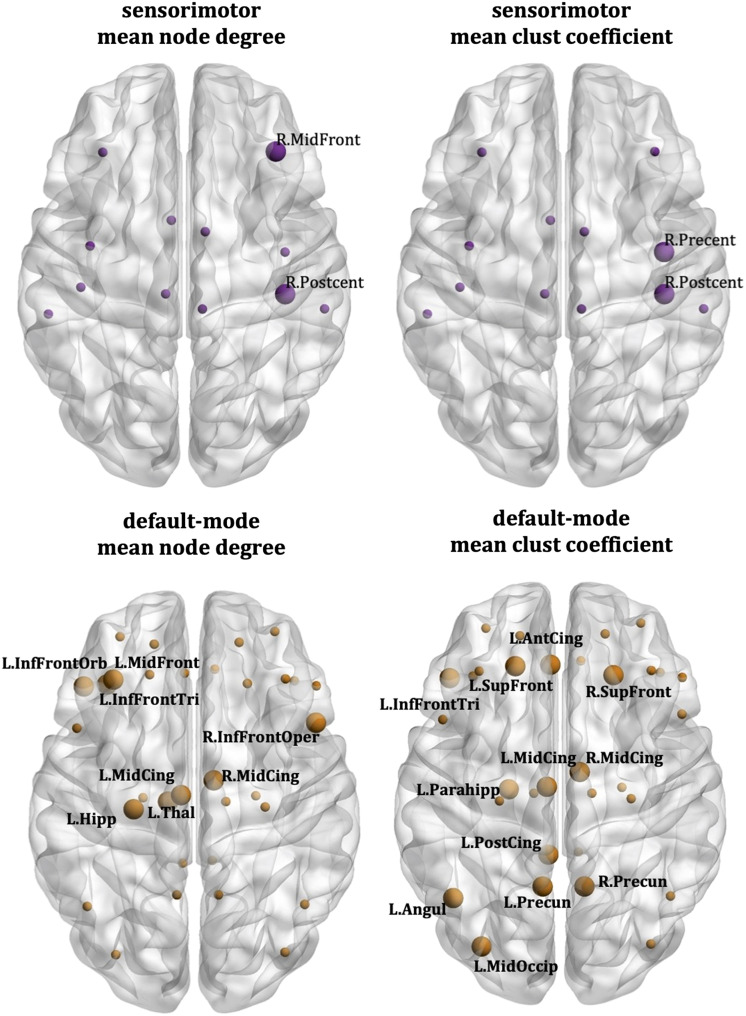
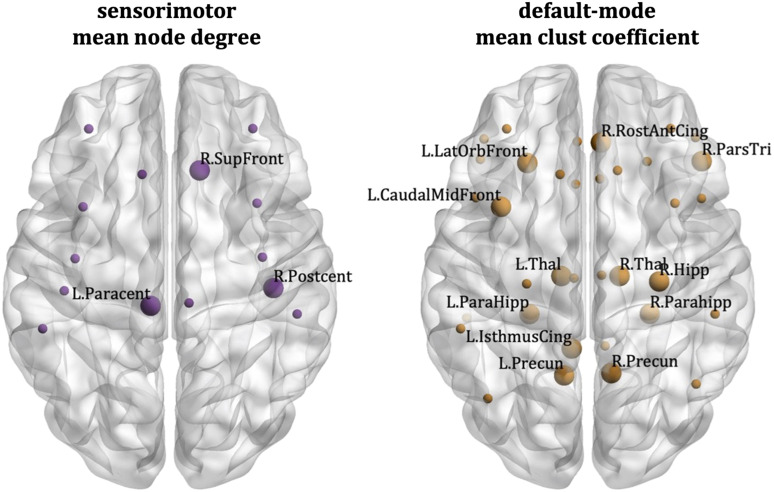
The link between brain structural connectivity and schizotypy was explored in two healthy participant cohorts, collected at two different neuroimaging centres, comprising 140 and 115 participants, respectively. The participants completed the Schizotypal Personality Questionnaire (SPQ), through which their schizotypy scores were calculated. Diffusion-MRI data were used to perform tractography and to generate the structural brain networks of the participants. The edges of the networks were weighted with the inverse radial diffusivity. Graph theoretical metrics of the default mode, sensorimotor, visual, and auditory subnetworks were derived and their correlation coefficients with the schizotypy scores were calculated. To the best of our knowledge, this is the first time that graph theoretical measures of structural brain networks are investigated in relation to schizotypy. A positive correlation was found between the schizotypy score and the mean node degree and mean clustering coefficient of the sensorimotor and the default mode subnetworks. The nodes driving these correlations were the right postcentral gyrus, the left paracentral lobule, the right superior frontal gyrus, the left parahippocampal gyrus, and the bilateral precuneus, that is, nodes that exhibit compromised functional connectivity in schizophrenia. Implications for schizophrenia and schizotypy are discussed.

Keywords: Brain networks; Schizophrenia; Schizotypy; Structural connectivity; Tractography.


Figures

<b>Figure 1.</b>
Figure 1.
Analysis pipeline.
<b>Figure 2.</b>
Figure 2.
NSthr required to achieve a given sparsity in the whole-brain structural networks for the three dataset/atlas combinations.
<b>Figure 3.</b>
Figure 3.
Correlation coefficients and p values between graph theoretical metrics and schizotypy score for the Cardiff data and the AAL atlas. Only the two subnetworks that showed persistent correlations across thresholds are shown. Coloured markers indicate correlation coefficients and p values that survived multiple comparison correction, while blank (fainter coloured) markers indicate correlations that were nominally significant (p < 0.05), but did not survive multiple comparison correction.
<b>Figure 4.</b>
Figure 4.
Scatter plots for the correlations observed in the Cardiff data for the AAL atlas parcellation for NSthr = 86. The best fit line and its 95% confidence interval are also shown.
<b>Figure 5.</b>
Figure 5.
Correlation coefficients and p values between graph theoretical metrics and schizotypy score for the Cardiff data and the Desikan–Killiany atlas. Only the two subnetworks that show persistent correlations across thresholds are shown. Coloured markers indicate correlation coefficients and p values that survived multiple comparison correction, while blank (fainter coloured) markers indicate correlations that were nominally significant (p < 0.05), but did not survive multiple comparison correction.
<b>Figure 6.</b>
Figure 6.
Scatter plots for the correlations observed in the Cardiff data for the Desikan–Killiany parcellation for NSthr = 36. The best fit line and its 95% confidence interval are also shown.
<b>Figure 7.</b>
Figure 7.
Correlation coefficients and p values between graph theoretical metrics and schizotypy score for the Munich data and the Desikan–Killiany atlas. Only the sensorimotor and the visual subnetworks showed persistent, nominally significant correlations across thresholds.
<b>Figure 8.</b>
Figure 8.
Scatter plots for the correlations observed in the Munich data for the Desikan–Killiany parcellation for NSthr = 55. The best fit line and its 95% confidence interval are also shown.
<b>Figure 9.</b>
Figure 9.
Cardiff data: AAL atlas. Nodes that drive the correlations between the schizotypy score and the sensorimotor mean node degree (top left), sensorimotor mean clustering coefficient (top right), default mode mean node degree (bottom left), and default mode mean clustering coefficient (bottom right). The large markers indicate the nodes of each network that drive the correlations; these nodes are also labelled. The small markers indicate the remaining nodes of each network.
<b>Figure 10.</b>
Figure 10.
Cardiff data: Desikan–Killiany atlas. Nodes that drive the correlations between the schizotypy score and the sensorimotor mean node degree (left) and default mode mean clustering coefficient (right). The large markers indicate the nodes of each network that drive the correlations; these nodes are also labelled. The small markers indicate the remaining nodes of the network.
<b>Figure 11.</b>
Figure 11.
Munich data: Desikan–Killiany atlas. Nodes that drive the correlations between the schizotypy score and the sensorimotor mean node degree (left) and visual mean node degree (right). The large markers indicate the nodes of each network that drive the correlations; these nodes are also labelled. The small markers indicate the remaining nodes of the network.

Similar articles

Cited by

References

    1. Abdul-Rahman, M. F., Qiu, A., & Sim, K. (2011). Regionally specific white matter disruptions of fornix and cingulum in schizophrenia. PLoS One, 6(4), e18652. 10.1371/journal.pone.0018652, - DOI - PMC - PubMed
    1. Assaf, Y., & Basser, P. J. (2005). Composite hindered and restricted model of diffusion (CHARMED) MR imaging of the human brain. NeuroImage, 25(1), 48–58. 10.1016/j.neuroimage.2005.03.042, - DOI - PubMed
    1. Barazany, D., Basser, P. J., & Assaf, Y. (2009). In vivo measurement of axon diameter distribution in the corpus callosum of rat brain. Brain, 132(5), 1210–1220. 10.1093/brain/awp042, - DOI - PMC - PubMed
    1. Barrantes-Vidal, N., Lewandowski, K. E., & Kwapil, T. R. (2010). Psychopathology, social adjustment and personality correlates of schizotypy clusters in a large nonclinical sample. Schizophrenia Research, 122(1–3), 219–225. 10.1016/j.schres.2010.01.006, - DOI - PubMed
    1. Benjamini, Y., & Yekutieli, D. (2001). The control of the false discovery rate in multiple testing under dependency. The Annals of Statistics, 29(4), 1165–1188. 10.1214/aos/1013699998 - DOI

LinkOut - more resources