. 2023 Jun 2:17:1138358.
doi: 10.3389/fncir.2023.1138358. eCollection 2023.

Bimodal modulation of L1 interneuron activity in anterior cingulate cortex during fear conditioning

Affiliations

Bimodal modulation of L1 interneuron activity in anterior cingulate cortex during fear conditioning

Giuliana Fossati et al. Front Neural Circuits. .

Abstract

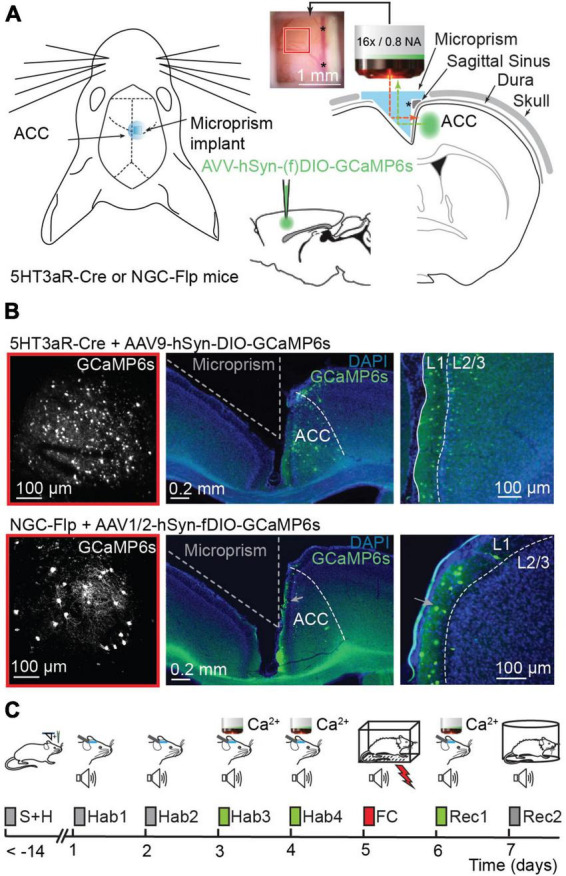
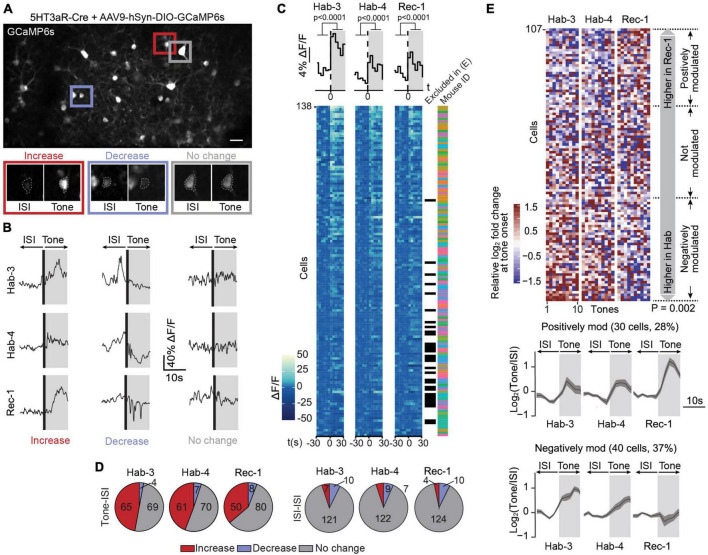
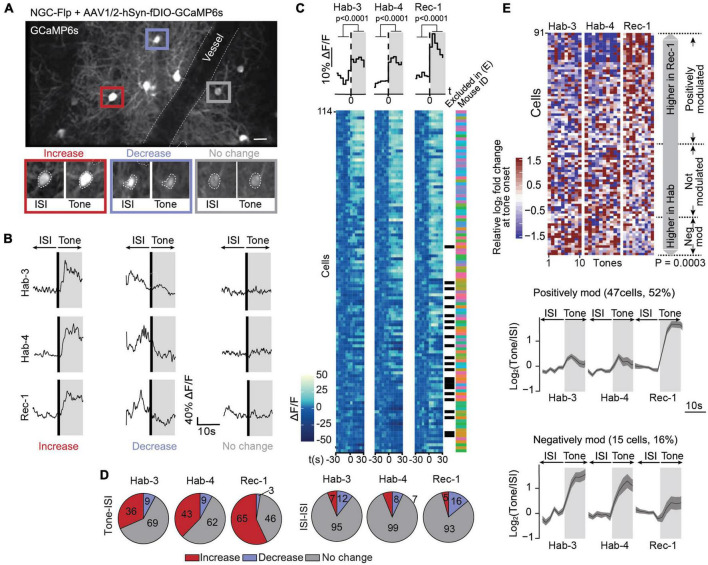
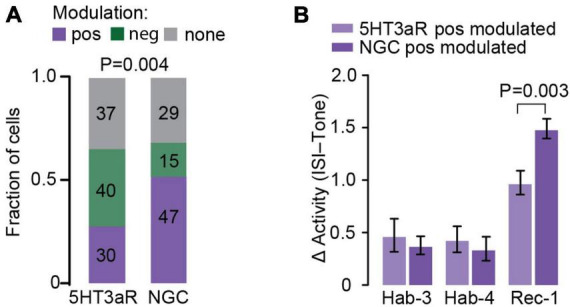
The anterior cingulate cortex (ACC) plays a crucial role in encoding, consolidating and retrieving memories related to emotionally salient experiences, such as aversive and rewarding events. Various studies have highlighted its importance for fear memory processing, but its circuit mechanisms are still poorly understood. Cortical layer 1 (L1) of the ACC might be a particularly important site of signal integration, since it is a major entry point for long-range inputs, which is tightly controlled by local inhibition. Many L1 interneurons express the ionotropic serotonin receptor 3a (5HT3aR), which has been implicated in post-traumatic stress disorder and in models of anxiety. Hence, unraveling the response dynamics of L1 interneurons and subtypes thereof during fear memory processing may provide important insights into the microcircuit organization regulating this process. Here, using 2-photon laser scanning microscopy of genetically encoded calcium indicators through microprisms in awake mice, we longitudinally monitored over days the activity of L1 interneurons in the ACC in a tone-cued fear conditioning paradigm. We observed that tones elicited responses in a substantial fraction of the imaged neurons, which were significantly modulated in a bidirectional manner after the tone was associated to an aversive stimulus. A subpopulation of these neurons, the neurogliaform cells (NGCs), displayed a net increase in tone-evoked responses following fear conditioning. Together, these results suggest that different subpopulations of L1 interneurons may exert distinct functions in the ACC circuitry regulating fear learning and memory.

Keywords: 2-photon laser scanning microscopy; anterior cingulate cortex; fear learning; microprism; neurogliaform cells; serotonin receptor 3a.


Conflict of interest statement

The authors declare that the research was conducted in the absence of any commercial or financial relationships that could be construed as a potential conflict of interest.

Figures

FIGURE 1
FIGURE 1
Calcium imaging in the ACC before and after fear conditioning. (A) Left, schematic representation of prism implantation in 5HT3aR-Cre or NGC-Flp mice. Right, AAV9-hSyn-DIO.GCaMP6s or AAV1/2-hSyn-fDIO.GCaMP6s viral vectors were injected in the ACC of 5HT3aR-Cre or NGC-Flp mice, respectively. Immediately after the injection, a microprism was implanted in the contralateral hemisphere. The inset shows an example of the cranial window with the underlying cortex and vasculature 2 weeks after surgery. The red and green dotted lines represent the excitation beam and the emitted light path, respectively, through the implanted prism. Note that the reflective hypotenuse of the prism converts the horizontal plane into a vertical imaging plane. The asterisk indicates the sagittal sinus, which is also visible on the right-hand side of the inset. (B) Left, example of the field of view with 2PLSM in GCaMP6-expressing 5HT3aR-Cre (top) or in NGC-Flp (bottom) mice. The red square compares the field of view to the size of the cranial window in panel (A). Right, representative post hoc immunostaining showing GCaMP6s expression (green) in the ACC. The integrity of the targeted cortex for imaging remains intact. In blue, DAPI-staining. (C) The FC paradigm. After surgery, mice are handled daily for at least 7 days. The experimental paradigm starts with 4 days of habituation (Hab1-4) where the mice are head-fixed and exposed to tones. In the last 2 days of habituation (Hab-3 and Hab-4) this is combined with 2PLSM. On day 5, the mice are subjected to fear conditioning (FC) in a conditioning box while freely moving. 24 h later a recall session (Rec-1) is performed while mice are head-fixed and imaged. On day 7, animals undergo a second recall session (Rec-2) while freely moving, allowing the scoring of freezing behavior.
FIGURE 2
FIGURE 2
Calcium signals in 5HT3aR interneurons are bimodally modulated following fear conditioning. (A) A field of view containing GCaMP6s-expressing 5HT3aR neurons in L1 of ACC (scale bar: 50 μm). The image is an average projection of the full-length imaging period. The insets show examples of cells displaying an increase, decrease or no change in calcium signals at tone onset. Insets were generated from the average projection of the first 10 s of tone and the last 10 s of the preceding ISI. (B) Example ΔF/F traces of individual neurons over a 20-s window spanning one ISI-tone transition in each imaging session (Hab-3, Hab-4, Rec-1). (C) Tone-evoked 5HT3aR neuron activity. The heatmaps represent calcium signals (ΔF/F) in neurons before and after tone onset. Each row represents a single cell. Each square represents a 5-s bin averaged across all 10 tone presentations. Cells are sorted according to their responsiveness in Hab3, with the highest responses on top. Above the heatmaps, the grand average ΔF/F during tone vs. ISI (mean activity during first and last 30 s, t-test P < 0.0001, n = 138). Next to the heatmaps, the black checkmarks indicate cells that did not significantly respond in any of the recording sessions and were therefore excluded from further analysis (31). The color-coded checkmarks identify the mouse from which the recorded cell was derived. (D) Fraction of cells that increase, decrease, or do not show changes in activity at tone presentation (left) or during ISIs (right) for each recording session. (E) Top, heatmap of the 107 responding cells (8 mice) sorted according to the difference of the median response to tones in Rec-1 relative to Hab-3 and Hab-4. Each square represents the relative log2-fold change of the calcium signal at tone onset. Margin analysis revealed two groups of neurons whose activity is dynamically modulated following fear learning (random permutation analysis P = 0.002). A total of 30 cells are positively modulated by fear learning (median activity difference > 0.3) and 40 cells are negatively modulated (median activity difference < –0.3). Bottom, for both groups of neurons, the lower panel shows the average calcium trace (with SEM) of the tone-evoked calcium signals during all three imaging sessions. Gray areas represent the 10-s tone duration.
FIGURE 3
FIGURE 3
Calcium signals in NGCs are mostly positively modulated following fear conditioning. (A) A field of view containing GCaMP6s-expressing NGCs in L1 of the ACC (scale bar: 50 μm). This image is an average projection of the full-length imaging period. The insets show examples of cells displaying an increase, decrease or no change in calcium signals at tone onset. Insets were generated from the average projection of the first 10 s of tone and the last 10 s of the preceding ISI. (B) Example ΔF/F traces of individual neurons over a 20-s window spanning one ISI-tone transition in each imaging session (Hab-3, Hab-4, Rec-1). (C) Tone-evoked NGC activity. The heatmaps represent calcium signals (ΔF/F) in neurons before and after tone onset. Each row represents a single cell. Each square represents a 5-s bin averaged across all 10 tone presentations. Cells are sorted according to their responsiveness in Hab-3, with the highest responses on top. Above the heatmaps, the grand average ΔF/F during tone vs. ISI (mean activity during first and last 30 s, t-test P < 0.0001, n = 114). Next to the heatmaps, the black checkmarks indicate cells that did not significantly respond in any of the recording sessions and were therefore excluded from further analysis (23). The color-coded checkmarks identify the mouse from which the recorded cell was derived. (D) Fraction of cells that increase, decrease, or do not show changes in activity at tone presentation (left) or during ISIs (right) for each recording session. (E) Top, heatmap of the 91 responding cells (9 mice) sorted according to the difference of the median response to tones in Rec-1 relative to Hab-3 and Hab-4. Each square represents the relative log2-fold change of the calcium signal at tone onset. Margin analysis revealed two groups of neurons whose activity is dynamically modulated following fear learning (random permutation analysis P = 0.0003). A total of 47 cells are positively modulated by fear learning (median activity difference > 0.3) and 15 cells are negatively modulated (median activity difference < –0.3). Bottom, for both groups of neurons, the lower panel shows the average calcium trace (with SEM) of the tone-evoked calcium signals during all three imaging sessions. Gray areas represent the 10-s tone duration.
FIGURE 4
FIGURE 4
Comparison of 5HT3aR neurons and NGC activity upon FC. (A) Fraction of the cells whose activity is positively, negatively or not modulated following fear learning in the 5HT3aR and NGC populations. The number of neurons populating each cluster is indicated inside each color-coded box. Positively modulated neurons are enriched in the NGC population (Chi square test; P = 0.004). (B) Direct comparison of tone-evoked responses between positively 5HT3aR neurons and NGCs. Δ activity was calculated for each cell as an average across all tones of the difference in the log2-fold change during the first 10s of CS and the log2-fold change during the last 10s of ISI. While the average tone-evoked response in habituation sessions does not differ between both groups, it is higher in NGC population during Rec-1 [RM-Two-Way ANOVA, F(2,150) = 6.681, P = 0.003; Post hoc analysis Sidak, N = 30–47 cells].

References

    1. Abs E., Poorthuis R. B., Apelblat D., Muhammad K., Pardi M. B., Enke L., et al. (2018). Learning-related plasticity in dendrite-targeting layer 1 interneurons. Neuron 100 684–699.e6. 10.1016/j.neuron.2018.09.001 - DOI - PMC - PubMed
    1. Aime M., Calcini N., Borsa M., Campelo T., Rusterholz T., Sattin A., et al. (2022). Paradoxical somatodendritic decoupling supports cortical plasticity during REM sleep. Science 376 724–730. 10.1126/science.abk2734 - DOI - PubMed
    1. Amat J., Baratta M. V., Paul E., Bland S. T., Watkins L. R., Maier S. F. (2005). Medial prefrontal cortex determines how stressor controllability affects behavior and dorsal raphe nucleus. Nat. Neurosci. 8 365–371. 10.1038/nn1399 - DOI - PubMed
    1. Anastasiades P. G., Carter A. G. (2021). Circuit organization of the rodent medial prefrontal cortex. Trends Neurosci. 44 550–563. 10.1016/j.tins.2021.03.006 - DOI - PMC - PubMed
    1. Anastasiades P. G., Collins D. P., Carter A. G. (2021). Mediodorsal and ventromedial thalamus engage distinct L1 circuits in the prefrontal cortex. Neuron 109 314–330.e4. 10.1016/j.neuron.2020.10.031 - DOI - PMC - PubMed

Publication types

Substances

LinkOut - more resources