. 2021 Dec 1:2:xtab020.
doi: 10.1093/femsmc/xtab020. eCollection 2021.

Variation in genomic traits of microbial communities among ecosystems

Affiliations

Variation in genomic traits of microbial communities among ecosystems

Peter F Chuckran et al. FEMS Microbes. .

Abstract

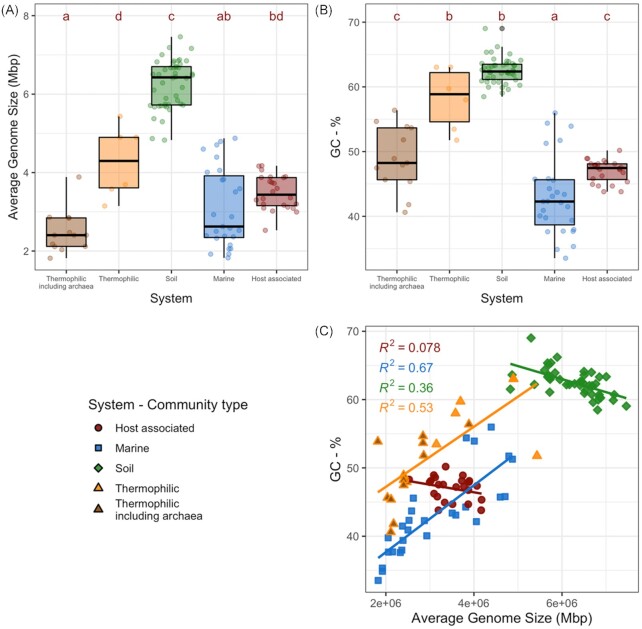
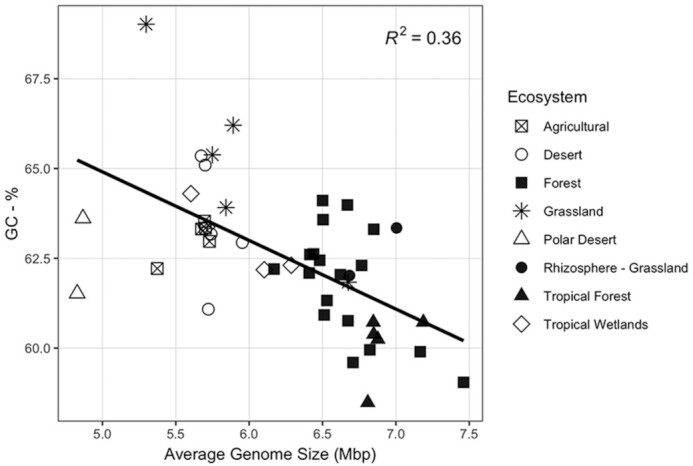
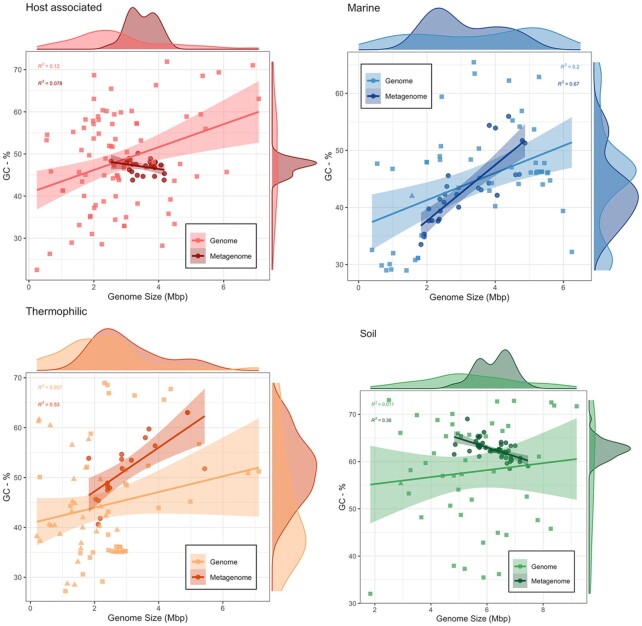
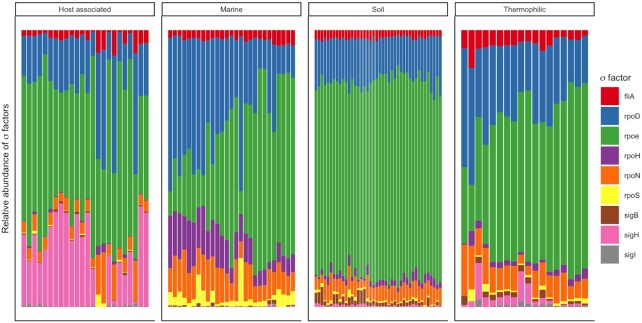
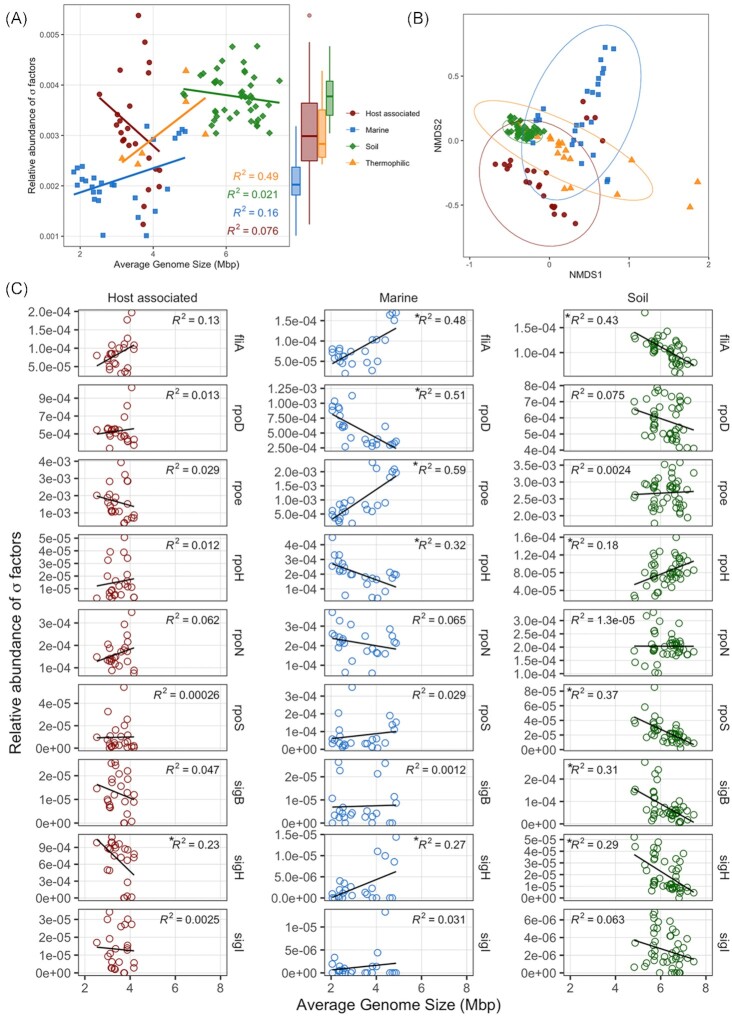
Free-living bacteria in nutrient limited environments often exhibit traits which may reduce the cost of reproduction, such as smaller genome size, low GC content and fewer sigma (σ) factor and 16S rRNA gene copies. Despite the potential utility of these traits to detect relationships between microbial communities and ecosystem-scale properties, few studies have assessed these traits on a community-scale. Here, we analysed these traits from publicly available metagenomes derived from marine, soil, host-associated and thermophilic communities. In marine and thermophilic communities, genome size and GC content declined in parallel, consistent with genomic streamlining, with GC content in thermophilic communities generally higher than in marine systems. In contrast, soil communities averaging smaller genomes featured higher GC content and were often from low-carbon environments, suggesting unique selection pressures in soil bacteria. The abundance of specific σ-factors varied with average genome size and ecosystem type. In oceans, abundance of fliA, a σ-factor controlling flagella biosynthesis, was positively correlated with community average genome size-reflecting known trade-offs between nutrient conservation and chemotaxis. In soils, a high abundance of the stress response σ-factor gene rpoS was associated with smaller average genome size and often located in harsh and/or carbon-limited environments-a result which tracks features observed in culture and indicates an increased capacity for stress response in nutrient-poor soils. This work shows how ecosystem-specific constraints are associated with trade-offs which are embedded in the genomic features of bacteria in microbial communities, and which can be detected at the community level, highlighting the importance of genomic features in microbial community analysis.

Keywords: GC content; genome size; metagenomics; sigma-factors; soil; streamlining.


Conflict of interest statement

None declared.

Figures

Figure 1.
Figure 1.
Average genome size and GC-content calculated from environmental metagenomes. (A) Boxplots of the average genome size (Mbp) of microbial communities in different ecosystems. (B) Boxplots showing GC-% between systems. (C) GC-% as a function of average genome size (Mbp) of a metagenome, separated by system. Point shape and outline represent source system; point fill represents system including thermophilic samples with archaea.
Figure 2.
Figure 2.
GC content (%) as a function of average genome size (Mbp) in soils, with color indicating source environment.
Figure 3.
Figure 3.
The relationship and distribution of genome size and GC content for isolates and metagenomic averages for each system. In each panel, metagenomes (dark circles) are plotted against bacterial (light squares) and archaeal (light triangles) isolates. Regression lines between genome size and GC-% are shown for both metagenomes (dark lines) and isolates (light lines). Marginal density plots show the distributions of GC-% (right) and genome size (top) for isolates (light) and metagenomic averages (dark).
Figure 4.
Figure 4.
The relative abundance σ-factors in a metagenome separated by ecosystem. Each bar represents the abundance of σ-factors in a single metagenome, and metagenomes are ordered from smallest to largest average genome size (left to right) for each ecosystem.
Figure 5.
Figure 5.
The relative abundance of σ-factors (σ-factor count/total gene count) as a function of average genome size and system. (A) The relative abundance of all σ-factors (σ-factor count/total gene count) in a metagenome against average genome size. Source environment indicated by color for host associated (red), soil (green), thermophilic (orange) and marine (blue) communities. (B) NMDS of Bray–Curtis distance of the relative abundance of σ-factors (σ-factor count/total gene count) from a metagenome. (C) The relative abundance (σ-factor count/total gene count) of 9 σ-factors (rows) versus average genome size, separated by environment (columns). Statistical significance of a relationship (P < 0.05) is indicated with an asterisk before R2 value.

References

    1. Abraham BS, Caglayan D, Carrillo N V.et al. . Shotgun metagenomic analysis of microbial communities from the Loxahatchee nature preserve in the Florida Everglades. Environ Microbiomes. 2020;15:2. - PMC - PubMed
    1. Armstrong Z, Mewis K, Liu Fet al. . Metagenomics reveals functional synergy and novel polysaccharide utilization loci in the Castor canadensis fecal microbiome. ISME J. 2018;12:2757–69. - PMC - PubMed
    1. Baker BJ, Lazar CS, Teske APet al. . Genomic resolution of linkages in carbon, nitrogen, and sulfur cycling among widespread estuary sediment bacteria. Microbiome. 2015;3:1–12. - PMC - PubMed
    1. Bankevich A, Nurk S, Antipov Det al. . SPAdes: a new genome assembly algorithm and its applications to single-cell sequencing. J Comput Biol. 2012;19:455–77. - PMC - PubMed
    1. Barberán A, Ramirez KS, Leff JWet al. . Why are some microbes more ubiquitous than others? Predicting the habitat breadth of soil bacteria. Ecol Lett. 2014;17:794–802. - PubMed

LinkOut - more resources