

Ghrelin does not impact the blunted counterregulatory response to recurrent hypoglycemia in mice
- PMID: 37334290
- PMCID: PMC10272800
- DOI: 10.3389/fendo.2023.1181856
Ghrelin does not impact the blunted counterregulatory response to recurrent hypoglycemia in mice
Abstract
Introduction: Recurrent episodes of insulin-induced hypoglycemia in patients with diabetes mellitus can result in hypoglycemia-associated autonomic failure (HAAF), which is characterized by a compromised response to hypoglycemia by counterregulatory hormones (counterregulatory response; CRR) and hypoglycemia unawareness. HAAF is a leading cause of morbidity in diabetes and often hinders optimal regulation of blood glucose levels. Yet, the molecular pathways underlying HAAF remain incompletely described. We previously reported that in mice, ghrelin is permissive for the usual CRR to insulin-induced hypoglycemia. Here, we tested the hypothesis that attenuated release of ghrelin both results from HAAF and contributes to HAAF.
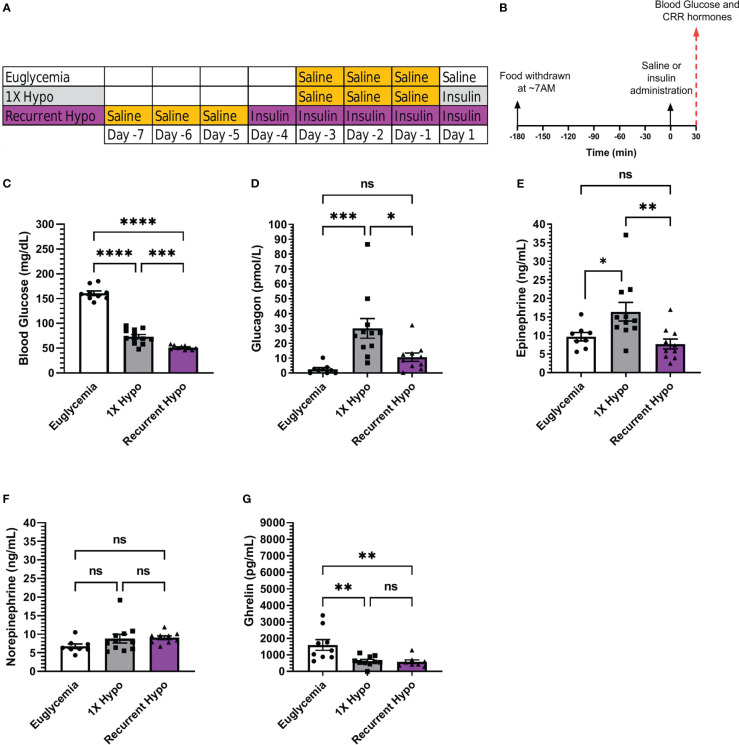
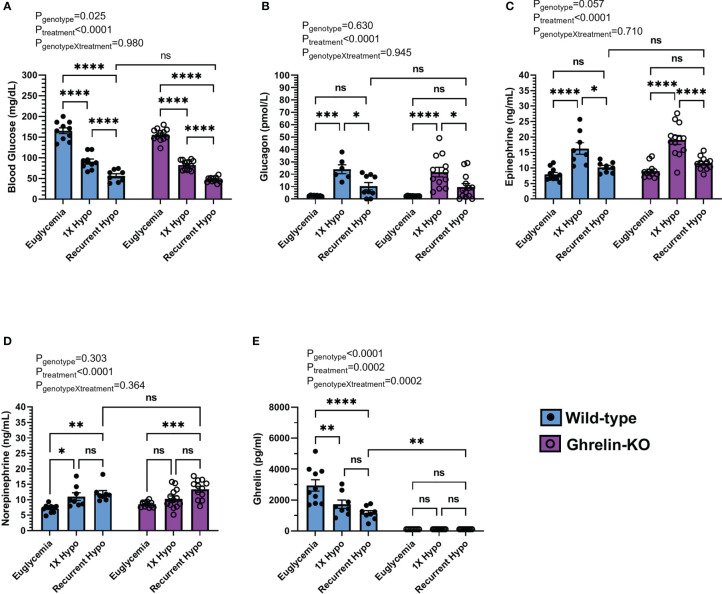
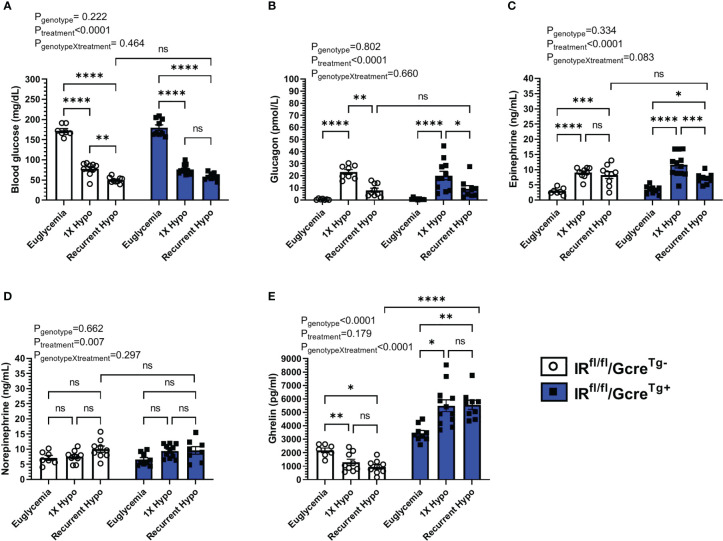
Methods: C57BL/6N mice, ghrelin-knockout (KO) + control mice, and GhIRKO (ghrelin cell-selective insulin receptor knockout) + control mice were randomized to one of three treatment groups: a "Euglycemia" group was injected with saline and remained euglycemic; a 1X hypoglycemia ("1X Hypo") group underwent a single episode of insulin-induced hypoglycemia; a recurrent hypoglycemia ("Recurrent Hypo") group underwent repeated episodes of insulin-induced hypoglycemia over five successive days.
Results: Recurrent hypoglycemia exaggerated the reduction in blood glucose (by ~30%) and attenuated the elevations in plasma levels of the CRR hormones glucagon (by 64.5%) and epinephrine (by 52.9%) in C57BL/6N mice compared to a single hypoglycemic episode. Yet, plasma ghrelin was equivalently reduced in "1X Hypo" and "Recurrent Hypo" C57BL/6N mice. Ghrelin-KO mice exhibited neither exaggerated hypoglycemia in response to recurrent hypoglycemia, nor any additional attenuation in CRR hormone levels compared to wild-type littermates. Also, in response to recurrent hypoglycemia, GhIRKO mice exhibited nearly identical blood glucose and plasma CRR hormone levels as littermates with intact insulin receptor expression (floxed-IR mice), despite higher plasma ghrelin in GhIRKO mice.
Conclusions: These data suggest that the usual reduction of plasma ghrelin due to insulin-induced hypoglycemia is unaltered by recurrent hypoglycemia and that ghrelin does not impact blood glucose or the blunted CRR hormone responses during recurrent hypoglycemia.
Keywords: Blood glucose; counterregulation; ghrelin; hypoglycemia unawareness; hypoglycemia-associated autonomic failure; mouse models.
Copyright © 2023 Shankar, Varshney, Gupta, Mani, Osborne-Lawrence, Metzger, Richard and Zigman.
Conflict of interest statement
JZ consults for Helsinn Healthcare S.A. and Dexcel Pharma Technologies Ltd. and receives research funding from Novo Nordisk for a different project. The remaining authors declare that the research was conducted in the absence of any commercial or financial relationships that could be construed as a potential conflict of interest.
Figures
References
-
- Lin YK, Hung M, Sharma A, Chan O, Varner MW, Staskus G, et al. Impaired awareness of hypoglycemia continues to be a risk factor for severe hypoglycemia despite the use of continuous glucose monitoring system in type 1 diabetes. Endocr Pract (2019) 25:517–25. doi: 10.4158/EP-2018-0527 - DOI - PMC - PubMed
Publication types
MeSH terms
Substances
Grants and funding
LinkOut - more resources
Full Text Sources
Medical
Molecular Biology Databases
Research Materials