

Identification of biomarkers and immune infiltration in acute myocardial infarction and heart failure by integrated analysis
- PMID: 37334672
- PMCID: PMC10329185
- DOI: 10.1042/BSR20222552
Identification of biomarkers and immune infiltration in acute myocardial infarction and heart failure by integrated analysis
Abstract
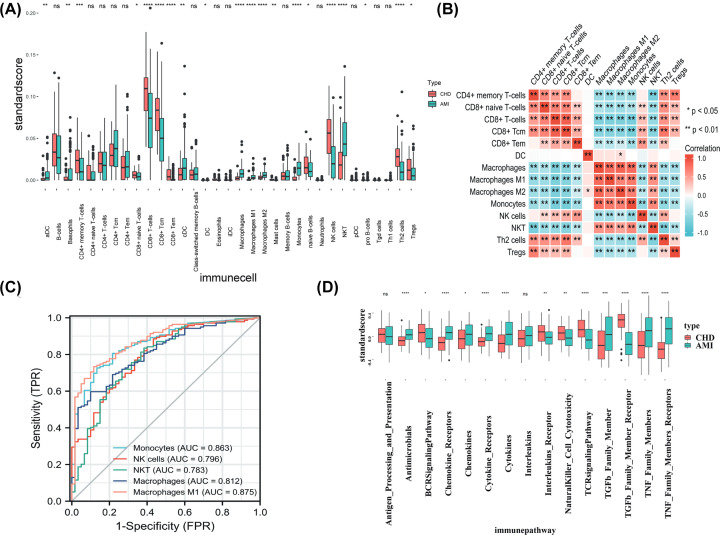
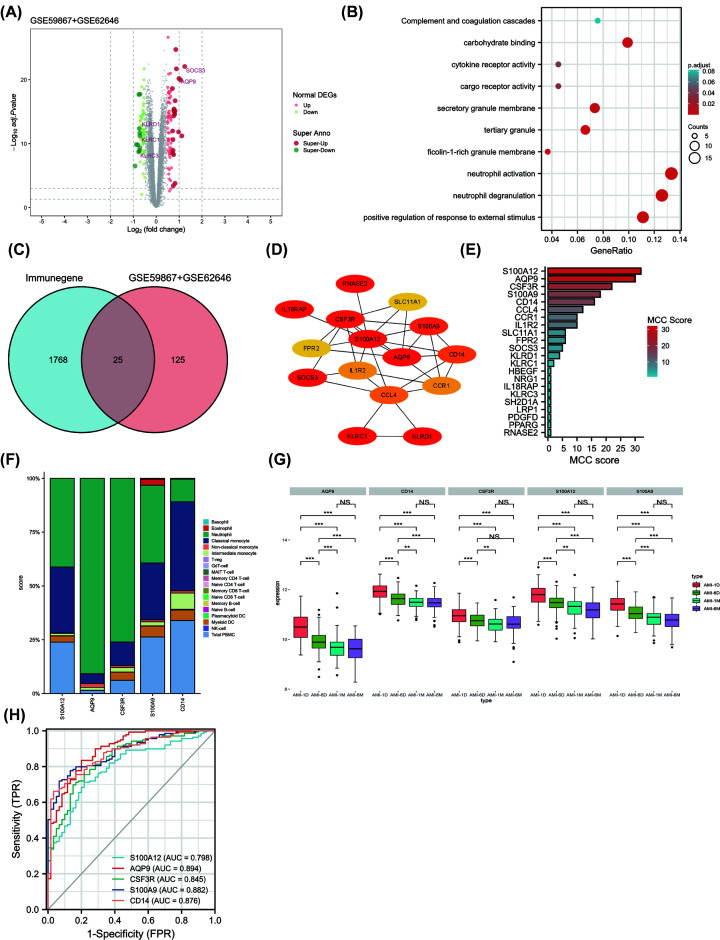
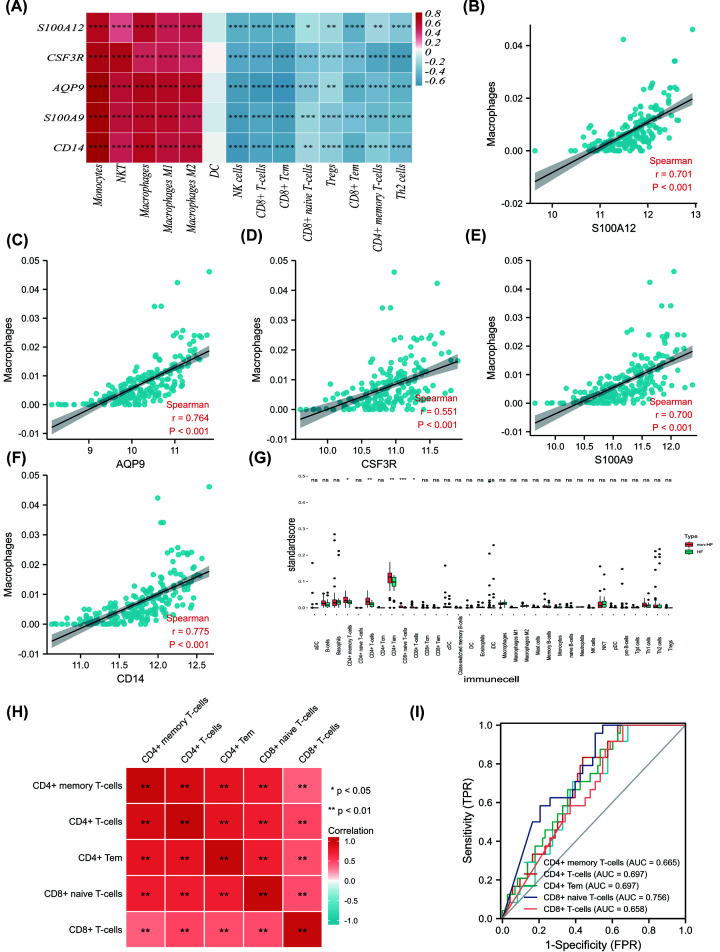
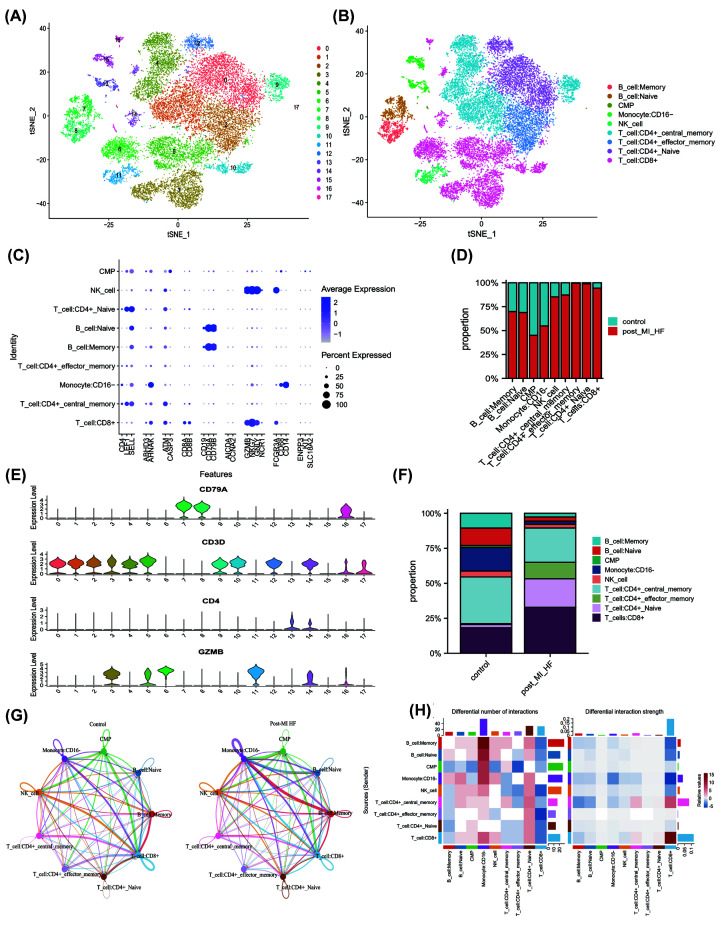
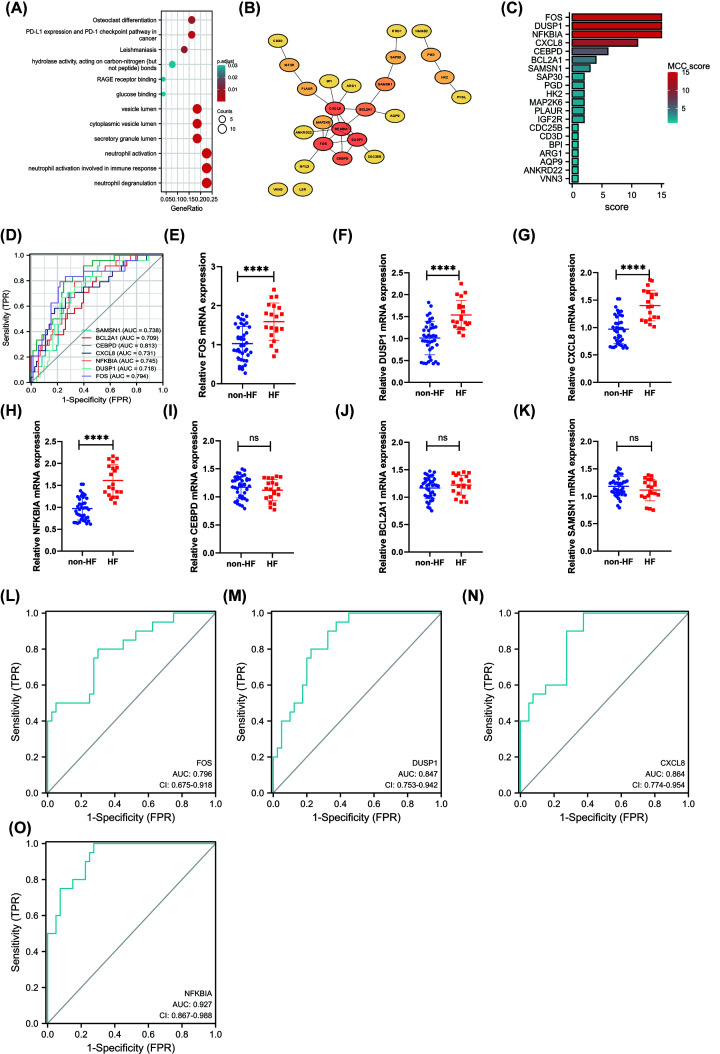
The mortality of heart failure after acute myocardial infarction (AMI) remains high. The aim of the present study was to analyze hub genes and immune infiltration in patients with AMI and heart failure (HF). The study utilized five publicly available gene expression datasets from peripheral blood in patients with AMI who either developed or did not develop HF. The unbiased patterns of 24 immune cell were estimated by xCell algorithm. Single-cell RNA sequencing data were used to examine the immune cell infiltration in heart failure patients. Hub genes were validated by quantitative reverse transcription-PCR (RT-qPCR). In comparison with the coronary heart disease (CHD) group, immune infiltration analysis of AMI patients showed that macrophages M1, macrophages, monocytes, natural killer (NK) cells, and NKT cells were the five most highly activated cell types. Five common immune-related genes (S100A12, AQP9, CSF3R, S100A9, and CD14) were identified as hub genes associated with AMI. Using RT-qPCR, we confirmed FOS, DUSP1, CXCL8, and NFKBIA as the potential biomarkers to identify AMI patients at risk of HF. The study identified several transcripts that differentiate between AMI and CHD, and between HF and non-HF patients. These findings could improve our understanding of the immune response in AMI and HF, and allow for early identification of AMI patients at risk of HF.
Keywords: acute myocardial infarction; diagnosis; expression profile; heart failure; immune cell infiltration; single cell sequencing.
© 2023 The Author(s).
Conflict of interest statement
The authors declare that there are no competing interests associated with the manuscript.
Figures
Similar articles
-
PRKAR1A and SDCBP Serve as Potential Predictors of Heart Failure Following Acute Myocardial Infarction.Front Immunol. 2022 May 3;13:878876. doi: 10.3389/fimmu.2022.878876. eCollection 2022. Front Immunol. 2022. PMID: 35592331 Free PMC article.
-
Identification of monocyte-associated genes as predictive biomarkers of heart failure after acute myocardial infarction.BMC Med Genomics. 2021 Feb 9;14(1):44. doi: 10.1186/s12920-021-00890-6. BMC Med Genomics. 2021. PMID: 33563285 Free PMC article.
-
Identification of hub glycolysis-related genes in acute myocardial infarction and their correlation with immune infiltration using bioinformatics analysis.BMC Cardiovasc Disord. 2024 Jul 10;24(1):349. doi: 10.1186/s12872-024-03989-7. BMC Cardiovasc Disord. 2024. PMID: 38987688 Free PMC article.
-
Adverse Cardiac Remodelling after Acute Myocardial Infarction: Old and New Biomarkers.Dis Markers. 2020 Jun 12;2020:1215802. doi: 10.1155/2020/1215802. eCollection 2020. Dis Markers. 2020. PMID: 32626540 Free PMC article. Review.
-
Dysrhythmias and heart failure complicating acute myocardial infarction: An emergency medicine review.Am J Emerg Med. 2019 Aug;37(8):1554-1561. doi: 10.1016/j.ajem.2019.04.047. Epub 2019 Apr 27. Am J Emerg Med. 2019. PMID: 31060863 Review.
Cited by
-
CENPA and BRCA1 are potential biomarkers associated with immune infiltration in heart failure and pan-cancer.Heliyon. 2024 Mar 27;10(7):e28786. doi: 10.1016/j.heliyon.2024.e28786. eCollection 2024 Apr 15. Heliyon. 2024. PMID: 38576566 Free PMC article.
-
Bibliometric study and visualization of myocardial infarction combined with heart failure, 1993-2023.Front Cardiovasc Med. 2025 Aug 8;12:1555748. doi: 10.3389/fcvm.2025.1555748. eCollection 2025. Front Cardiovasc Med. 2025. PMID: 40860357 Free PMC article.
-
Single-cell RNA sequencing reveals the potential role of Postn(+) fibroblasts in promoting the progression of myocardial fibrosis after myocardial infarction.Sci Rep. 2025 Jul 1;15(1):22390. doi: 10.1038/s41598-025-04990-6. Sci Rep. 2025. PMID: 40595870 Free PMC article.
-
Screening of biomarkers for diagnosing chronic kidney disease and heart failure with preserved ejection fraction through bioinformatics analysis.Biochem Biophys Rep. 2025 Jan 11;41:101911. doi: 10.1016/j.bbrep.2024.101911. eCollection 2025 Mar. Biochem Biophys Rep. 2025. PMID: 39877037 Free PMC article.
-
From multi-omics approaches to personalized medicine in myocardial infarction.Front Cardiovasc Med. 2023 Oct 30;10:1250340. doi: 10.3389/fcvm.2023.1250340. eCollection 2023. Front Cardiovasc Med. 2023. PMID: 37965091 Free PMC article. Review.
References
-
- Vanhaverbeke M., Vausort M., Veltman D., Zhang L., Wu M., Laenen G.et al. . (2019) Peripheral blood RNA levels of QSOX1 and PLBD1 are new independent predictors of left ventricular dysfunction after acute myocardial infarction. Circ. Genom. Precis. Med. 12, e002656 10.1161/CIRCGEN.119.002656 - DOI - PMC - PubMed
Publication types
MeSH terms
Substances
LinkOut - more resources
Full Text Sources
Medical
Research Materials
Miscellaneous