. 2023 Aug 11;51(14):7269-7287.
doi: 10.1093/nar/gkad523.

In skeletal muscle and neural crest cells, SMCHD1 regulates biological pathways relevant for Bosma syndrome and facioscapulohumeral dystrophy phenotype

Affiliations

In skeletal muscle and neural crest cells, SMCHD1 regulates biological pathways relevant for Bosma syndrome and facioscapulohumeral dystrophy phenotype

Camille Laberthonnière et al. Nucleic Acids Res. .

Abstract

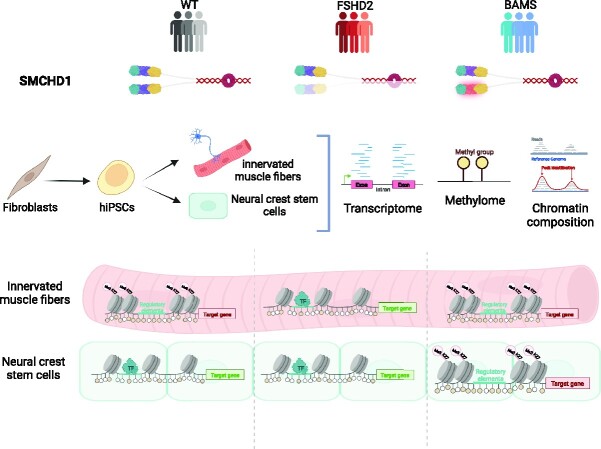
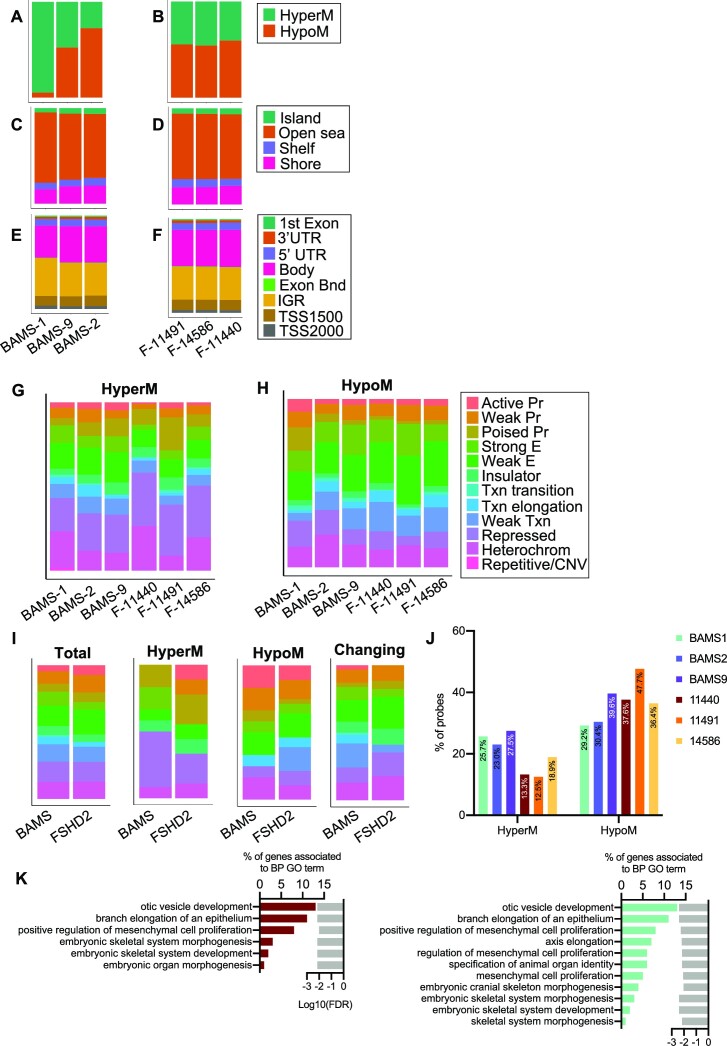
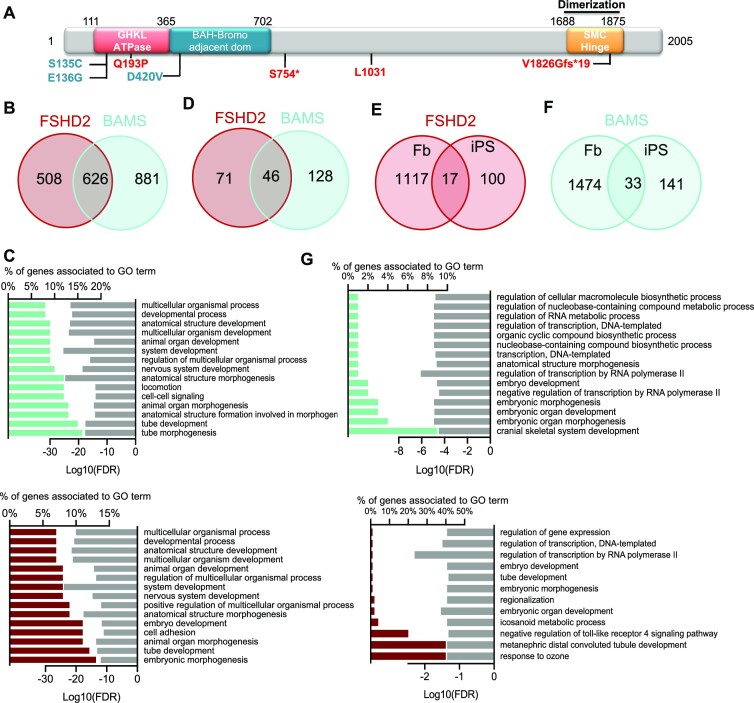
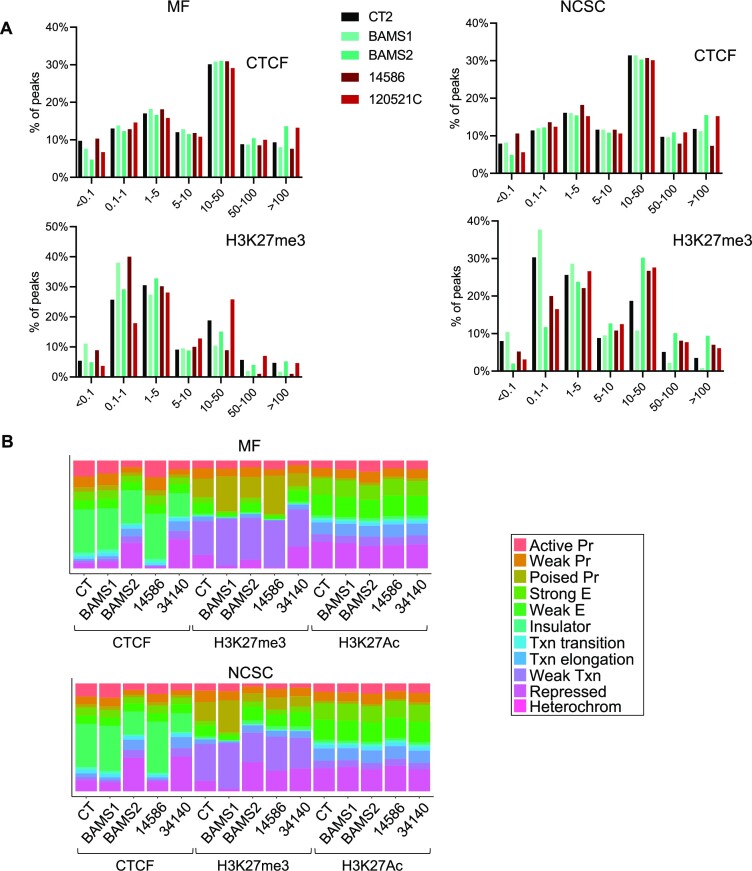
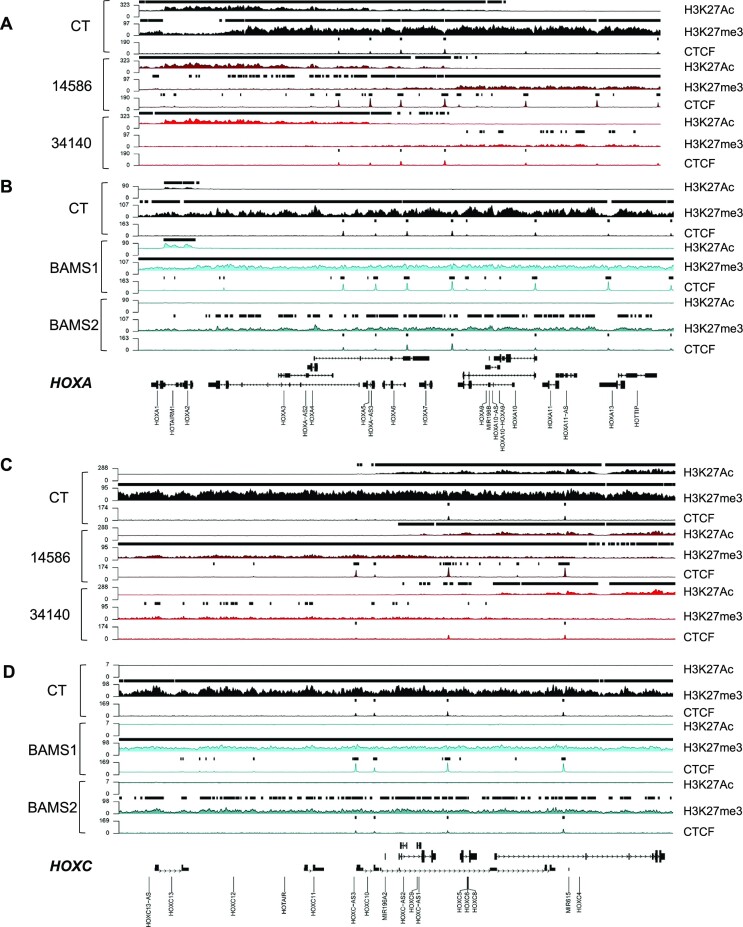
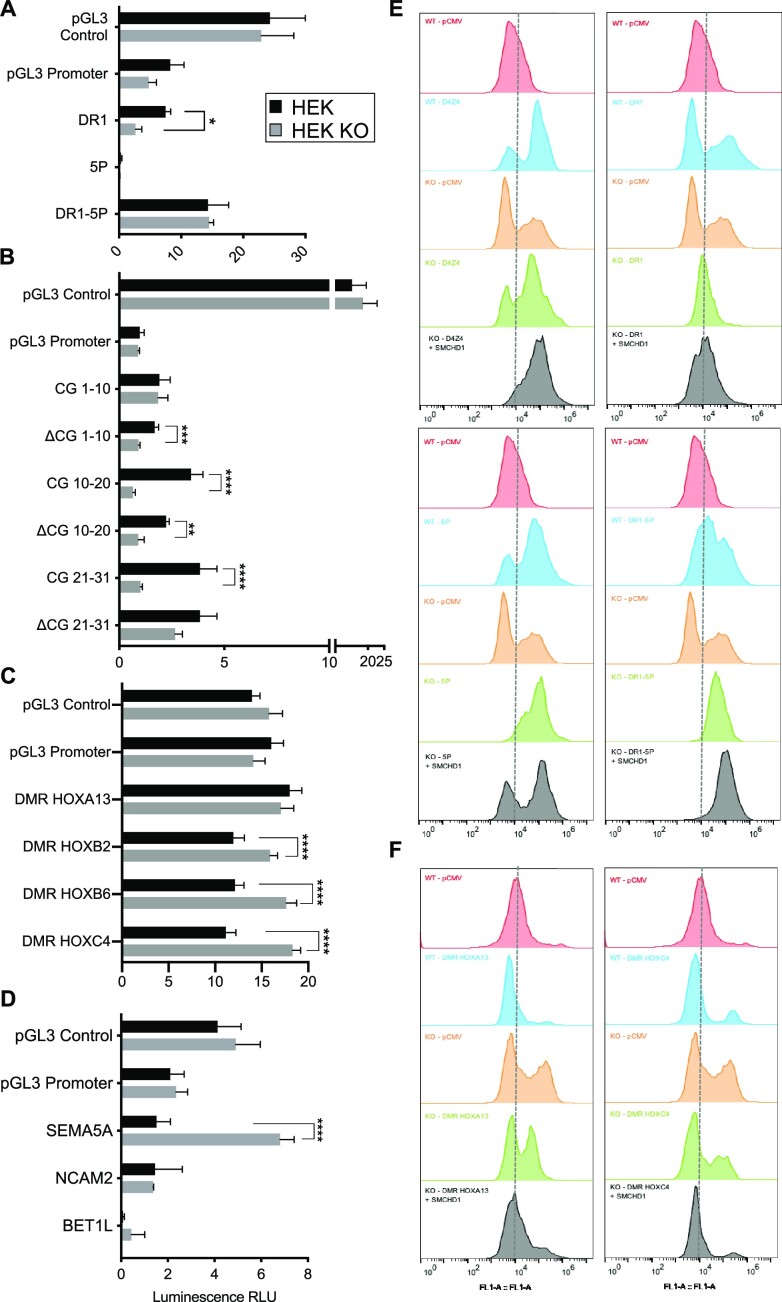
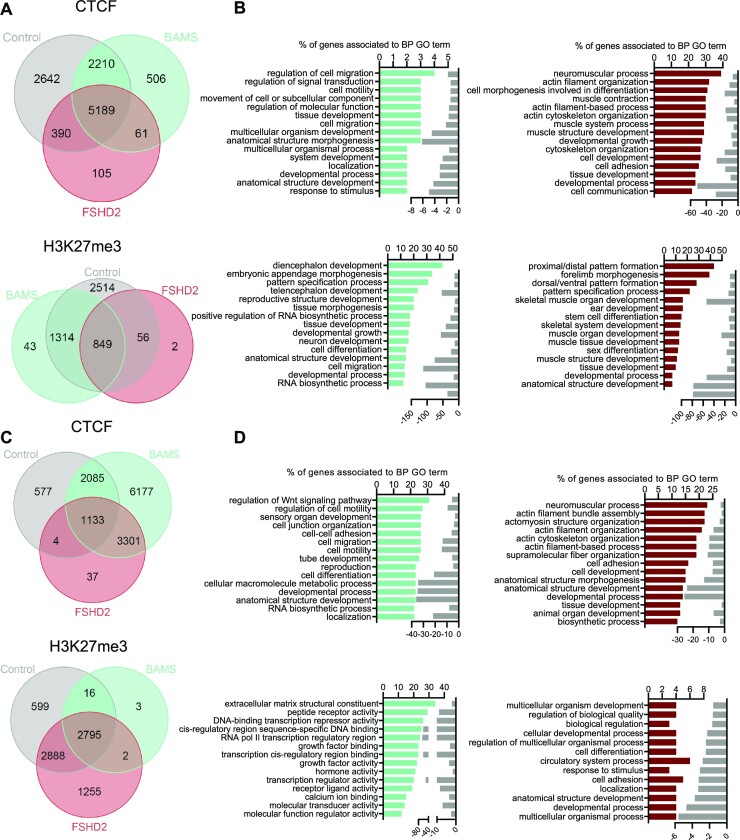
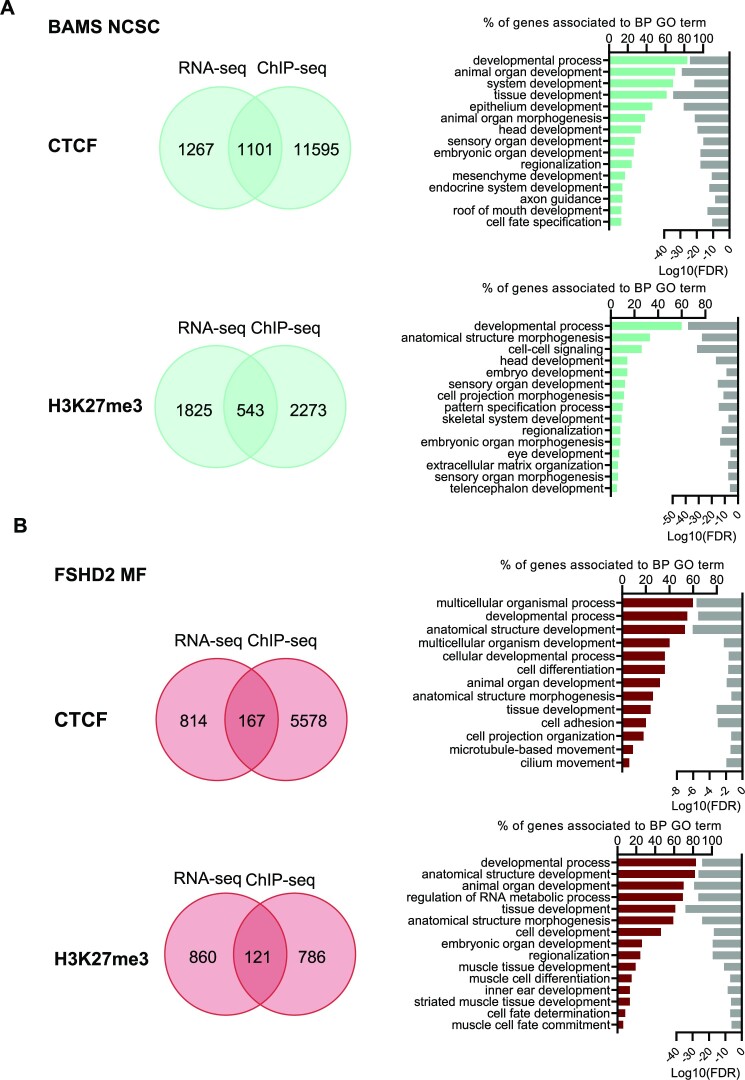
Many genetic syndromes are linked to mutations in genes encoding factors that guide chromatin organization. Among them, several distinct rare genetic diseases are linked to mutations in SMCHD1 that encodes the structural maintenance of chromosomes flexible hinge domain containing 1 chromatin-associated factor. In humans, its function as well as the impact of its mutations remains poorly defined. To fill this gap, we determined the episignature associated with heterozygous SMCHD1 variants in primary cells and cell lineages derived from induced pluripotent stem cells for Bosma arhinia and microphthalmia syndrome (BAMS) and type 2 facioscapulohumeral dystrophy (FSHD2). In human tissues, SMCHD1 regulates the distribution of methylated CpGs, H3K27 trimethylation and CTCF at repressed chromatin but also at euchromatin. Based on the exploration of tissues affected either in FSHD or in BAMS, i.e. skeletal muscle fibers and neural crest stem cells, respectively, our results emphasize multiple functions for SMCHD1, in chromatin compaction, chromatin insulation and gene regulation with variable targets or phenotypical outcomes. We concluded that in rare genetic diseases, SMCHD1 variants impact gene expression in two ways: (i) by changing the chromatin context at a number of euchromatin loci or (ii) by directly regulating some loci encoding master transcription factors required for cell fate determination and tissue differentiation.


Figures

Graphical Abstract
Graphical Abstract
Figure 1.
Figure 1.
Profiling of DNAme in SMCHD1-deficient cells. One hundred percent stacked bar graphs of the distribution of hypomethylated and hypermethylated probes in individual BAMS samples (A) or individual FSHD2 samples (B). One hundred percent stacked bar graphs for DMPs by CpG content relative to CpG islands, shores (2 kb flanking CpG islands), shelves (2 kb extending from shores) or open seas (isolated CpGs in the rest of the genome) in individual BAMS samples (C) or individual FSHD2 samples (D). One hundred percent stacked bar graphs for DMPs by features corresponding to genes’ first exon, 3′ UTR, 5′ UTR, gene bodies, exon boundaries, internal genomic regions and probes located 1500 bp from transcription start sites (TSS1500) or 2000 bp from transcription start sites (TSS200) in individual BAMS samples (E) or individual FSHD2 samples (F). DMRs with an FDR-adjusted P-value <0.05 were analyzed for ChromHMM features using NHEK cell annotations and plotted using the ggplot2 (v3.3.3) R package. One hundred percent stacked bar graphs for hypermethylated (G) or hypomethylated (H) probes are presented. (I) Left to right: bar plots of DMRs shared between patients when compared to controls (total), shared hypermethylated DMRs (HyperM), shared hypomethylated DMRs (HypoM) and DMRs with a different methylation profile between patients (changing). (J) Graph displaying the percentage of hypermethylated or hypomethylated probes at enhancers in the different BAMS and FSHD2 samples. (K) BPs overrepresented for BAMS (cyan, right) or FSHD2 (red, left) DMRs. Bar plots on the left represent the percentage of genes and associated with GO terms listed in the right column. Light gray bars on the right represent the enrichment score (log10FDR) for each GO term.
Figure 2.
Figure 2.
Expression profiling in fibroblasts and iPSCs from patients affected with BAMS or FSHD2. (A) Schematic representation of the SMCHD1 protein with position of the different mutations in BAMS (cyan) or FSHD2 (red) patients. (B) Venn diagrams for comparison of genes that are differentially expressed in FSHD2 and BAMS primary fibroblasts compared to controls with −2 > FC > 2 and FDR < 0.05. (C) GO for BPs corresponding to enrichment analysis of DEGs in FSHD2 (red, upper panel) or BAMS (cyan, lower panel) versus control fibroblasts filtered on −2 > FC > 2 and FDR < 0.05. Bar plots on the left represent the percentage of genes that are differentially expressed and associated with a GO term shown in the right column. Light gray bars on the right represent the enrichment score (log10FDR) for each BP. (D) Venn diagrams for comparison of DEGs in FSHD2 and BAMS hiPSCs compared to controls. (E) Venn diagrams for comparison of DEGs between FSHD2 fibroblasts and hiPSCs. (F) Venn diagrams for comparison of DEGs between BAMS fibroblasts and hiPSCs. (G) GO for BPs corresponding to enrichment analysis of DEGs in FSHD2 (red, upper panel) or BAMS (cyan, lower panel) versus control hiPSCs filtered on −2 > FC > 2 and FDR < 0.05. Bar plots on the left represent the percentage of DEGs and associated with GO terms in the right column. Light gray bars on the right represent the enrichment score (log10FDR) for each GO term.
Figure 3.
Figure 3.
Chromatin profiling of hiPSC-derived MFs and NCSCs from SMCHD1-deficient patients. (A) Distribution of distances from TSSs for peaks enriched in CTCF or H3K27me3 in controls, BAMS or FSHD2 MFs or NCSCs. Peaks’ distribution relative to TSSs was assessed using the chipenrich (v2.14.0) R package. (B) Distribution of peaks enriched in CTCF, H3K27me3 or H3K27Ac relative to chromatin features determined using the ChromHMM track in MFs or NCSCs derived from control, BAMS or FSHD hiPSCs. Peaks with at least a q-value <0.05 in one replicate were analyzed for ChromHMM features using HSMM cell annotations and represented as bar plots using the R ggplot2 (v3.3.3) package.
Figure 4.
Figure 4.
Chromatin profiling of HOXA and HOXC genes in SMCHD1-deficient cells. (A) Profiling of the HOXA gene locus (chr7:27090339–27211142, 120 803 bp) in controls (black) or FSHD2 (red) MFs for H3K27Ac, H3K27me3 or CTCF enrichment. (B) Profiling of the HOXA gene locus (chr7:27090339–27211142, 120 803 bp) in controls (black) or BAMS (cyan) NCSCs for H3K27Ac, H3K27me3 or CTCF enrichment. (C) Profiling of the HOXC gene locus (chr12:53930562–54058000; 127 438 bp) in controls (black) or FSHD2 (red) MFs for H3K27Ac, H3K27me3 or CTCF enrichment. (D) Profiling of the HOXC gene locus (chr12:53930562–54058000; 127 438 bp) in controls (black) or BAMS (cyan) NCSCs for H3K27Ac, H3K27me3 or CTCF enrichment.
Figure 5.
Figure 5.
Depending on the genomic context, SMCHD1 contributes to gene silencing or protects against position effects. For the different pGL3 constructs, fragments corresponding to the regions that are differentially methylated (AC) or corresponding to SMCHD1 binding sites (D) were cloned downstream of the luciferase reporter gene in vectors lacking an enhancer (pGL3 promoter). Firefly luciferase expression was determined 48 h post-transfection of the different constructs in HEK293 and HEK SMCHD1 KO cells. The pGL3 control vector was used as a transfection control. Firely luciferase levels were normalized to expression of the Renilla luciferase used as transfection control. Values corresponding to the normalized luciferase activity (expressed in relative luminescence units, RLUs) are the average of three independent assays, each realized as technical triplicates (n = 9). Error bars represent standard error. Statistical significance was determined using a Mann–Whitney test (****P-value <0.00001, ***P-value <0.0001, **P-value <0.001, *P-value = 0.01). (A) For the D4Z4 macrosatellite, regions that are differentially methylated in patients carrying a mutation in SMCHD1 were tested (DR1, 5P; a scheme of the D4Z4 repeat is presented in Supplementary Figure S13). (B) The DR1 sequence contains 31 CG sites. Fragments corresponding to CG1–10, CG10–20 and CG21–31 or deleted of 10 of these CGs (ΔCG1–10, ΔCG10–20 and ΔCG21–31) were tested. (C) HOX gene DMRs. (D) Putative SMCHD1 binding sites overlapping or not with CTCF binding sites. (EF) For evaluation of protection against position effect, we used a vector carrying a hygromycin resistance gene and an eGFP reporter gene. Sequences to be tested are cloned downstream of the eGFP gene and transfected into HEK or HEK KO cells. Stable eGFP expression was measured by flow cytometry (FACS) for an extended period of time in cells grown in the presence of hygromycin B. Representative spectra of the % of eGFP-positive cells are presented. For each condition, eGFP expression was compared to values obtained in cells transfected with the empty vector (pCMV). In HEK SMCHD1 KO cells, eGFP expression was also measured 72 h after transfection of an SMCHD1 expression vector (gray curves). (E) D4Z4 (left upper panel), DR1–5P (right upper panel), DR1 (left lower panel) and 5P (right lower panel). (F) Results obtained for the HOXA13 (left) and HOXC4/5/6 (right) DMRs.
Figure 6.
Figure 6.
Chromatin profiling in SMCHD1-deficient cells. (A) Venn diagrams for comparison of peaks enriched in controls, BAMS and FSHD2 hiPSC-derived MFs for CTCF or H3K27me3. (B) GO terms for BPs corresponding to peaks enriched in CTCF or H3K27me3 in BAMS cells (cyan) or FSHD2 (red) MFs. Bars correspond to the number of genes corresponding to the different BPs. Light gray bars on the right represent the enrichment score (log10FDR) for each GO term. (C) Venn diagrams for comparison of peaks enriched in controls, BAMS and FSHD2 hiPSC-derived NCSCs for CTCF or H3K27me3. (D) GO terms for BPs corresponding to peaks enriched in CTCF or H3K27me3 in NCSCs in BAMS (cyan) or FSHD2 (red) cells. Bars correspond to the number of genes corresponding to the different BPs. Light gray bars on the right represent the enrichment score (log10FDR) for each GO term.
Figure 7.
Figure 7.
Comparison between chromatin peaks and DEGs in NCSCs and MFs from BAMS and FSHD2 patients. (A) Venn diagrams (left) and GO terms for BPs (right) of peaks specifically enriched in CTCF or H3K27me3 in BAMS NCSCs (cyan). (B) Venn diagrams (left) and GO terms for BPs (right) of peaks specifically enriched in CTCF or H3K27me3 in FSHD2 MFs (red). For GO terms, bars correspond to the number of genes corresponding to the different BPs. Light gray bars on the right represent the enrichment score (log10FDR) for each GO term.

References

    1. Blewitt M.E., Vickaryous N.K., Hemley S.J., Ashe A., Bruxner T.J., Preis J.I., Arkell R., Whitelaw E.. An N-ethyl-N-nitrosourea screen for genes involved in variegation in the mouse. Proc. Natl Acad. Sci. U.S.A. 2005; 102:7629–7634. - PMC - PubMed
    1. Chen K., Czabotar P.E., Blewitt M.E., Murphy J.M.. The hinge domain of the epigenetic repressor Smchd1 adopts an unconventional homodimeric configuration. Biochem. J. 2016; 473:733–742. - PubMed
    1. Blewitt M.E., Gendrel A.V., Pang Z., Sparrow D.B., Whitelaw N., Craig J.M., Apedaile A., Hilton D.J., Dunwoodie S.L., Brockdorff N.et al. .. SmcHD1, containing a structural-maintenance-of-chromosomes hinge domain, has a critical role in X inactivation. Nat. Genet. 2008; 40:663–669. - PubMed
    1. Gendrel A.V., Apedaile A., Coker H., Termanis A., Zvetkova I., Godwin J., Tang Y.A., Huntley D., Montana G., Taylor S.et al. .. Smchd1-dependent and -independent pathways determine developmental dynamics of CpG island methylation on the inactive X chromosome. Dev. Cell. 2012; 23:265–279. - PMC - PubMed
    1. Gendrel A.V., Tang Y.A., Suzuki M., Godwin J., Nesterova T.B., Greally J.M., Heard E., Brockdorff N.. Epigenetic functions of Smchd1 repress gene clusters on the inactive X chromosome and on autosomes. Mol. Cell. Biol. 2013; 33:3150–3165. - PMC - PubMed

Publication types

Supplementary concepts