

Retinal hypoplasia and degeneration result in vision loss in Friedreich ataxia
- PMID: 37334854
- PMCID: PMC10424660
- DOI: 10.1002/acn3.51830
Retinal hypoplasia and degeneration result in vision loss in Friedreich ataxia
Abstract
Objective: Friedreich ataxia (FRDA) is an inherited condition caused by a GAA triplet repeat (GAA-TR) expansion in the FXN gene. Clinical features of FRDA include ataxia, cardiomyopathy, and in some, vision loss. In this study, we characterize features of vision loss in a large cohort of adults and children with FRDA.
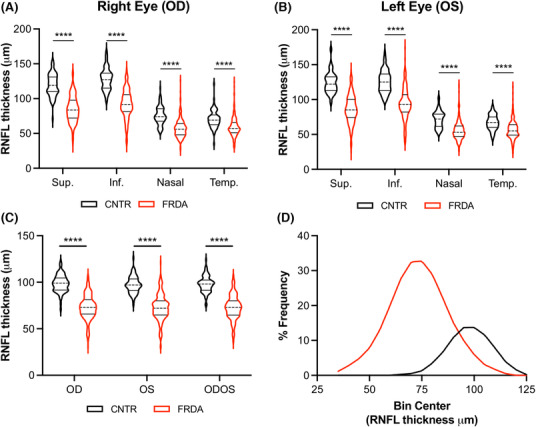
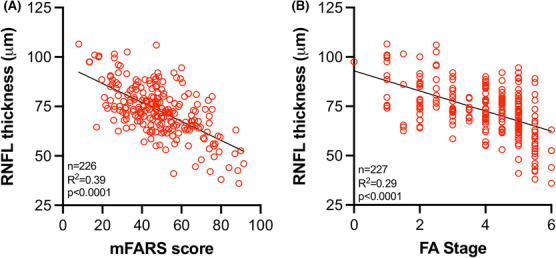
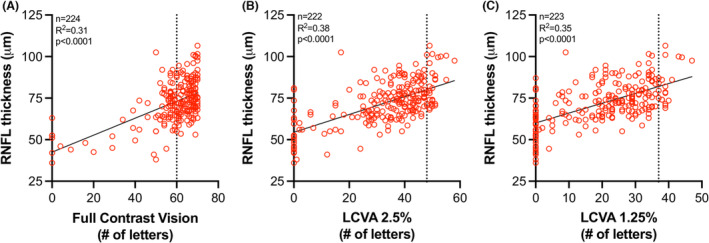
Methods: Using optical coherence tomography (OCT), we measured peripapillary retinal nerve fiber layer (RNFL) thickness in 198 people with FRDA, and 77 controls. Sloan letter charts were used to determine visual acuity. RNFL thickness and visual acuity were compared to measures of disease severity obtained from the Friedreich Ataxia Clinical Outcomes Measures Study (FACOMS).
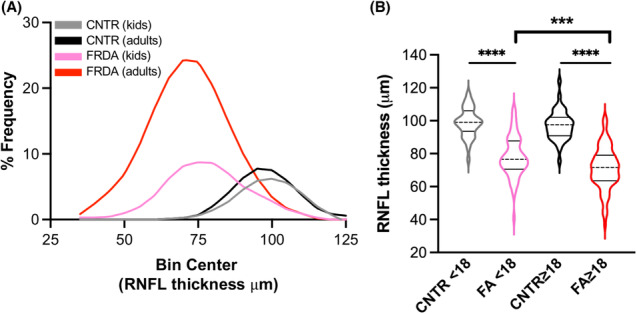
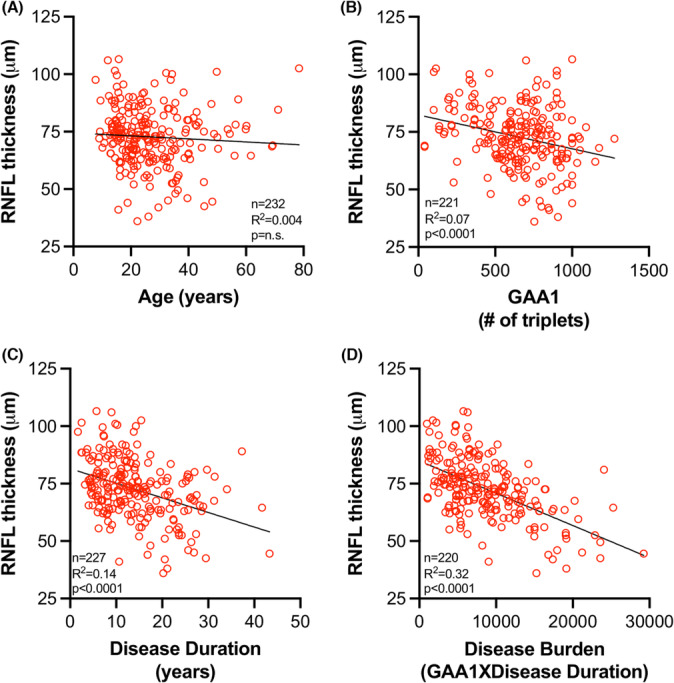
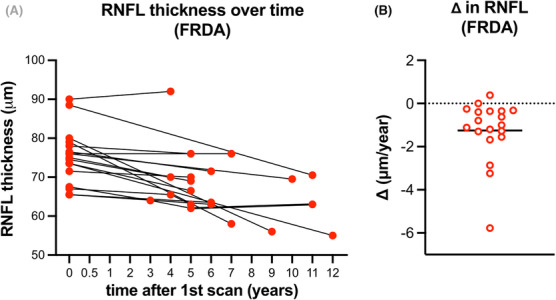
Results: The majority of patients, including children, had pathologically thin RNFLs (mean = 73 ± 13 μm in FRDA; 98 ± 9 μm in controls) and low-contrast vision deficits early in the disease course. Variability in RNFL thickness in FRDA (range: 36 to 107 μm) was best predicted by disease burden (GAA-TR length X disease duration). Significant deficits in high-contrast visual acuity were apparent in patients with an RNFL thickness of ≤68 μm. RNFL thickness decreased at a rate of -1.2 ± 1.4 μm/year and reached 68 μm at a disease burden of approximately 12,000 GAA years, equivalent to disease duration of 17 years for participants with 700 GAAs.
Interpretation: These data suggest that both hypoplasia and subsequent degeneration of the RNFL may be responsible for the optic nerve dysfunction in FRDA and support the development of a vision-directed treatment for selected patients early in the disease to prevent RNFL loss from reaching the critical threshold.
© 2023 The Authors. Annals of Clinical and Translational Neurology published by Wiley Periodicals LLC on behalf of American Neurological Association.
Conflict of interest statement
Nothing to report.
Figures
References
-
- Campuzano V, Montermini L, Molto MD, et al. Friedreich's ataxia: autosomal recessive disease caused by an intronic GAA triplet repeat expansion. Science. 1996;271(5254):1423‐1427. - PubMed
-
- Durr A, Cossee M, Agid Y, et al. Clinical and genetic abnormalities in patients with Friedreich's ataxia. N Engl J Med. 1996;335(16):1169‐1175. - PubMed
-
- Pandolfo M. Friedreich ataxia. Handb Clin Neurol. 2012;103:275‐294. - PubMed
-
- Pandolfo M. Friedreich ataxia: the clinical picture. J Neurol. 2009;256(Suppl 1):3‐8. - PubMed
Publication types
MeSH terms
LinkOut - more resources
Full Text Sources
Other Literature Sources
Medical
Miscellaneous
