

PRMT5 links lipid metabolism to contractile function of skeletal muscles
- PMID: 37334900
- PMCID: PMC10398672
- DOI: 10.15252/embr.202357306
PRMT5 links lipid metabolism to contractile function of skeletal muscles
Abstract
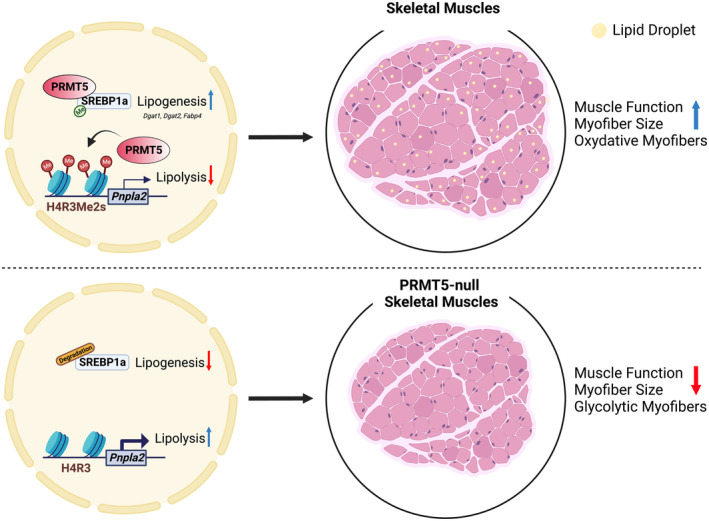
Skeletal muscle plays a key role in systemic energy homeostasis besides its contractile function, but what links these functions is poorly defined. Protein Arginine Methyl Transferase 5 (PRMT5) is a well-known oncoprotein but also expressed in healthy tissues with unclear physiological functions. As adult muscles express high levels of Prmt5, we generated skeletal muscle-specific Prmt5 knockout (Prmt5MKO ) mice. We observe reduced muscle mass, oxidative capacity, force production, and exercise performance in Prmt5MKO mice. The motor deficiency is associated with scarce lipid droplets in myofibers due to defects in lipid biosynthesis and accelerated degradation. Specifically, PRMT5 deletion reduces dimethylation and stability of Sterol Regulatory Element-Binding Transcription Factor 1a (SREBP1a), a master regulator of de novo lipogenesis. Moreover, Prmt5MKO impairs the repressive H4R3 symmetric dimethylation at the Pnpla2 promoter, elevating the level of its encoded protein ATGL, the rate-limiting enzyme catalyzing lipolysis. Accordingly, skeletal muscle-specific double knockout of Pnpla2 and Prmt5 normalizes muscle mass and function. Together, our findings delineate a physiological function of PRMT5 in linking lipid metabolism to contractile function of myofibers.
Keywords: lipid droplet; lipolysis; myofiber; posttranslational modification; protein arginine methyltransferase.
© 2023 The Authors. Published under the terms of the CC BY NC ND 4.0 license.
Conflict of interest statement
The authors declare that they have no conflict of interest.
Figures
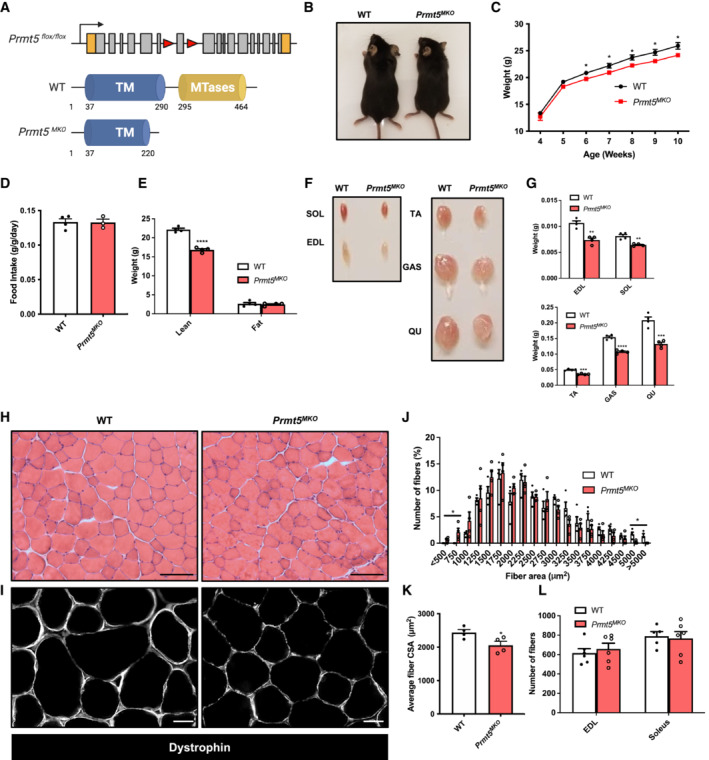
- A
Genetic targeting strategy showing skeletal muscle‐specific deletion of Prmt5 using the Cre‐LoxP recombinase under the control of the Myl1 promoter.
- B, C
Representative images of 2‐month‐old mice (B) and growth curves (C) of WT (n = 6) and Prmt5 MKO mice (n = 6).
- D
Food intake normalized to body weight in WT (n = 4) and Prmt5 MKO mice (n = 3).
- E
Lean and fat mass in WT (n = 4) and Prmt5 MKO mice (n = 4) determined by EcoMRI body composition analyzer.
- F
Photographs of skeletal muscles in 2‐month‐old WT and Prm5 MKO mice.
- G
The quantified weight of muscles (SOL, EDL, TA, GAS, QU) in 2‐month‐old WT (n = 4) and Prmt5 MKO mice (n = 4).
- H, I
Representative H&E (H) and dystrophin immunofluorescence of images of TA muscle cross‐sections in WT and Prmt5 MKO mice. Scale bar: 100 μm.
- J, K
Distribution of myofiber size (J) and average myofiber cross‐sectional area (CSA) (K) of WT (n = 4) and Prmt5 MKO TA muscles (n = 4).
- L
The total number of myofibers in EDL and Soleus from WT (n = 5) and Prmt5 MKO mice (n = 6).
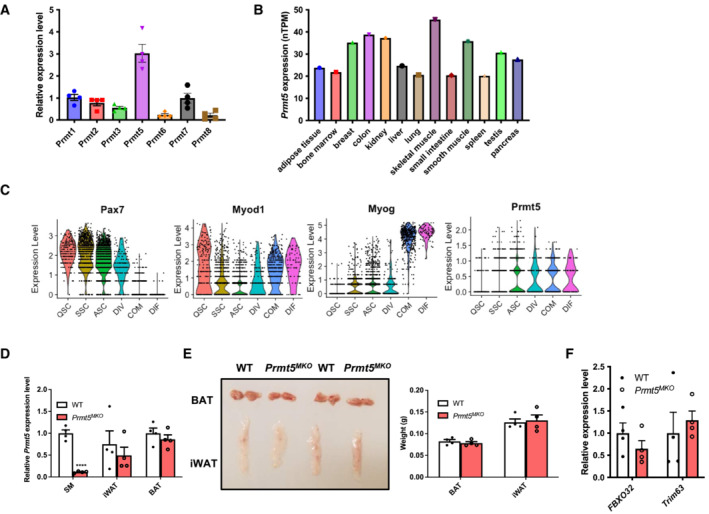
- A
Relative mRNA levels of Prmt isoforms from hindlimb muscles at postnatal day 4; (n = 4).
- B
Prmt5 mRNA levels across various human tissues.
- C
Violin plots showing the expression of Prmt5 and muscle satellite cell markers during differentiation.
- D
Relative mRNA expression of Prmt5 in skeletal muscle (SM), inguinal adipose tissue (iWAT), and brown adipose tissue (BAT) from WT and Prmt5 MKO mice; (n = 4, biological replicates).
- E
Representative images (left panel) and quantified weight (right panel) of non‐muscle tissue (iWAT and BAT) from WT and Prmt5 MKO mice; (n = 4, biological replicates).
- F
relative expression level of Atrogin‐1 and MuRF‐1 (encoded by FBX032 and Trim63 gene) in skeletal muscles from WT and Prmt5 MKO mice; (n = 4, technical replicates).
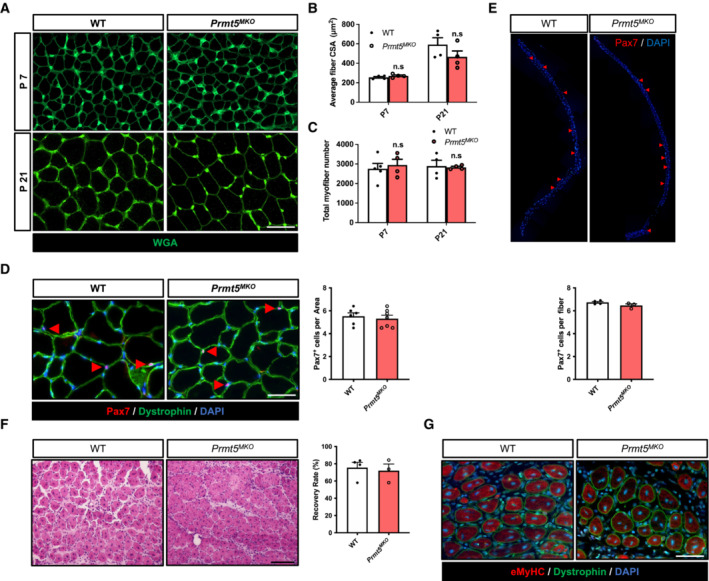
- A
Representative immunofluorescences of WGA staining in TA muscles cross‐sections at post‐natal day at 7 and 21 in WT and Prmt5 MKO mice. Scale bar: 100 μm.
- B, C
Average size (B) and total number (C) of myofiber in TA muscles at day 7 and 21 in WT (n = 5 for P7, n = 4 for P21) and Prmt5 MKO mice (n = 4 for P7, n = 4 for P21, biological replicates).
- D
A representative immunofluorescence of Pax7 and Dystrophin (left panel) and quantification of Pax7+ cells per area (right panel) in TA muscles from WT and Prmt5 MKO mice (n = 6). Scale bar: 100 μm.
- E
A representative immunofluorescence of Pax7 (upper panel) and quantification of Pax7+ cells per myofiber (bottom panel) in freshly isolated single myofibers from WT and Prmt5 MKO mice (n = 3).
- F
A representative H&E staining (left panel) and quantification of recovery rate (right panel) of TA muscles upon CTX injury at 5.5‐day and from WT (n = 4) and Prmt5 MKO mice (n = 3). Scale bar: 100 μm.
- G
A representative immunofluorescence of eMyHC and Dystrophin in injured TA muscles from WT and Prmt5 MKO mice. Scale bar: 100 μm.
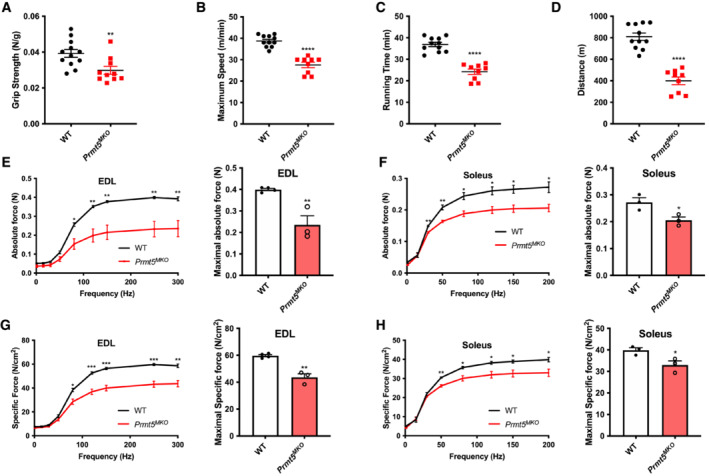
- A
Grip strength tests of WT and Prmt5 MKO mice assessed by grip force normalized to body weight WT (n = 12) and Prmt5 MKO mice (n = 10).
- B–D
Exercise performance of maximum speed (B), running time (C), running distance (D) of WT (n = 11) and Prmt5 MKO mice (n = 9) measured by treadmill.
- E, F
Absolute (E) and specific force (F) (on the left panel) and maximal absolute and specific force (on right panel) on EDL muscle from WT (n = 4) and Prmt5 MKO mice (n = 3).
- G, H
Absolute (G) and specific force (H) (on the left panel) and maximal absolute and specific force (on right panel) on Soleus muscle from WT (n = 4) and Prmt5 MKO mice (n = 3). Data information: The data are presented as mean ± SEM and the P‐values by two‐tailed ANOVA unpaired t‐test based on total number of biologically independent samples indicated in (A–H) (*P < 0.05, **P < 0.01, ***P < 0.001, ****P < 0.0001).
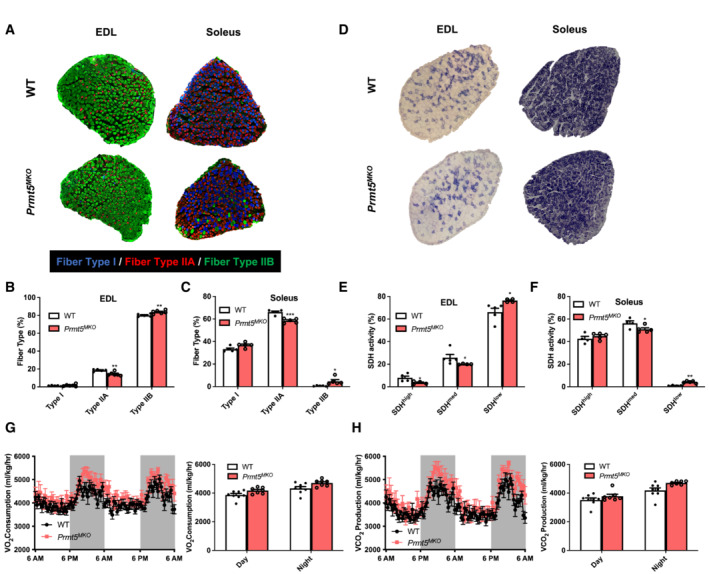
- A
Representative immunostaining of Type I, IIA, and IIB myofibers in in EDL and Soleus muscles of 2‐month‐old WT and Prmt5 MKO mice.
- B, C
Quantification of abundance of various fiber types in EDL (B) and Soleus (C) muscles of WT and Prmt5 MKO mice; (n = 5).
- D
Representative histochemical staining image of succinate dehydrogenase (SDH) enzymatic activity in EDL and Soleus muscles.
- E, F
Quantification of abundance of SDH‐low, ‐medium and ‐high myofibers in EDL (E) and Soleus (F) muscles of WT (n = 5) and Prmt5 MKO mice (n = 4).
- G, H
Metabolic rate of O2 consumption (G) and CO2 production (H) normalized to lean mass for a 48‐h cycle of 4–6‐month‐old WT (n = 8) and Prmt5 MKO (n = 7) mice measured by an indirect calorimetry.
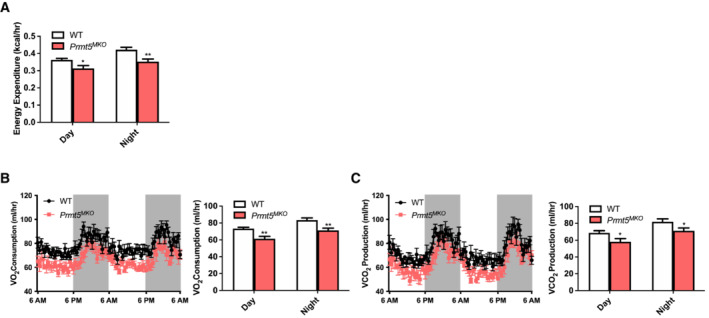
- A
Average day and night heat expenditure of 4–6‐month‐old WT (n = 8) and Prmt5 MKO (n = 7) mice over 48 h.
- B, C
Systemic metabolic rate of O2 consumption (VO2) (B) and CO2 production (VCO2) (C) of WT (n = 8) and Prmt5 MKO (n = 7) mice.
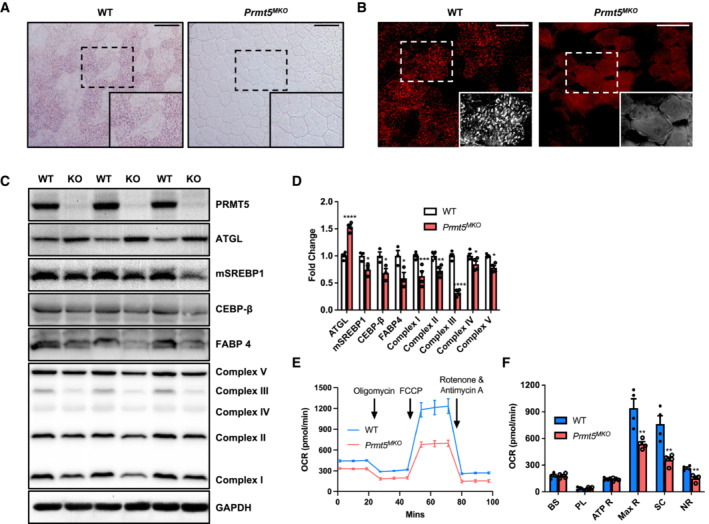
- A, B
Representative images of ORO staining (A) and immunofluorescence (B) in TA muscle from WT and Prmt5 MKO mice. Scale bar: 100 μm.
- C
Western blotting analysis for protein markers of lipolysis, lipogenesis, and electron transport chain (ETC) complexes in skeletal muscles of WT (n = 3) and Prmt5 MKO mice; (n = 3).
- D
Quantification of relative protein levels of ATGL, mSREBP1, CEBP‐β, FABP4, OXPHOS complexes (normalized to GAPDH) in skeletal muscles of WT and Prmt5 MKO mice; (n = 3).
- E
Seahorse analysis of oxygen consumption rate (OCR) in myotubes differentiated for 3‐days from myoblasts of 4‐week‐old WT and Prmt5 MKO mice; (n = 4).
- F
OCR was measured at basal state and after sequential addition of Oligomycin, FCCP, and Rotenone/Antimycin A to determine basal respiration (BS), proton leak (PL), ATP respiration (ATP R), maximal respiration (Max R), spare capacity (SC), and non‐mitochondrial respiration (NR); (n = 4, technical replicates).
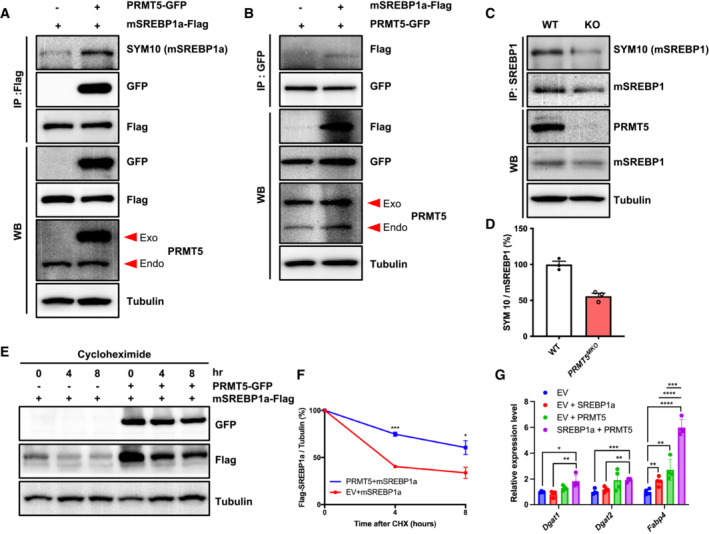
- A
C2C12 cells overexpressing PRMT5‐GFP alone or PRMT5‐GFP + SREBP1a‐Flag were immunoprecipitated with Flag antibody and blotted with SYM10, GFP, Flag, PRMT5, and Tubulin antibodies. Exo, exogenous (overexpressed); Endo, endogenous.
- B
C2C12 cells overexpressing SREBP1a‐Flag alone or SREBP1a‐Flag + PRMT5‐GFP were immunoprecipitated with GFP antibody and blotted with Flag, GFP, PRMT5, and Tubulin antibodies.
- C
Protein extracts of skeletal muscle isolated from WT and Prmt5 MKO mice were immunoprecipitated with SREBP1 antibody and immunoblotted with SYM10 (mSREBP1), SREBP1, PRMT5, and tubulin antibodies.
- D
Quantification of methylated mSREBP1 (normalized to total mSREBP1) in (C); (n = 3, biological replicates).
- E
HEK293 cells were transfected with PRMT5‐GFP alone or PRMT5‐GFP + SREBP1a‐Flag for 24 h, followed by cycloheximide (30 μg/ml) and protein analysis at 0, 4, 8 h. Lysates were immunoblotted with Flag, GFP, and tubulin antibodies.
- F
Intensity of Flag was normalized to tubulin, then normalized to 0 h; (n = 3, biological replicates).
- G
Relative expression of lipogenesis genes (Dgat1, Dgat2, Fabp4) in C2C12 transfected with PRMT5 and SREBP1a; (n = 4, technical replicates).
- A
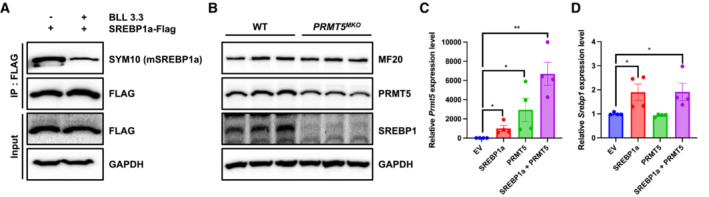
C2C12 cells overexpressing SREBP1a‐Flag were immunoprecipitated with Flag antibody in the absence or presence of BLL 3.3, PRMT5 inhibitor, and blotted with SYM10, Flag, GAPDH.
- B
Immunoblotting analysis showing the contents of SREBP1 protein levels in 3‐days differentiated myotube isolated from WT and Prmt5 MKO mice.
- C, D
Relative expression of Prmt5 (C) and Srebp1 (D) in C2C12 cells overexpressing SREBP1a along or together with PRMT5 (n = 4).
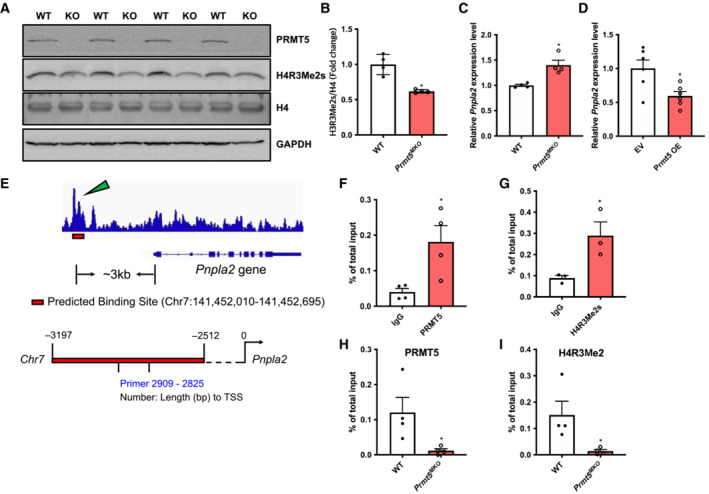
- A, B
Immunoblots showing symmetric demethylation of H4R3 in skeletal muscles of WT (n = 4) and Prmt5 MKO mice (n = 4) (A), and quantification of H4R3Me2s normalized to total H4 (B).
- C
Relative Pnpla2 levels in skeletal muscles of WT and Prmt5 MKO mice; (n = 4)
- D
Relative Pnpla2 levels in Prmt5‐overexpressed C2C12 myoblasts; (n = 6).
- E
ChIP‐sequencing results showing the Prmt5 binding peak on the Pnpla2 promoter of 3T3‐L1 cells.
- F, G
Enrichment of PRMT5 (F) and H4R3Me2s (G) on the proximal promoter region of the Pnpla2 gene in myotubes; (n = 4 for F, n = 3 for G, biological replicates).
- H, I
Enrichment of PRMT5 (H) and H4R3Me2s (I) on the proximal promoter region of the Pnpla2 gene in skeletal muscles of WT and Prmt5 MKO mice (n = 4 for H, and I, biological replicates).
- A, B
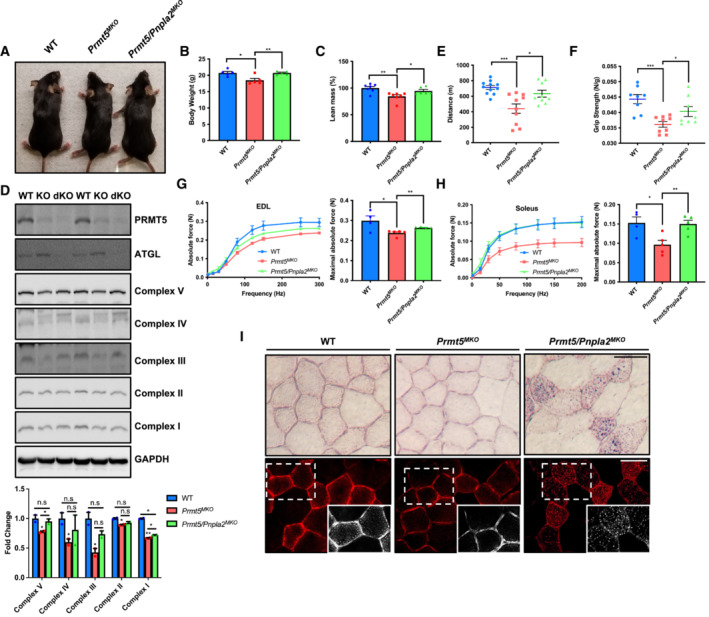
A representative images of whole body (A) and body weight (B) of WT (n = 6), Prmt5 MKO (n = 6), and Prmt5/Pnpla2 MKO mice (n = 6) at 8 weeks of age.
- C
Percentage of lean mass determined by body composition analyzer for WT (n = 6), Prmt5 MKO (n = 7) and Prmt5/Pnpla2 MKO mice (n = 6) at 8‐weeks‐old.
- D
Immunoblotting analysis showing PRMT5, ATGL and ETCs in muscle tissues (upper panel) and quantification of its relative protein levels in muscles of WT, Prmt5 MKO , and Prmt5/Pnpla2 MKO mice (bottom panel) (n = 2, biological replicates).
- E, F
Exercise performance in running distance (E) and griping strength test (F) in WT (n = 11 for E, n = 8 for F), Prmt5 MKO (n = 10 for E, n = 9 for F) and Prmt5/Pnpla2 MKO mice (n = 9 for E, n = 8 for F).
- G, H
Absolute force (left panel) and maximal absolute force (right panel) of EDL (G) and Soleus (H) muscles of WT (n = 4), Prmt5 MKO (n = 5) and Prmt5/Pnpla2 MKO mice (n = 5).
- I
Representative images of ORO staining in TA muscles under brightfield (upper panel) and fluorescent imaging (bottom panel) from WT, Prmt5 MKO , and Prmt5/Pnpla2 MKO mice. Scale bar: 50 μm.
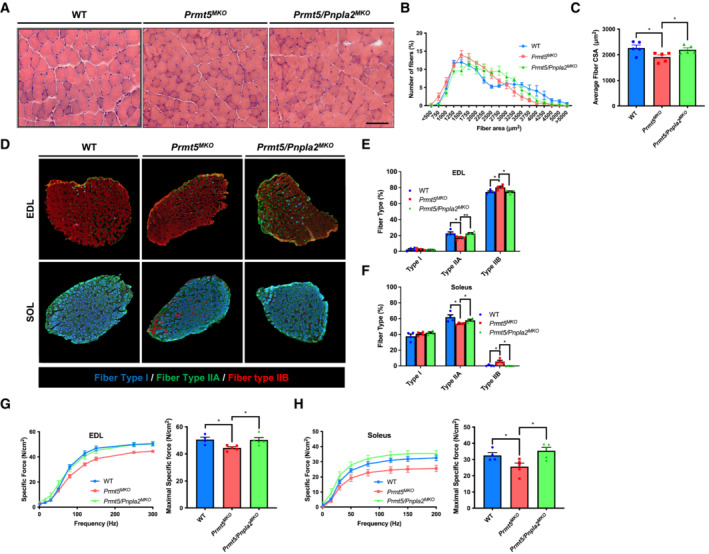
- A–C
A Representative H&E staining, (A) distribution (B) and average (C) of myofiber CSA in TA muscles from WT, Prmt5 MKO and Prmt5/Pnpla2 MKO mice; (n = 5). Scale bar: 100 μm.
- D
Representative immunofluorescent fiber type staining (fiber type I, fiber type IIA, fiber type IIB) of 2–3‐month‐old WT, Prmt5 MKO and Prmt5/Pnpla2 MKO mice.
- E, F
Quantification of stained 3 fiber type in EDL (E) and Soleus (F) muscles from WT, Prmt5 MKO and Prmt5/Pnpla2 MKO mice; (n = 4).
- G, H
A graph of specific force (left panel) and maximal specific force (right panel) of EDL (G) and Soleus (H) muscles from WT (n = 4), Prmt5 MKO mice (n = 5) and Prmt5/Pnpla2 MKO mice (n = 5).
References
-
- Ancelin K, Lange UC, Hajkova P, Schneider R, Bannister AJ, Kouzarides T, Surani MA (2006) Blimp1 associates with Prmt5 and directs histone arginine methylation in mouse germ cells. Nat Cell Biol 8: 623–630 - PubMed
-
- Bassel‐Duby R, Olson EN (2006) Signaling pathways in skeletal muscle remodeling. Annu Rev Biochem 75: 19–37 - PubMed
Publication types
MeSH terms
Substances
Grants and funding
LinkOut - more resources
Full Text Sources
Molecular Biology Databases
Research Materials
