. 2023 Aug 15;44(12):4545-4560.
doi: 10.1002/hbm.26398. Epub 2023 Jun 19.

Neural dissociation between reward and salience prediction errors through the lens of optimistic bias

Affiliations

Neural dissociation between reward and salience prediction errors through the lens of optimistic bias

Ya Zheng et al. Hum Brain Mapp. .

Abstract

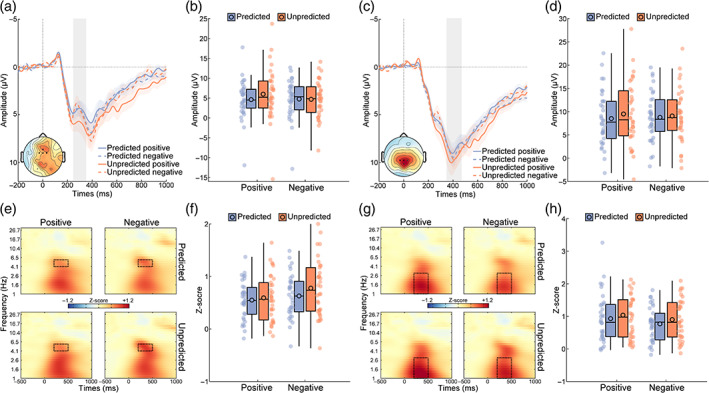
The question of how the brain represents reward prediction errors is central to reinforcement learning and adaptive, goal-directed behavior. Previous studies have revealed prediction error representations in multiple electrophysiological signatures, but it remains elusive whether these electrophysiological correlates underlying prediction errors are sensitive to valence (in a signed form) or to salience (in an unsigned form). One possible reason concerns the loose correspondence between objective probability and subjective prediction resulting from the optimistic bias, that is, the tendency to overestimate the likelihood of encountering positive future events. In the present electroencephalography (EEG) study, we approached this question by directly measuring participants' idiosyncratic, trial-to-trial prediction errors elicited by subjective and objective probabilities across two experiments. We adopted monetary gain and loss feedback in Experiment 1 and positive and negative feedback as communicated by the same zero-value feedback in Experiment 2. We provided electrophysiological evidence in time and time-frequency domains supporting both reward and salience prediction error signals. Moreover, we showed that these electrophysiological signatures were highly flexible and sensitive to an optimistic bias and various forms of salience. Our findings shed new light on multiple presentations of prediction error in the human brain, which differ in format and functional role.

Keywords: EEG dynamics; optimistic bias; reward prediction error; salience prediction error.


Conflict of interest statement

The authors declare no conflicts of interest.

Figures

FIGURE 1
FIGURE 1
Overview about trial structure of the reward prediction task in Experiment 1 (a) and Experiment 2 (b), as well as the percentages of positive prediction during the task (left) and positive estimation after the task (right) in Experiment 1 (c) and Experiment 2 (d,e). The boxplots indicate the median and the first and third quartiles, and the colored dots and black circles indicate mean values for each participant and across participants, respectively. ISI, interstimulus interval; ITI, intertrial interval.
FIGURE 2
FIGURE 2
Subject prediction effects on time and time‐frequency domain data from Experiment 1. (a) Grand‐averaged event‐related potential (ERP) waveforms over frontocentral areas. (b) Stripcharts and boxplots of amplitude data for the feedback‐related negativity (FRN). (c,d) same as (a,b), except that ERP waveforms represent an average across electrodes over centroparietal areas, and data points represent amplitude data for the P3b. (e) Time‐frequency representations of electroencephalography power at FCz. (f) Stripcharts and boxplots of power data for theta oscillation. (g,h) same as (e,f), except that the time‐frequency plots represent an average at CPz, and data points represent power data for delta oscillation. For the ERP waveforms, the shaded error bars indicate standard error of the mean across participants, and shaded vertical bars represent time windows used for quantification. Topographical maps show scalp distributions of the FRN (gains minus losses) and the P3b across conditions. For the time‐frequency plots, the black boxes depict time‐frequency windows used for quantification. For the boxplots, black circles indicate mean values across participants.
FIGURE 3
FIGURE 3
Objective prediction effects on time and time‐frequency domain data from Experiment 1. (a) Grand‐averaged event‐related potential (ERP) waveforms over frontocentral areas. (b) Stripcharts and boxplots of amplitude data for the feedback‐related negativity (FRN). (c,d) same as (a,b), except that ERP waveforms represent an average across electrodes over centroparietal areas, and data points represent amplitude data for the P3b. (e) Time‐frequency representations of electroencephalography power at FCz. (f) Stripcharts and boxplots of power data for theta oscillation. (g,h) same as (e,f), except that the time‐frequency plots represent an average at CPz, and data points represent power data for delta oscillation. For the ERP waveforms, the shaded error bars indicate standard error of the mean across participants, and shaded vertical bars represent time windows used for quantification. Topographical maps show scalp distributions of the FRN (gains minus losses) and the P3b across conditions. For the time‐frequency plots, the black boxes depict time‐frequency windows used for quantification. For the boxplots, black circles indicate mean values across participants.
FIGURE 4
FIGURE 4
Subjective prediction effects on time and time‐frequency domain data from Experiment 2. (a) Grand‐averaged event‐related potential (ERP) waveforms over frontocentral areas. (b) Stripcharts and boxplots of amplitude data for the feedback‐related negativity (FRN). (c,d) same as (a,b), except that ERP waveforms represent an average across electrodes over centroparietal areas, and data points represent amplitude data for the P3b. (e) Time‐frequency representations of EEG power at FCz. (f) Stripcharts and boxplots of power data for theta oscillation. (g,h) same as (e,f), except that the time‐frequency plots represent an average at CPz, and data points represent power data for delta oscillation. For the ERP waveforms, the shaded error bars indicate standard error of the mean across participants, and shaded vertical bars represent time windows used for quantification. Topographical maps show scalp distributions of the FRN (positive minus negative) and the P3b across conditions. For the time‐frequency plots, the black boxes depict time‐frequency windows used for quantification. For the boxplots, black circles indicate mean values across participants.
FIGURE 5
FIGURE 5
Objective prediction effects on time and time‐frequency domain data from Experiment 2. (a) Grand‐averaged event‐related potential (ERP) waveforms over frontocentral areas. (b) Stripcharts and boxplots of amplitude data for the feedback‐related negativity (FRN). (c,d) same as (a,b), except that ERP waveforms represent an average across electrodes over centroparietal areas, and data points represent amplitude data for the P3b. (e) Time‐frequency representations of EEG power at FCz. (f) Stripcharts and boxplots of power data for theta oscillation. (g,h) same as (e,f), except that the time‐frequency plots represent an average at CPz, and data points represent power data for delta oscillation. For the ERP waveforms, the shaded error bars indicate standard error of the mean across participants, and shaded vertical bars represent time windows used for quantification. Topographical maps show scalp distributions of the FRN (positive minus negative) and the P3b across conditions. For the time‐frequency plots, the black boxes depict time‐frequency windows used for quantification. For the boxplots, black circles indicate mean values across participants.

Similar articles

Cited by

References

    1. Alexander, W. H. , & Brown, J. W. (2011). Medial prefrontal cortex as an action‐outcome predictor. Nature Neuroscience, 14(10), 1338–1344. 10.1038/nn.2921 - DOI - PMC - PubMed
    1. Alves, H. , Koch, A. , & Unkelbach, C. (2017). Why good is more alike than bad: Processing implications. Trends in Cognitive Sciences, 21(2), 69–79. 10.1016/j.tics.2016.12.006 - DOI - PubMed
    1. Bates, D. , Kliegl, R. , Vasishth, S. , & Baayen, H. (2015). Parsimonious mixed models. arXiv, 1506. https://arxiv.org/abs/1506.04967.
    1. Bates, D. , Maechler, M. , Bolker, B. , & Walker, S. (2015). Fitting linear mixed‐effects models using lme4. Journal of Statistical Software, 67(1), 1–48. 10.18637/jss.v067.i01 - DOI
    1. Bellebaum, C. , & Daum, I. (2008). Learning‐related changes in reward expectancy are reflected in the feedback‐related negativity. The European Journal of Neuroscience, 27(7), 1823–1835. 10.1111/j.1460-9568.2008.06138.x - DOI - PubMed

Publication types