

Exploring the relationship between epigenetic DNA methylation and cardiac fibrosis through Raman microspectroscopy
- PMID: 37335025
- PMCID: PMC10393323
- DOI: 10.1152/ajpcell.00209.2023
Exploring the relationship between epigenetic DNA methylation and cardiac fibrosis through Raman microspectroscopy
Abstract
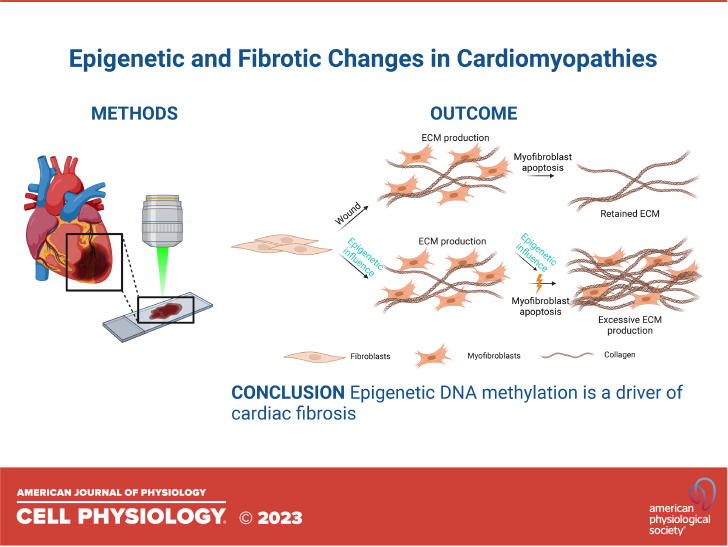
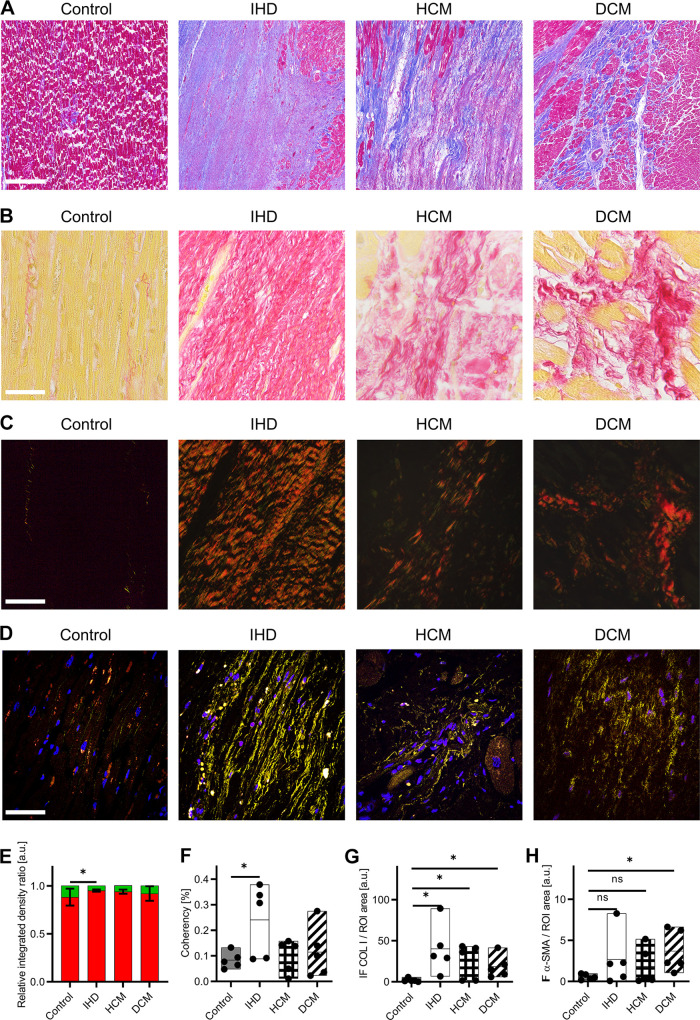
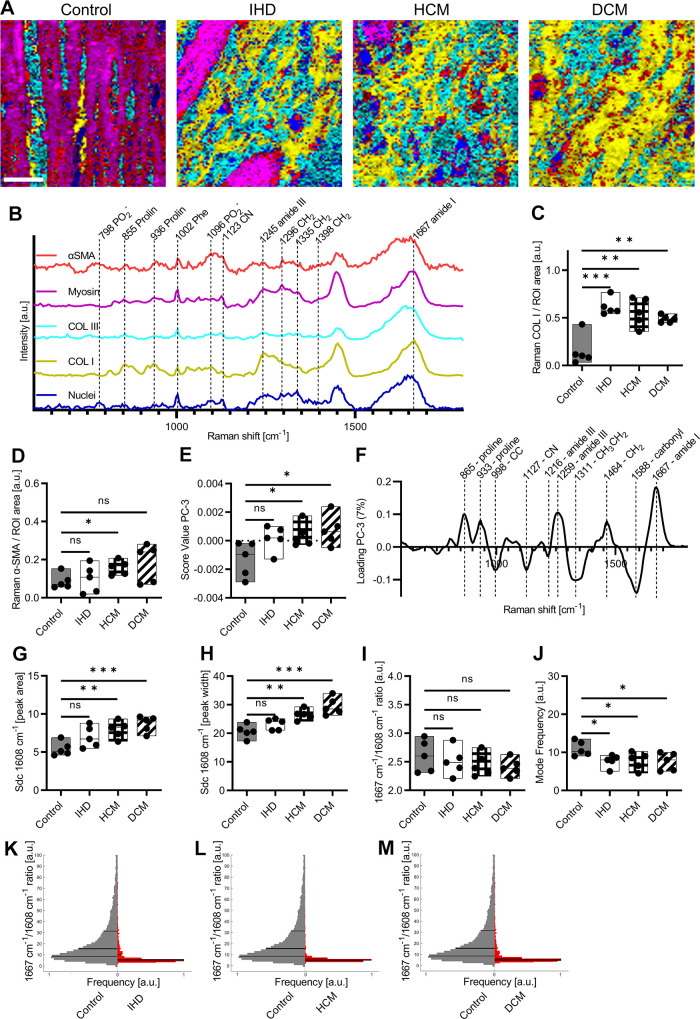
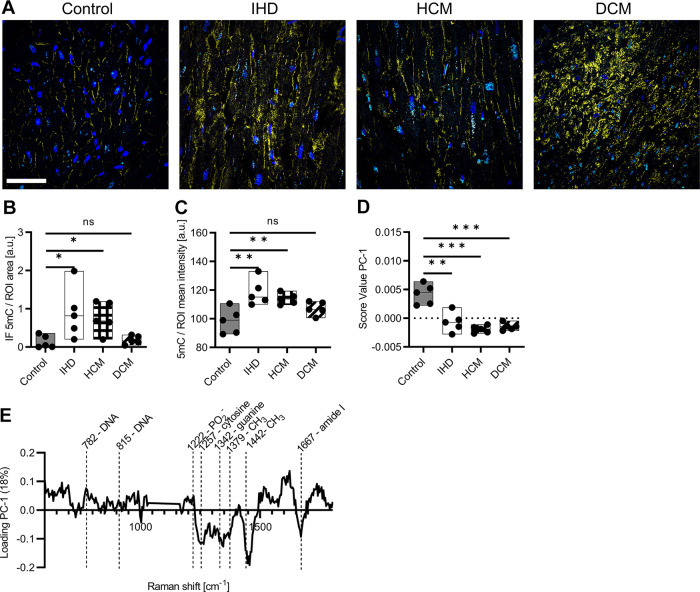
Cardiomyopathies are associated with fibrotic remodeling of the heart, which is characterized by the excessive accumulation of collagen type I (COL I) due to chronic inflammation and suspected epigenetic influences. Despite the severity and high mortality rate of cardiac fibrosis, current treatment options are often inadequate, underscoring the importance of gaining a deeper understanding of the disease's underlying molecular and cellular mechanisms. In this study, the extracellular matrix (ECM) and nuclei in fibrotic areas of different cardiomyopathies were molecularly characterized by Raman microspectroscopy and imaging and compared with the control myocardium. Patient samples were obtained from heart tissue affected by ischemia, hypertrophy, and dilated cardiomyopathy and analyzed for fibrosis through conventional histology and marker-independent Raman microspectroscopy (RMS). Prominent differences between control myocardium and cardiomyopathies were revealed by spectral deconvolution of COL I Raman spectra. Statistically significant differences were identified in the amide I region of spectral subpeak at 1,608 cm-1, which is a representative endogenous marker for alterations in the structural conformation of COL I fibers. Moreover, epigenetic 5mC DNA modification was identified within cell nuclei by multivariate analysis. A statistically significant increase in signal intensities of spectral features indicative of DNA methylation was detected in cardiomyopathies in accordance with immunofluorescence 5mC staining. Overall, RMS is a versatile technology in the discrimination of cardiomyopathies based on molecular evaluation of COL I and nuclei while providing insights into the pathogenesis of the diseases.NEW & NOTEWORTHY Cardiomyopathies are associated with severe fibrotic remodeling of the heart, which is characterized by the excessive accumulation of collagen type I (COL I). In this study, we used marker-independent Raman microspectroscopy (RMS) to gain a deeper understanding of the disease's underlying molecular and cellular mechanisms.
Keywords: Raman spectroscopy; collagen; extracellular matrix; non-destructive imaging; pathological tissue remodeling.
Conflict of interest statement
No conflicts of interest, financial or otherwise, are declared by the authors.
Figures
Similar articles
-
Raman microspectroscopy identifies fibrotic tissues in collagen-related disorders via deconvoluted collagen type I spectra.Acta Biomater. 2023 May;162:278-291. doi: 10.1016/j.actbio.2023.03.016. Epub 2023 Mar 16. Acta Biomater. 2023. PMID: 36931422
-
Epigenetics-based therapeutics for myocardial fibrosis.Life Sci. 2021 Apr 15;271:119186. doi: 10.1016/j.lfs.2021.119186. Epub 2021 Feb 9. Life Sci. 2021. PMID: 33577852 Review.
-
Epigenetic signatures in cardiac fibrosis, special emphasis on DNA methylation and histone modification.Heart Fail Rev. 2018 Sep;23(5):789-799. doi: 10.1007/s10741-018-9694-z. Heart Fail Rev. 2018. PMID: 29607455 Review.
-
Epigenetics in Reactive and Reparative Cardiac Fibrogenesis: The Promise of Epigenetic Therapy.J Cell Physiol. 2017 Aug;232(8):1941-1956. doi: 10.1002/jcp.25699. Epub 2017 Feb 28. J Cell Physiol. 2017. PMID: 27883184 Review.
-
Epigenetic Therapy for the Treatment of Hypertension-Induced Cardiac Hypertrophy and Fibrosis.J Cardiovasc Pharmacol Ther. 2016 Jan;21(1):127-37. doi: 10.1177/1074248415591698. Epub 2015 Jun 30. J Cardiovasc Pharmacol Ther. 2016. PMID: 26130616
Cited by
-
Methylations in dilated cardiomyopathy and heart failure.Front Cardiovasc Med. 2025 Apr 11;12:1559550. doi: 10.3389/fcvm.2025.1559550. eCollection 2025. Front Cardiovasc Med. 2025. PMID: 40290189 Free PMC article. Review.
-
Advancements and future directions in American Journal of Physiology-Cell Physiology: a 2024 editorial update.Am J Physiol Cell Physiol. 2024 Dec 1;327(6):C1681-C1685. doi: 10.1152/ajpcell.00862.2024. Am J Physiol Cell Physiol. 2024. PMID: 39651915 No abstract available.
-
The Role of Selected Epigenetic Pathways in Cardiovascular Diseases as a Potential Therapeutic Target.Int J Mol Sci. 2023 Sep 6;24(18):13723. doi: 10.3390/ijms241813723. Int J Mol Sci. 2023. PMID: 37762023 Free PMC article. Review.
-
Marker-independent vibrational spectroscopy imaging recognizes the hypoxia effect in the human brain endothelium.Sci Rep. 2025 Jul 18;15(1):26112. doi: 10.1038/s41598-025-11000-2. Sci Rep. 2025. PMID: 40681622 Free PMC article.
References
Publication types
MeSH terms
Substances
Associated data
LinkOut - more resources
Full Text Sources
Medical