. 2023 Jun 2:(196):10.3791/65228.
doi: 10.3791/65228.

A Lightweight Drive Implant for Chronic Tetrode Recordings in Juvenile Mice

Affiliations

A Lightweight Drive Implant for Chronic Tetrode Recordings in Juvenile Mice

Robert J Pendry et al. J Vis Exp. .

Abstract

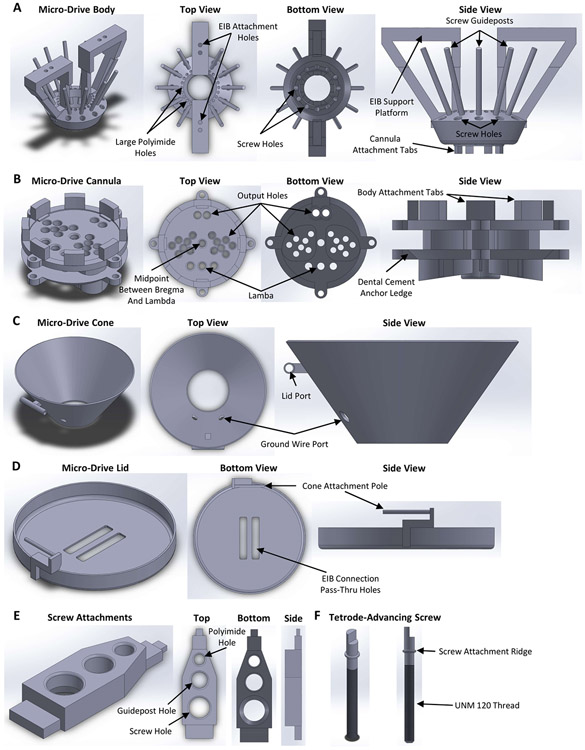
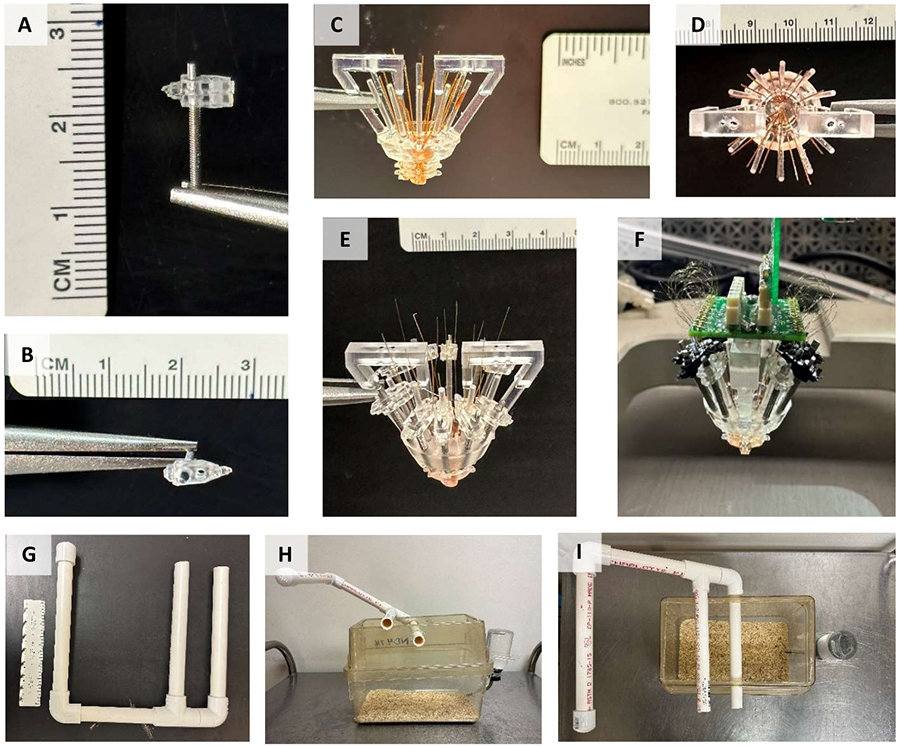
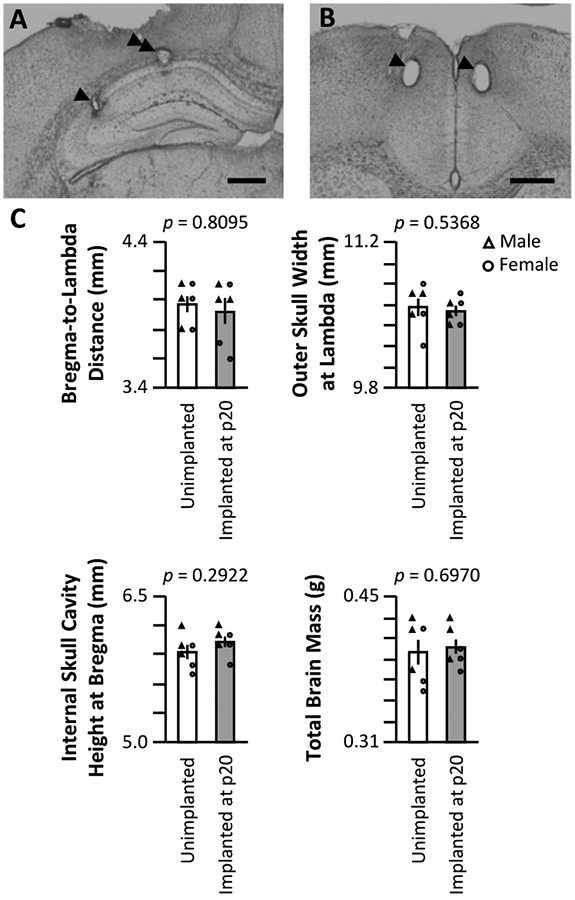
In vivo electrophysiology provides unparalleled insight into the sub-second-level circuit dynamics of the intact brain and represents a method of particular importance for studying mouse models of human neuropsychiatric disorders. However, such methods often require large cranial implants, which cannot be used in mice at early developmental time points. As such, virtually no studies of in vivo physiology have been performed in freely behaving infant or juvenile mice, despite the fact that a better understanding of neurological development in this critical window would likely provide unique insights into age-dependent developmental disorders such as autism or schizophrenia. Here, a micro-drive design, surgical implantation procedure, and post-surgery recovery strategy are described that allow for chronic field and single-unit recordings from multiple brain regions simultaneously in mice as they age from postnatal day 20 (p20) to postnatal day 60 (p60) and beyond, a time window roughly corresponding to the human ages of 2 years old through to adulthood. The number of recording electrodes and final recording sites can be easily modified and expanded, thus allowing flexible experimental control of the in vivo monitoring of behavior- or disease-relevant brain regions across development.


Figures

Figure 1:
Figure 1:. Micro-drive components.
Three-dimensional renderings of the (A) micro-drive body, (B) cannula, (C) cone, (D) lid, (E) screw attachments, and (F) tetrode-advancing screw. The critical features of each component are indicated. Measurement details can be extracted from the model files available at https://github.com/Brad-E-Pfeiffer/JuvenileMouseMicroDrive/.
Figure 2:
Figure 2:. Micro-drive construction.
(A) Side and (B) top view of the tetrode-advancing screw with the top and bottom screw attachments connected. (C) Side and (D) top view of the micro-drive with the body and cannula attached and the large polyimide tubing running through each cannula hole and trimmed to the bottom of the cannula. (E) Side view of the microdrive with the screws and small polyimide tubing in place. The tops of the small polyimide tubes are trimmed immediately prior to tetrode loading. (F) Completed micro-drive attached to the stereotaxic apparatus. The protective cone that would normally surround the micro-drive has been removed for visualization purposes. Note that some of the screw attachments were printed in a black resin for this micro-drive. (G) Counterbalance support system. (H)Side and (I) top view of a mouse cage with the counterbalance support system attached.
Figure 3:
Figure 3:. Representative electrophysiological recordings.
A p20 mouse was implanted with a micro-drive as described above. Starting on p21 and every day thereafter for 2 weeks, the mouse was attached to the recording apparatus, and neural activity was recorded for at least 1 h. (A) Raw local field potential (LFP) recordings from the bilateral (L = left; R = right) anterior cingulate cortex (ACC), hippocampal area CA3 (CA3), and hippocampal area CA1 (CA1). The data were collected every day; for clarity, only data from odd days are displayed. All traces were taken during periods of immobility in the home cage. Scale bar: 1 mV, 2 s. (B) Representative single units isolated from hippocampal area CA3 (left) and CA1 (right) for the recordings in panel A. All the raw waveforms on each electrode are shown in black; the average is in red. Scale bar: 50 μV, 0.2 ms. (C) Representative raw LFP traces for every 10th day until the final recording day at p60 for a second mouse implanted at p20. The data were collected every day; for clarity, only data from every 10th day are displayed. All the traces were taken during periods of immobility in the home cage. Scale bar: 1 mV, 2 s.
Figure 4.
Figure 4.. Stability of the chronic recordings.
A p20 mouse was implanted with a micro-drive, as described above. Starting on p21 and thereafter for 4 weeks, the mouse was attached to the recording apparatus, and neural activity was recorded for at least 1 h. Shown are data from the tetrodes targeting dorsal hippocampal CA1. (A) Raw (top) and ripple-filtered (bottom) LFP for identified ripple events at p21, p30, and p40. To identify ripple events, the raw LFP was band-pass filtered between 125 Hz and 300 Hz, and the ripple events were identified as transient increases in the ripple-band power greater than 3 standard deviations above the mean. The start and end of each ripple were defined as the point when the ripple band power returned to the mean. The identified ripples are shown in red. Scale bar: 100 ms, top-to-bottom: 1,000 μV, 140 μV, 1,800 μV, 180 μV, 9,000 μV, 1,200 μV, 10,000 μV, 1,000 μV. (B) A representative single unit from each day from the CA1-targeted tetrode for the recordings in panel A. All raw waveforms on each electrode are shown in black; the average is in red. Scale bar 0.2 ms, top-to-bottom: 50 μV, 100 μV, 100 μV. (C) Autocorrelogram of all spikes for single units in panel B. These data demonstrate stable electrode placement within the hippocampal pyramidal layer across several weeks.
Figure 5:
Figure 5:. Representative histology and impact on skull development.
A p20 mouse was implanted with a micro-drive, as described above. Following the final recording day on p60, electrolytic lesions were produced at the recording sites, and the brain was perfused with 4% paraformaldehyde. To identify the recording sites, 50 μm sections were produced. (A) Lesions in CA1 and CA3 of the hippocampus. The arrowhead denotes the CA3 recording site; the double-arrowhead denotes the CA1 recording site. Scale bar: 0.5 mm. (B) Lesions in the bilateral ACC. The arrowheads denote the ACC recording sites. Scale bar: 0.5 mm. (C) Skull size and brain mass measurements of p62 mice implanted with a micro-drive at p20 (gray) and unimplanted littermates (white). The p-value of the Wilcoxon rank-sum test is reported for each measurement.

Update of

Similar articles

References

    1. Konrad K, Firk C, Uhlhaas PJ Brain development during adolescence. Deutsches Arzteblatt International. 110 (25), 425–431 (2013). - PMC - PubMed
    1. Silbereis JC, Pochareddy S, Zhu Y, Li M, Sestan N The cellular and molecular landscapes of the developing human central nervous system. Neuron. 89 (2), 248–268 (2016). - PMC - PubMed
    1. Semple BD, Blomgren K, Gimlin K, Ferriero DM, Noble-Haeusslein LJ Brain development in rodents and humans: Identifying benchmarks of maturation and vulnerability to injury across species. Progress in Neurobiology. 106-107, 1–16 (2013). - PMC - PubMed
    1. Volk L, Chiu S-L, Sharma K, Huganir RL Glutamate synapses in human cognitive disorders. Annual Review of Neuroscience. 38, 127–149 (2015). - PubMed
    1. Lord C. et al. Autism spectrum disorder. Nature Reviews Disease Primers. 6, 5 (2020). - PMC - PubMed

Publication types