. 2023 Sep;21(9):1887-1903.
doi: 10.1111/pbi.14101. Epub 2023 Jun 19.

Metabolic and transcriptomic study of pennycress natural variation identifies targets for oil improvement

Affiliations

Metabolic and transcriptomic study of pennycress natural variation identifies targets for oil improvement

Cintia Lucía Arias et al. Plant Biotechnol J. 2023 Sep.

Abstract

Pennycress (Thlaspi arvense L.), a member of the Brassicaceae family, produces seed oil high in erucic acid, suitable for biodiesel and aviation fuel. Although pennycress, a winter annual, could be grown as a dedicated bioenergy crop, an increase in its seed oil content is required to improve its economic competitiveness. The success of crop improvement relies upon finding the right combination of biomarkers and targets, and the best genetic engineering and/or breeding strategies. In this work, we combined biomass composition with metabolomic and transcriptomic studies of developing embryos from 22 pennycress natural variants to identify targets for oil improvement. The selected accession collection presented diverse levels of fatty acids at maturity ranging from 29% to 41%. Pearson correlation analyses, weighted gene co-expression network analysis and biomarker identifications were used as complementary approaches to detect associations between metabolite level or gene expression and oil content at maturity. The results indicated that improving seed oil content can lead to a concomitant increase in the proportion of erucic acid without affecting the weight of embryos. Processes, such as carbon partitioning towards the chloroplast, lipid metabolism, photosynthesis, and a tight control of nitrogen availability, were found to be key for oil improvement in pennycress. Besides identifying specific targets, our results also provide guidance regarding the best timing for their modification, early or middle maturation. Thus, this work lays out promising strategies, specific for pennycress, to accelerate the successful development of lines with increased seed oil content for biofuel applications.

Keywords: Thlaspi arvense; biomass; embryo; jet fuel; metabolomics; transcriptomic.


Conflict of interest statement

The authors declare no conflict of interest.

Figures

Figure 1
Figure 1
Pennycress vegetative and reproductive organs, and experimental workflow. Typical pennycress plant at reproductive stage (a), flower at 1 day after pollination (DAP, b), immature pod at 16DAP (c), and mature pod at approximately 28DAP (d) are shown. (e) Sample collection and analyses.
Figure 2
Figure 2
Natural variation in seed biomass composition at maturity. (a) Biomass expressed as micrograms per embryo, where the total height of the bar corresponds to the embryo weight (μg) and the lines are ordered from the highest to the lowest μg oil per embryo. (b) Biomass expressed as a percentage (mg/100 mg DW) and the lines are ordered from the highest to the lowest percentage of oil. (c) Each fatty acid is expressed as a percentage of total FA content and the lines are ordered from the highest to the lowest percentage of erucic acid content. FA: Fatty acids, Prot: Proteins, and Others: refers to the remaining biomass content regarding the embryo weight or to 100% in A and B respectively. C16:0, palmitic acid; C18:0, stearic acid; C18:1, oleic acid; C18:2, linoleic acid; C18:3, α‐linolenic acid; C20:0, arachidonic acid; C20:1, gondoic acid; C20:2, eicosadienoic acid; C22:1, erucic acid C22:2, docosadienoic acid; and 24:1, nervonic acid. Four biological replicates were used in each case. Error bars represent the standard deviation.
Figure 3
Figure 3
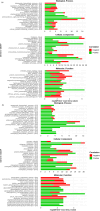
Gene ontology functional classification of genes whose level of expression correlates with the content of FAMat. The list of genes used corresponds to the Arabidopsis homologues. Top twenty significant processes (P‐value < 0.05) from each of the three categories, Biological Processes, Cellular Compartment and Molecular Function are shown in (a) and (b) for the genes at 10 and 16DAP, respectively. The bars were divided according to the proportion of the genes that showed positive (green) or negative (red) correlation in each individual category, and in parentheses, at the beginning of each bar, the actual number of genes that were positive/negative correlated is shown.
Figure 4
Figure 4
Gene ontology classification and hub genes identification for the four modules whose eigengene presented a significant correlation with FAMat at 16DAP. For each module associated with FAMat (Light‐green, Honeydew1, Floral‐white and Salmon4), the Pearson correlation coefficient (r), adjusted P‐value, number of genes in the module, the most enriched Biological Processes, and top 10 genes according to the score on the topological analysis Maximal Clique Centrality (MCC) are presented. These selected nodes are shown with a colour scheme where red indicates the most essential genes. GO, gene ontology.
Figure 5
Figure 5
Lipid metabolism in developing pennycress embryos. Transcript levels correlated with FAMat are shown with squares. Positive, negative, and no correlation are highlighted by filling the symbols with red, blue, and white, respectively. For each transcript level, the left symbol corresponds to 10DAP, and the right one to 16DAP. The * symbol was used to highlight the hub genes identified by MCC analysis at 16DAP. Scheme adapted from Li‐Beisson et al. (2013). AACT, acetoacetyl‐CoA thiolase (*Ta1.0_14178); AAE acyl activating enzyme (Ta1.0_01787 and Ta1.0_10844); ABMM, ATP binding microtubule motor family protein (Ta1.0_24750); ACBP, acyl‐CoA binding protein (Ta1.0_22173, *Ta1.0_01446); ACCc, cytosolic acetyl‐CoA carboxylase (Ta1.0_04259); ACT2, actin 2 (Ta1.0_16104 and Ta1.0_01238); ADF, actin depolymerizing factor (ADF4: Ta1.0_26108 and ADF6: Ta1.0_25986); ALT, acyl‐lipid thioesterase (Ta1.0_10189); ATK5, kinesin 5 (Ta1.0_21808); DAG, diacylglycerol; DAGL, diacylglycerol lipase; DGAT, acyl‐CoA: diacylglycerol acyltransferase (Ta1.0_22867 and Ta1.0_05088); DHAP, dihydroxyacetone phosphate; ECI, Enoyl‐CoA isomerase (Ta1.0_22882); ER, enoyl‐ACP reductase; erLACS, ER long‐chain acyl‐CoA synthetase (Ta1.0_10536); FAE, fatty acid elongase; FAS, fatty acid synthase; FATA (B), fatty acyl thioesterase A (B); FFA, free fatty acid; G3PDH, glycerol 3‐phosphate dehydrogenase (Ta1.0_18945); GK, glycerol kinase (Ta1.0_08946); GPAT, glycerol 3‐phosphate acyltransferase (Ta1.0_09794); HAD, hydroxyacyl‐ACP dehydrase (Ta1.0_00919 and Ta1.0_20755); KAR, ketoacyl‐ACP reductase (Ta1.0_12150); KAS, ketoacyl‐ACP synthase (KASII: Ta1.0_03905, KASIII: Ta1.0_11965); KAT, ketoacyl‐CoA thiolase (Ta1.0_05404); KCR, ketoacyl‐CoA reductase (Ta1.0_12143); KCS, ketoacyl‐CoA synthase (Ta1.0_08400); KIS, KIESEL gene tubulin folding cofactor (Ta1.0_14925); LDAP, LD‐associated protein (LDAP2:Ta1.0_10486 and LDAP3:Ta1.0_01437); LPAAT, 2‐lysophosphatidic acid acyltransferase; LPCAT, 2‐lysophosphatidylcholine acyltransferase; MAG, monoacylglycerol; MAGL, monoacylglycerol lipase (Ta1.0_09516); MCMT, malonyl‐CoA:ACP malonyltransferase; MHCR, myosin heavy chain related (Ta1.0_25384); OBPA1A, oil body‐associated protein 1A (*Ta1.0_05325); Oleosin (Ta1.0_19034); pACC, plastidic acetyl‐CoA carboxylase (biotin carboxylase subunit: *Ta1.0_09801); pACP, plastidic acyl carrier protein; PAKRP1, phragmoplast‐associated kinesin‐related protein 1 (Ta1.0_14606); PAP, phosphatidate phosphatase; PC, phosphatidylcholine; PDAT, phospholipid:diacylglycerol acyltransferase; PDH, pyruvate dehydrogenase complex; peLACS, peroxisomal long‐chain acyl‐CoA synthetase (Ta1.0_08099); PLA, phospholipase A; pLACS, plastidic long‐chain acyl‐CoA synthetase (*Ta1.0_05744); Pyr, pyruvate; SAD, stearoyl‐ACP desaturase (Ta1.0_04402); SEIPIN1 (Ta1.0_04422); TAG, triacylglycerol; TAGL, triacylglycerol lipase (Ta1.0_26944); TPXL8, cell cycle regulated microtubule associated protein (Ta1.0_01935); TUB1, tubulin 1 (Ta1.0_06454); XIE, myosin family protein with Dil domain (Ta1.0_21316); ZWI, kinesin‐like calmodulin‐binding protein (Ta1.0_21309).
Figure 6
Figure 6
Pennycress embryo central metabolism highlighting transcripts and metabolites correlated with FAMat or identified as biomarkers. Positively and negatively correlated metabolites are shown with red and blue circles, respectively. Enzymes and proteins whose transcript levels were positively and negatively correlated with FAMat are shown with red and blue squares, respectively. In both cases, the left symbol corresponds to 10DAP, and the right one to 16DAP. The * symbol was used to highlight the hub genes identified by MCC analysis at 16DAP. A red (positively correlated module) or blue (negatively correlated module) asterisk was used when the individual correlation did not reach significance. Nitrate negative correlation was determined at maturity. The names of metabolites identified in the top four strongest biomarkers at both stages were marked in the scheme with red or blue according to the expected levels in high oil lines. Scheme adapted from (Baud and Lepiniec, 2010). The cytosolic branch of the oxidative pentose phosphate pathway was included according to (Tsogtbaatar et al., 2020). 1,3PG, 1,3‐bisphosphoglycerate; 2A2HB, 2‐aceto 2‐hydroxy butanoate; 2AL, 2‐acetolactate; 2KG, 2‐ketoglutarate; 2PG, 2‐phosphoglycerate; 3PG, 3‐phosphoglycerate; 6PG, 6‐phosphogluconate; 6PGL, 6‐phosphogluconolactone; AcCoA, acetyl‐CoA; ADP‐GLC, ADP‐glucose; Arg, arginine; ArgSuc, argininosuccinate; Asn, asparagine; Chl, chlorophyll; CIT, citrate; Citru, citrulline; DHAP, dihydroxyacetone phosphate; E4P, erythrose 4‐phosphate; F1,6P, fructose 1,6‐bisphosphate; FRU, fructose; FUM, fumarate; G1P, glucose 1‐phosphate; G6P, glucose 6‐phosphate; GAP, glyceraldehyde 3‐phosphate; GLC, glucose; Gln, glutamine; Glu, glutamate; ICT, isocitrate; LHCI, light harvesting complex I; LHCII, light harvesting complex II; MaCoA, malonyl‐CoA; MAL, malate; OAA, oxaloacetate; Orn, ornithine; PEP, phosphoenolpyruvate; PSI, photosystem I; PSII, photosystem II; PYR, pyruvate; R5P, ribose 5‐phosphate; Ru1,5BP, ribulose 1,5‐bisphosphate; Ru5P, ribulose 5‐phosphate; S1,7BP, sedoheptulose 1,7‐bisphosphate; S7P, sedoheptulose 7‐phosphate; SUC, succinate; SUC‐CoA, succinyl‐CoA; UDP‐GLC, UDP‐glucose; UDP‐GlcA, UDP‐glucuronic acid; UDP‐Rha, UDP‐rhamnose; UDP‐Xyl, UDP‐xylose; Xu5P, xylulose 5‐phosphate. Enzymes or protein correlated to FAMat: 1 – phosphofructokinase (Ta1.0_21185), 2 – glyceraldehyde 3‐phosphate dehydrogenase (Ta1.0_14741), 3 – phosphoglycerate mutase (Ta1.0_03325), 4 – plastidic glucose translocator (Ta1.0_04394), 5 – hexokinase (Ta1.0_17071), 6 – fructokinase (Ta1.0_22569), 7 – phosphofructokinase (Ta1.0_00222), 8 – glyceraldehyde 3‐phosphate dehydrogenase (Ta1.0_03731), 9 – phosphoglycerate kinase (Ta1.0_12557), 10 – phosphoglycerate mutase (Ta1.0_03326), 11‐ pyruvate dehydrogenase plastidic E2 subunit (* Ta1.0_04980), 12 – acetyl‐CoA carboxylase‐biotin carboxylase subunit (*Ta1.0_09801), 13 – acetohydroxyacid synthase (Ta1.0_24015), 14 – transaldolase (Ta1.0_03091), 15 – ribulose 5‐phosphate epimerase (Ta1.0_00722), 16 – phosphoribulokinase (Ta1.0_12604), 17 – glyceraldehyde 3‐phosphate dehydrogenase (Ta1.0_04919 and Ta1.0_03025), 18 – sedoheptulose bisphosphatase (Ta1.0_15274), 19 – glutamate 1‐semialdehyde aminomutase (Ta1.0_13342), 20 – aldolase (Ta1.0_19789), 21 – hydroxymethylbilane synthase (Ta1.0_00770), 22 – uroporphyrinogen decarboxylase (*Ta1.0_07323), 23 – coproporphyrinogen III oxidase (*Ta1.0_08336), 24 – magnesium protoporphyrin IX methyltransferase (Ta1.0_18070), 25 – uroporphyrin methylase (Ta1.0_24457), 26 – nitrate transporter (Ta1.0_24305 and Ta1.0_25278), 27 – nitrate transporter (Ta1.0_04706), 28 – nitrate reductase (Ta1.0_05727), 29 – nitrite reductase (Ta1.0_26293), 30‐ glutamine synthetase (Ta1.0_26919), 31 – amino acid permease (Ta1.0_02089), 32‐ glutamine‐dependent asparagine synthase (Ta1.0_23820), 33 – pyruvate dehydrogenase E1 component alpha subunit (Ta1.0_20470) and E2 subunit (Ta1.0_11266), 34 – citrate synthase (Ta1.0_03365), 35 – 2‐ketoglutarate dehydrogenase E2 subunit (Ta1.0_03129), 36 – succinate dehydrogenase 2–3 (*Ta1.0_02582), 37 – ATP citrate lyase subunit B2 (*Ta1.0_16776), 38 – cytosolic acetyl‐CoA carboxylase (Ta1.0_04259) and 39 – phosphoenolpyruvate carboxylase (Ta1.0_17122).
Figure 7
Figure 7
Integrative approach for oil improvement in pennycress embryos. Organelles are shown in black, biomass components in green, promising candidate genes to up‐regulate in red, and genes to down‐regulate in blue. PAE, pectinacetylesterase; PEPC, phosphoenolpyruvate carboxylase; pHK, plastidic hexokinase; pGlcT, plastidic glucose transporter; pGAP, plastidic glyceraldehyde 3‐phosphate dehydrogenase; PRK; phosphoribulokinase; LHC, light harvesting complex genes; PSAG, photosystem I subunit G; PTAC8, photosystem I subunit P; UPM1, urophorphyrin methylase; HEME2, uroporphyrinogen decarboxylase; LIN2, coproporphyrinogen III oxidase; ACC, plastidic acetyl‐CoA carboxylase; SAD, stearoyl‐ACP desaturase; ALT, acyl‐lipid thioesterase; pLACS, plastidic long‐chain acyl‐CoA synthetase; ACBP, acyl‐CoA binding protein; KCS, ketoacyl‐CoA synthase; DGAT, acyl‐CoA: diacylglycerol acyltransferase; LDAP3, LD‐ASSOCIATED PROTEIN 3; TUB, tubulin; ACT, actin; TAGL, triacylglycerol lipase; peLACS, peroxisomal long‐chain acyl‐CoA synthetase; AACT, acetoacetyl‐CoA thiolase; NTR1.7, nitrate transporter; WR3, nitrate transporter; AAP4, amino acid transporter; NIA, nitrate reductase; NIR, nitrite reductase; NLP8 and NLP2, NIN‐like protein 8 and 2.

References

    1. Alexa, A. , Rahnenführer, J. and Lengauer, T. (2006) Improved scoring of functional groups from gene expression data by decorrelating GO graph structure. Bioinformatics, 22, 1600–1607. - PubMed
    1. Allen, D.K. , Ohlrogge, J.B. and Shachar‐Hill, Y. (2009) The role of light in soybean seed filling metabolism. Plant J. 58, 220–234. - PubMed
    1. Almagro Armenteros, J.J. , Sønderby, C.K. , Sønderby, S.K. , Nielsen, H. and Winther, O. (2017) DeepLoc: prediction of protein subcellular localization using deep learning. Bioinformatics, 33, 3387–3395. - PubMed
    1. Altendorf, K. , Isbell, T. , Wyse, D.L. and Anderson, J.A. (2019) Significant variation for seed oil content, fatty acid profile, and seed weight in natural populations of field pennycress (Thlaspi arvense L.). Ind. Crops Prod. 129, 261–268.
    1. Andre, C. , Haslam, R.P. and Shanklin, J. (2012) Feedback regulation of plastidic acetyl‐CoA carboxylase by 18:1‐acyl carrier protein in Brassica napus . Proc. Natl. Acad. Sci. USA, 109, 10107–10112. - PMC - PubMed

Publication types

LinkOut - more resources