. 2023 Jun 9;102(23):e33715.
doi: 10.1097/MD.0000000000033715.

Serum metabolomics analysis revealed metabolic disorders in Parkinson's disease

Affiliations

Serum metabolomics analysis revealed metabolic disorders in Parkinson's disease

Tian-Tian Lan et al. Medicine (Baltimore). .

Abstract

Background: Parkinson's disease (PD) is by now the second of the most prevalent neurodegenerative diseases in the world, and its incidence is increasing rapidly as the global population ages, with 14.2 million PD patients expected worldwide by 2040.

Methods: We gathered a completion of 45 serum samples, including 15 of healthy controls and 30 from the PD group. We used non-targeted metabolomics analysis based on liquid chromatography-mass spectrometry to identify the molecular changes in PD patients, and conducted bioinformatics analysis on this basis to explore the possible pathogenesis of PD.

Results: We found significant metabolomics changes in the levels of 30 metabolites in PD patients compared with healthy controls.

Conclusion: Lipids and lipid-like molecules accounted for the majority of the 30 differentially expressed metabolites. Also, pathway enrichment analysis showed significant enrichment in sphingolipid metabolic pathway. These assessments can improve our perception on the underlying mechanism of PD as well as facilitate a better targeting on therapeutic interventions.


Conflict of interest statement

The authors have no conflicts of interest to disclose.

Figures
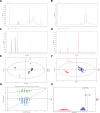
Figure 1.
Figure 1.
(A) TIC diagram of positive ion mode for UHPLC-OE-MS detection of QC samples. (B) TIC diagram of negative ion mode for UHPLC-OE-MS detection of QC samples. (C) EIC diagram of internal standard positive ions in all QC samples. (D) Internal labeling of negative ions in all QC samples EIC graph. (E) Scatterplot of PCA scores for all samples (including QC samples). The horizontal and vertical coordinates in the figure indicate the scores of the first and second ranked principal components, respectively. (F) Scatterplot of OPLS-DA model scores for PD group versus HC group. The plot’s horizontal coordinates represent the first fundamental component’s projected principal component scores, indicating the between-sample group differences. The orthogonal principal component scores are indicated by the vertical coordinates, indicating the within-sample group differences. (G) A dot plot of the PD group’s displacement test results versus the HC group’s OPLS-DA model. (H) Replacement test results for the PD group versus the OPLS-DA model for the HC group histogram. EIC = extracted ion chromatogram, HC = healthy controls, OPLS-DA = orthogonal partial least squares-discriminant analysis, PCA = principal component analysis, PD = Parkinson’s disease, QC = quality control, TIC = total ion current, UHPLC-OE-MS = ultra-high performance liquid chromatography-orbittrap explois mass spectrometer.
Figure 2.
Figure 2.
(A) Volcano plot for group PD versus HC. A peak is illustrated by each point on the volcanic diagram. Each substance’s multiplicative change is depicted by the horizontal coordinate, the vertical coordinate by the P value, and the scatter size by the VIP value. (B) For the PD versus HC group, a matchstick analysis was performed. The log-transformed change multiples are represented by the horizontal coordinates in the graph, the names of the differentiating metabolites in the PD group are represented by the vertical coordinates, and the color hues of the dots show the VIP value size. (*Represents significance *.01 < P < .05, **.001 < P < .01, **P < .001.) HC = healthy controls, PD = Parkinson’s disease, VIP = Variable Importance in the Projection.
Figure 3.
Figure 3.
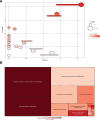
(A) Graphical route analysis bubble diagram for the PD versus HC groups. Every bubble symbolizes a metabolic route, with the horizontal coordinate indicating the magnitude of the pathway’s impact factor and the vertical coordinate indicating the width of the enrichment analyses’ P value. Following research are generally focused on the darker and bigger bubbles with a higher degree of enrichment in the route. (B) Pathway analysis in a rectangular tree diagram for the PD versus HC groups. Each square represents a metabolic route, with the diameter of the triangle indicating the magnitude of the pathway’s effect factor and the color indicating the enrichment analyses’ P value. Following research are generally focused on large dark squares with a high degree of enrichment. HC = healthy controls, PD = Parkinson’s disease.

References

    1. Wang J, Hoekstra JG, Zuo C, et al. . Biomarkers of Parkinson’s disease: current status and future perspectives. Drug Discov Today. 2013;18:155–62. - PMC - PubMed
    1. Jenner P, Morris HR, Robbins TW, et al. . Parkinson’s disease – the debate on the clinical phenomenology, aetiology, pathology and pathogenesis. J Parkinson s Disease. 2013;3:1–11. - PMC - PubMed
    1. Adler CH, Beach TG, Hentz JG, et al. . Low clinical diagnostic accuracy of early vs advanced Parkinson disease: clinicopathologic study. Neurology. 2014;83:406–12. - PMC - PubMed
    1. Tomlinson CL, Patel S, Meek C, et al. . Physiotherapy versus placebo or no intervention in Parkinson's disease. Cochrane Database Syst Rev. 2013;CD002817. doi:10.1002/14651858 - PMC - PubMed
    1. Hatano T, Saiki S, Okuzumi A, et al. . Identification of novel biomarkers for Parkinson’s disease by metabolomic technologies. J Neurol Neurosurg Psychiatr. 2016;87:295–301. - PubMed