

The 95% control lines on both confirmed cases and days of infection with COVID-19 were applied to compare the impact on public health between 2020 and 2021 using the hT-index
- PMID: 37335720
- PMCID: PMC10193847
- DOI: 10.1097/MD.0000000000033570
The 95% control lines on both confirmed cases and days of infection with COVID-19 were applied to compare the impact on public health between 2020 and 2021 using the hT-index
Abstract
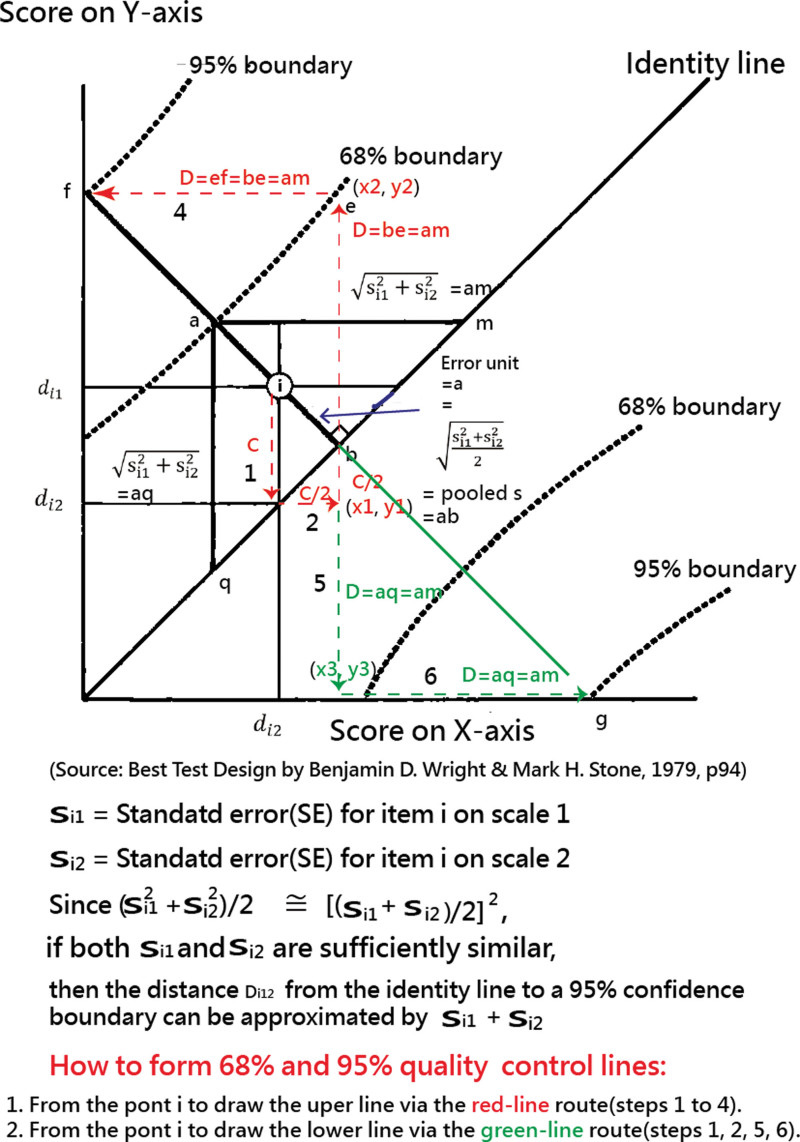
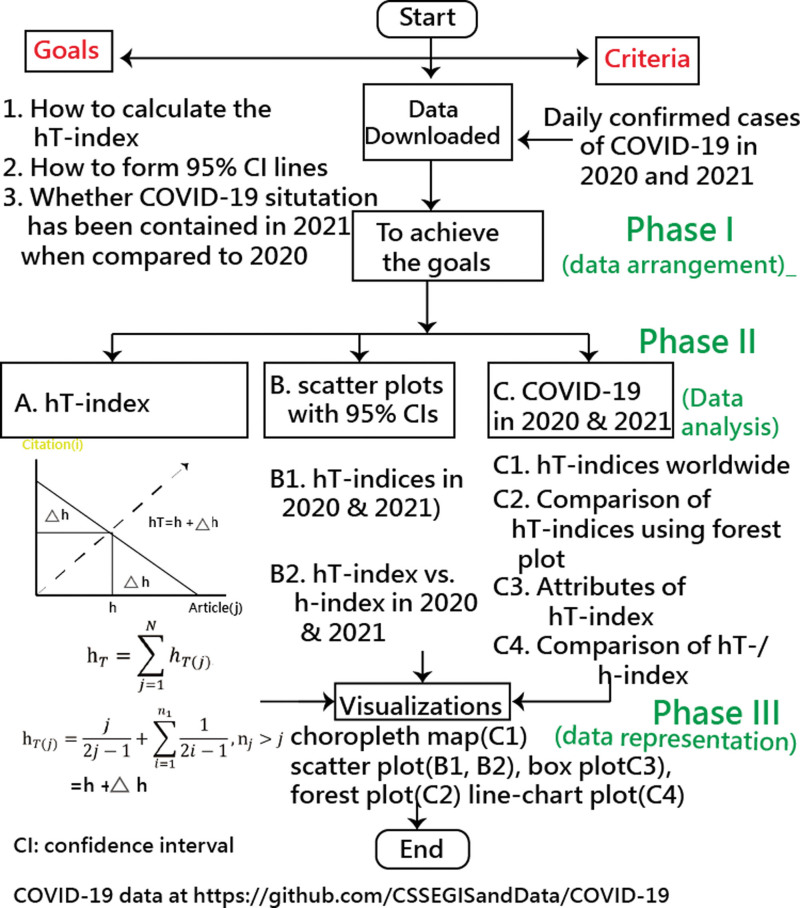
Background: COVID-19, the disease caused by the novel coronavirus, is now a worldwide pandemic. The number of infected people has continually increased, and currently, this pandemic continues to present challenges to public health. Scatter plots are frequently used to interpret the impact in relation to confirmed cases. However, the 95% confidence intervals are rarely given to the scatter plot. The objective of this study was to; Develop 95% control lines on daily confirmed cases and infected days for countries/regions in COVID-19 (DCCIDC) and; Examine their impacts on public health (IPH) using the hT-index.
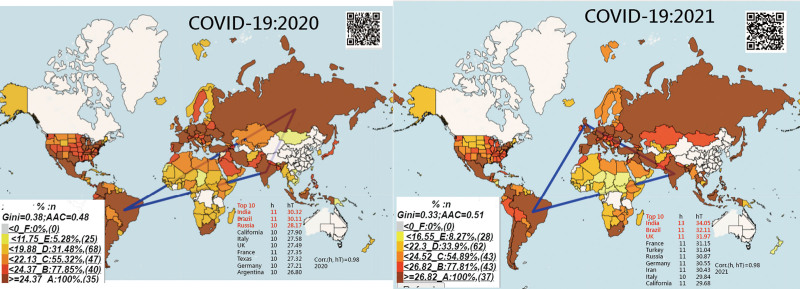
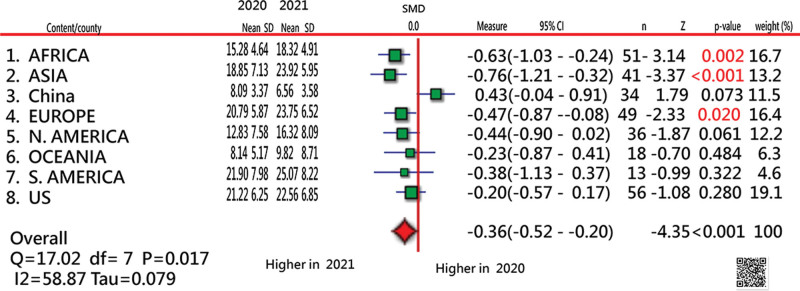
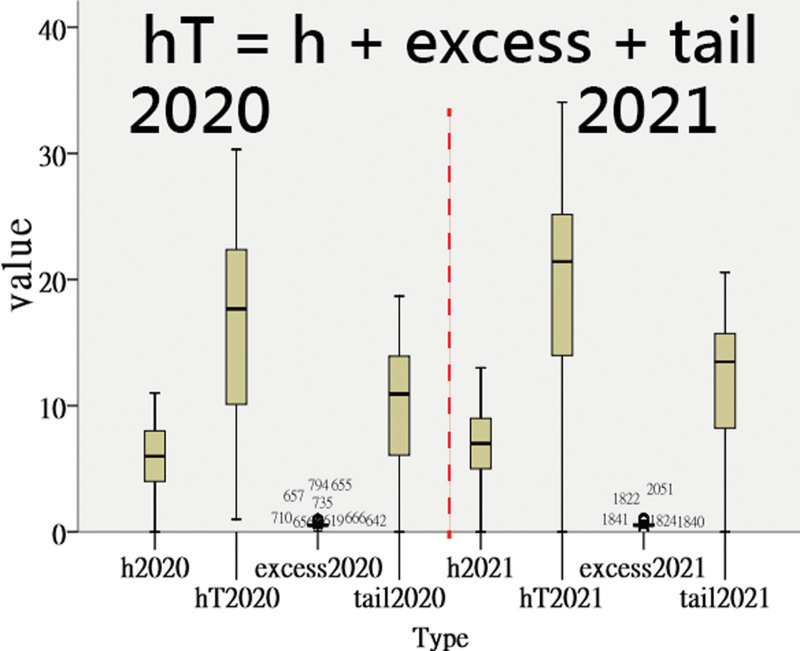
Methods: All relevant COVID-19 data were downloaded from GitHub. The hT-index, taking all DCCIDCs into account, was applied to measure the IPHs for counties/regions. The 95% control lines were proposed to highlight the outliers of entities in COVID-19. The hT-based IPHs were compared among counties/regions between 2020 and 2021 using the choropleth map and the forest plot. The features of the hT-index were explained using the line chart and the box plot.
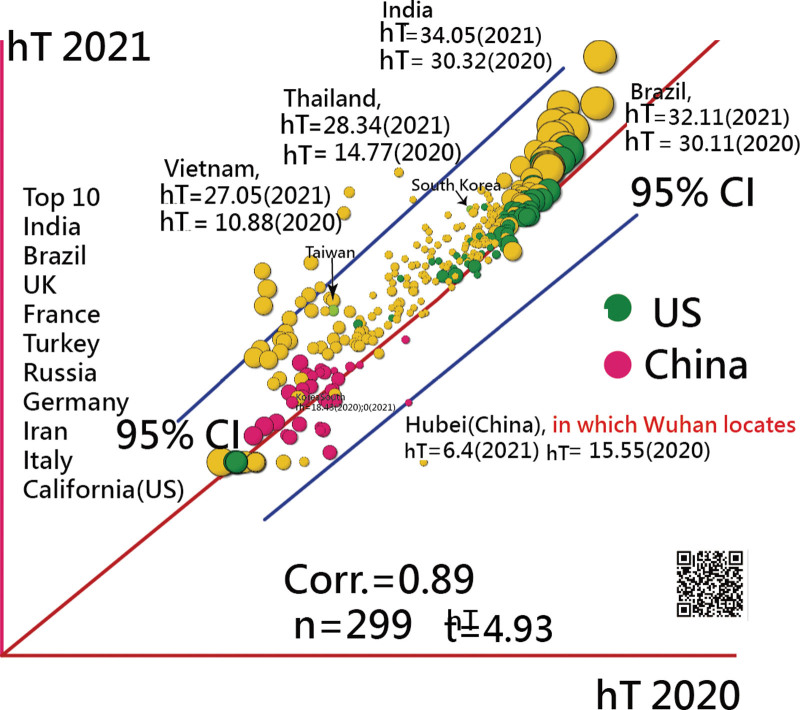
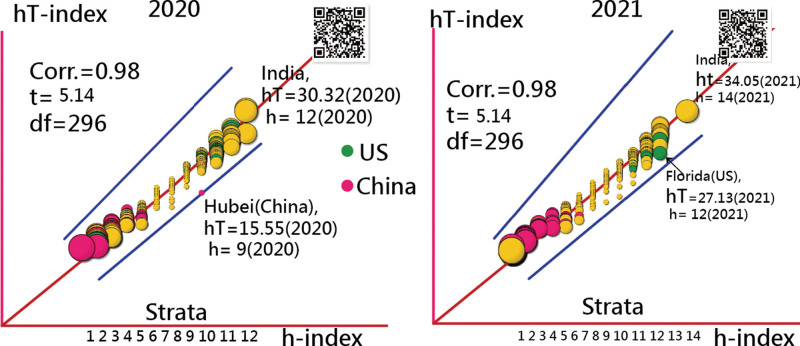
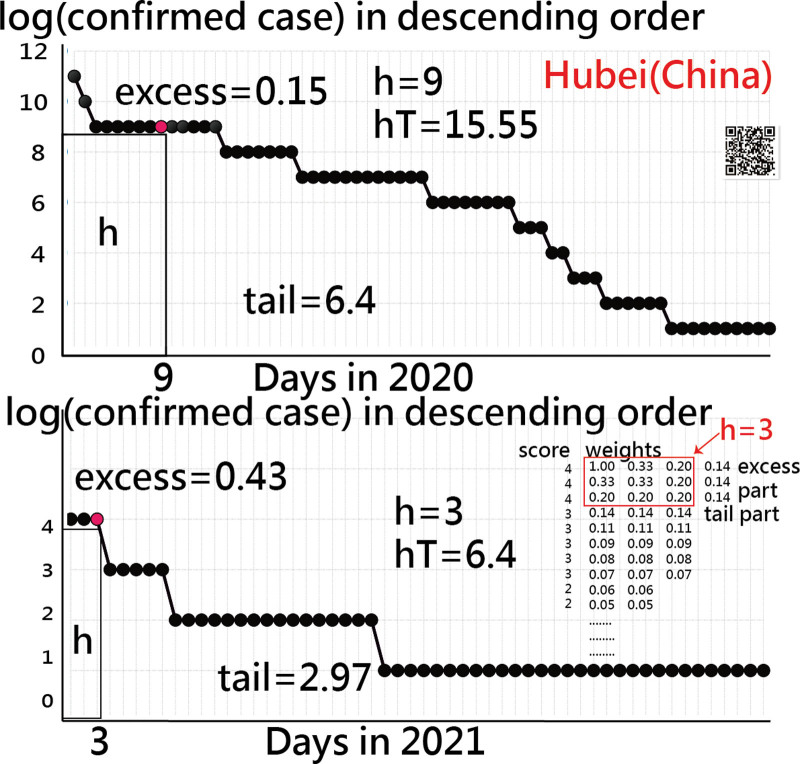
Results: The top 2 countries measured by hT-based IPHs were India and Brazil in 2020 and 2021. The outliers beyond the 95% confidence intervals were Hubei (China), with a lower hT-index favoring 2021 ( = 6.4 in 2021 vs 15.55 in 2020) and higher hT indices favoring 2021 in Thailand (28.34 vs 14,77) and Vietnam (27.05 vs 10.88). Only 3 continents of Africa, Asia, and Europe had statistically and significantly fewer DCCIDCs (denoted by the hT-index) in 2021. The hT-index generalizes the h-index and overcomes the disadvantage without taking all elements (e.g., DCCIDCs) into account in features.
Conclusions: The scatter plot combined with the 95% control lines was applied to compare the IPHs hit by COVID-19 and suggested for use with the hT-index in future studies, not limited to the field of public health as we did in this research.
Copyright © 2023 the Author(s). Published by Wolters Kluwer Health, Inc.
Conflict of interest statement
The authors have no funding and conflicts of interest to disclose.
Figures
References
-
- JHC. Coronavirus disease 2019 (COVOD-19) outbreak. 2022. Available at: http://www.healthup.org.tw/kpiall/covid19dashboard.asp.
-
- Suwantarat N1, Apisarnthanarak A. Risks to healthcare workers with emerging diseases: lessons from MERS-CoV, Ebola, SARS, and avian flu. Curr Opin Infect Dis. 2015;28:349–61. - PubMed
-
- NBC News. Are coronavirus diseases equally deadly? Comparing the latest coronavirus to MERS and SARS. 2020. Available at: https://www.nbcnews.com/health/health-news/coronavirus-diseases-comparin....
MeSH terms
LinkOut - more resources
Full Text Sources
Medical
