. 2023 May 19;102(20):e33821.
doi: 10.1097/MD.0000000000033821.

Analysis of the potential relationship between COVID-19 and Behcet's disease using transcriptome data

Affiliations

Analysis of the potential relationship between COVID-19 and Behcet's disease using transcriptome data

Zhibai Zhao et al. Medicine (Baltimore). .

Abstract

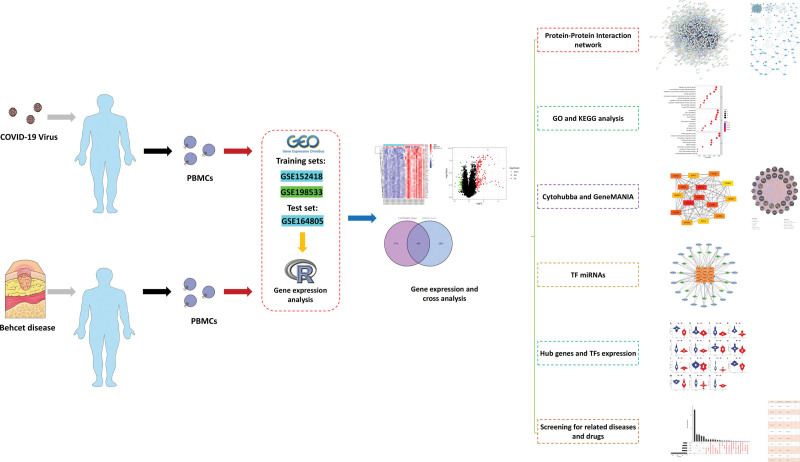
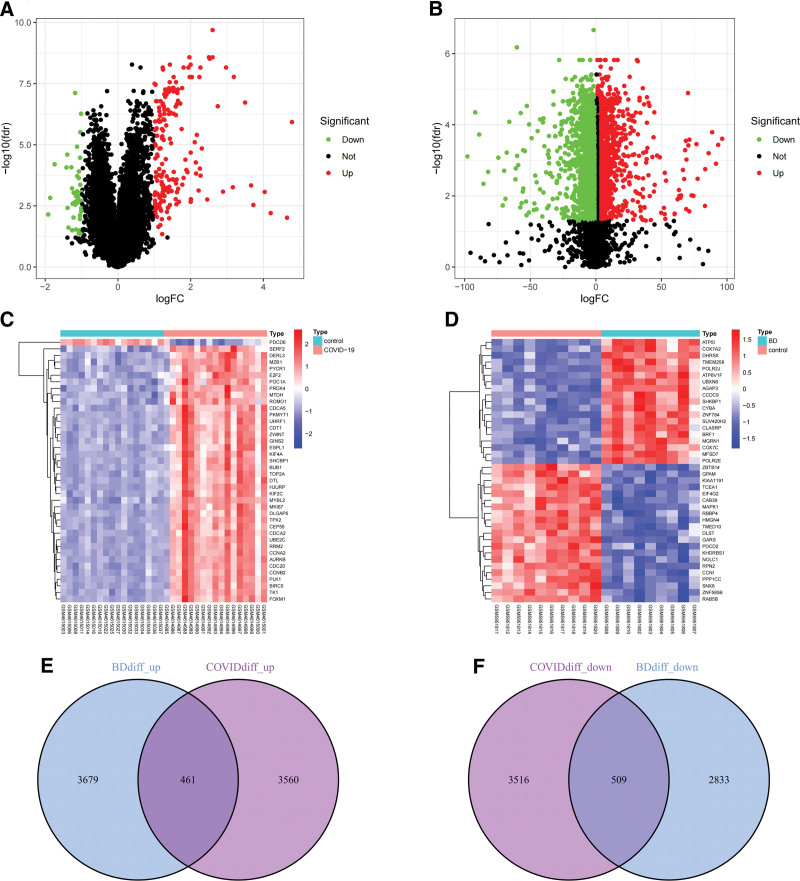
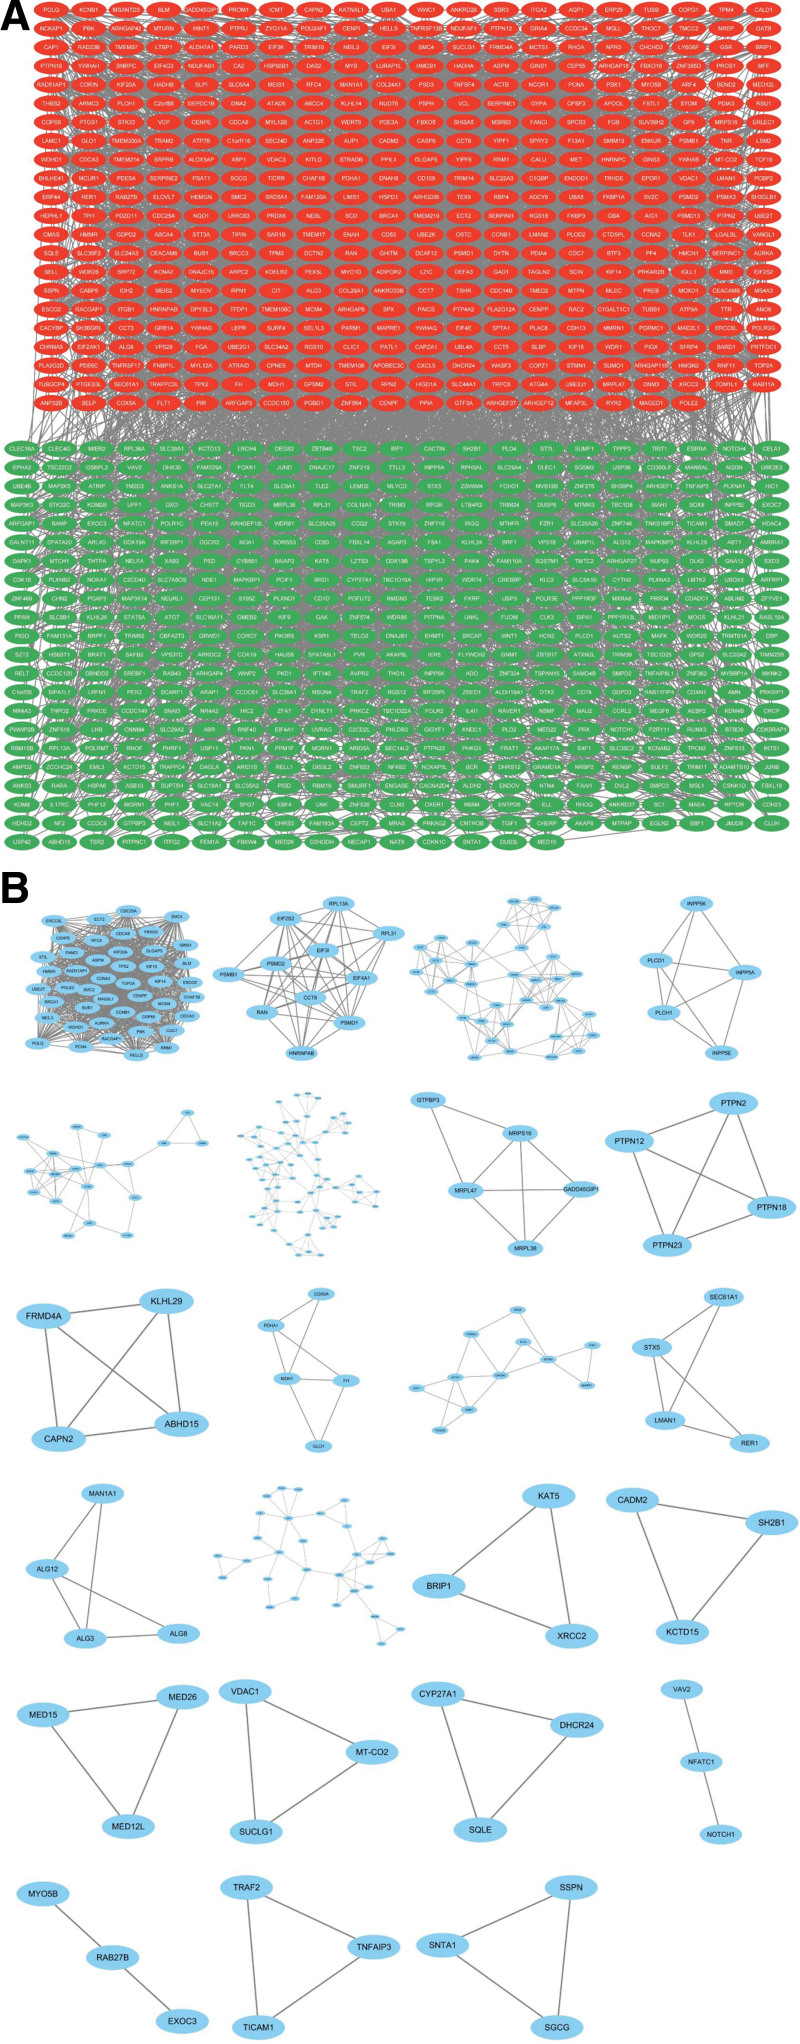
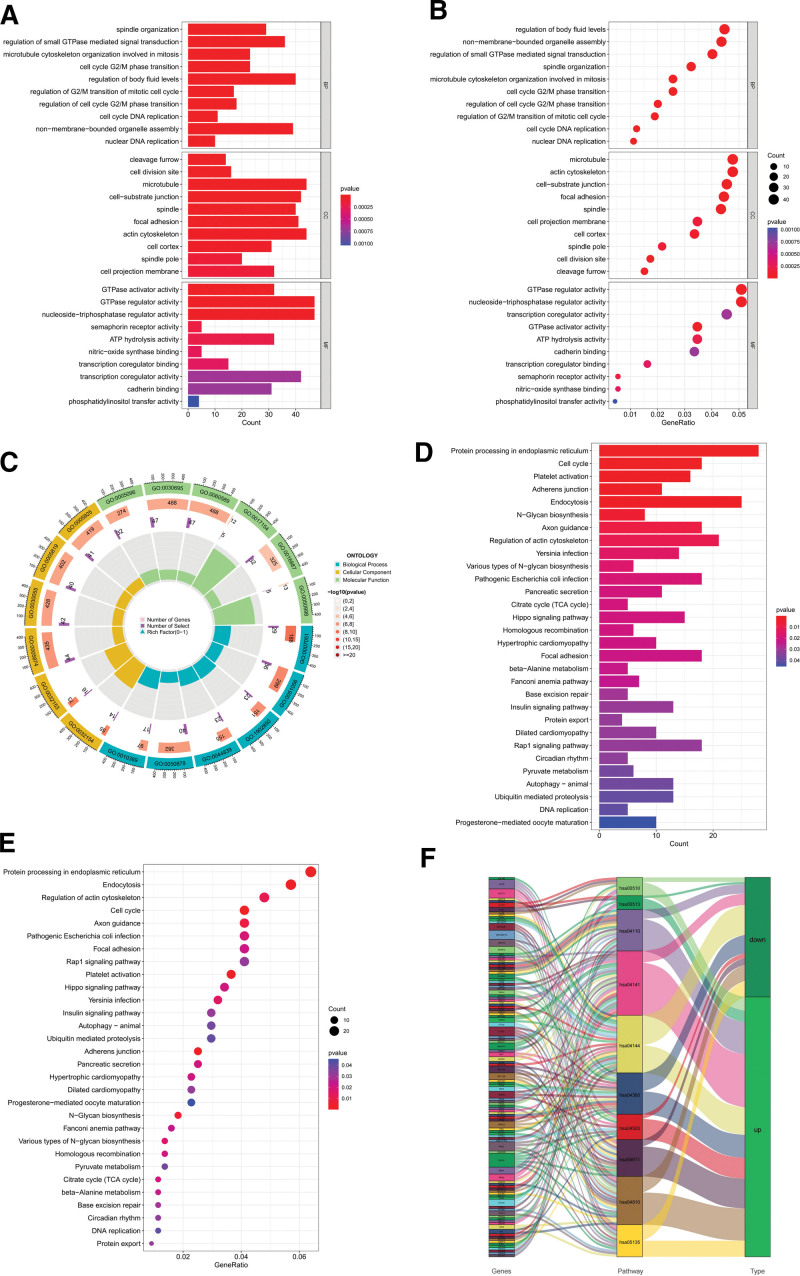
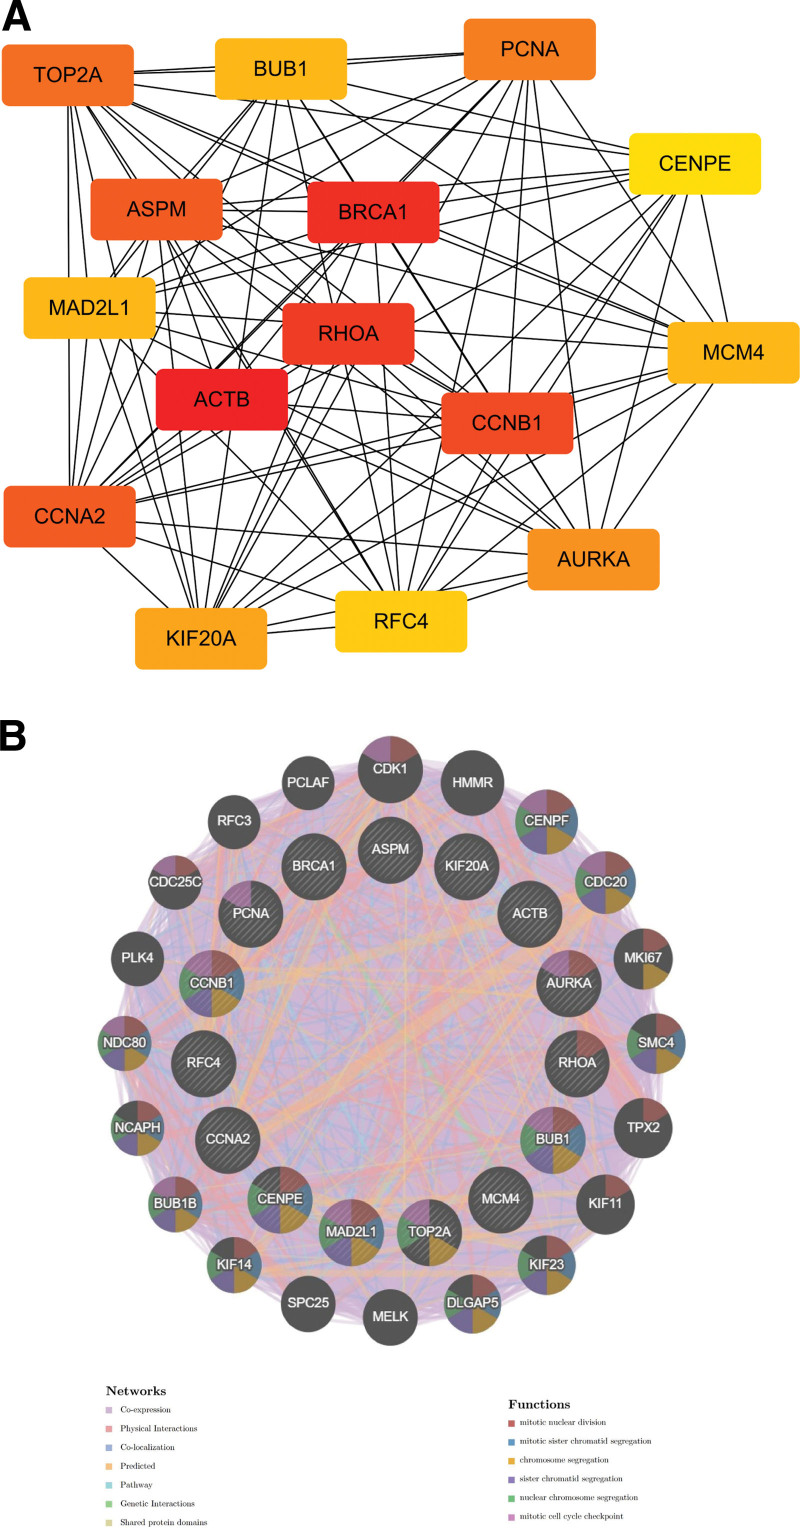
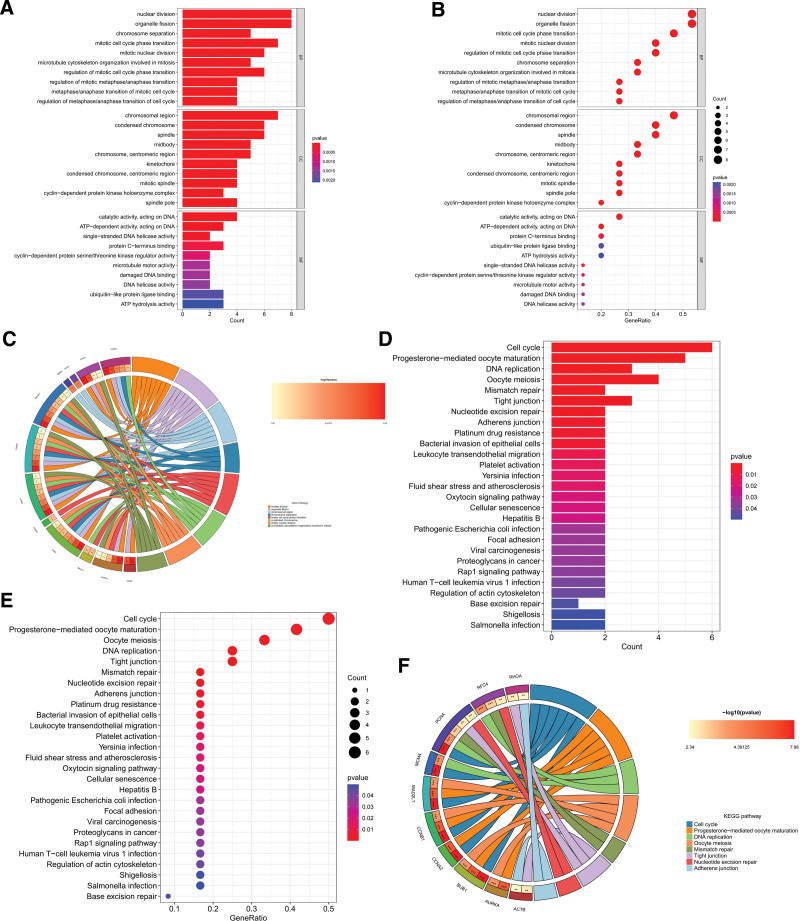
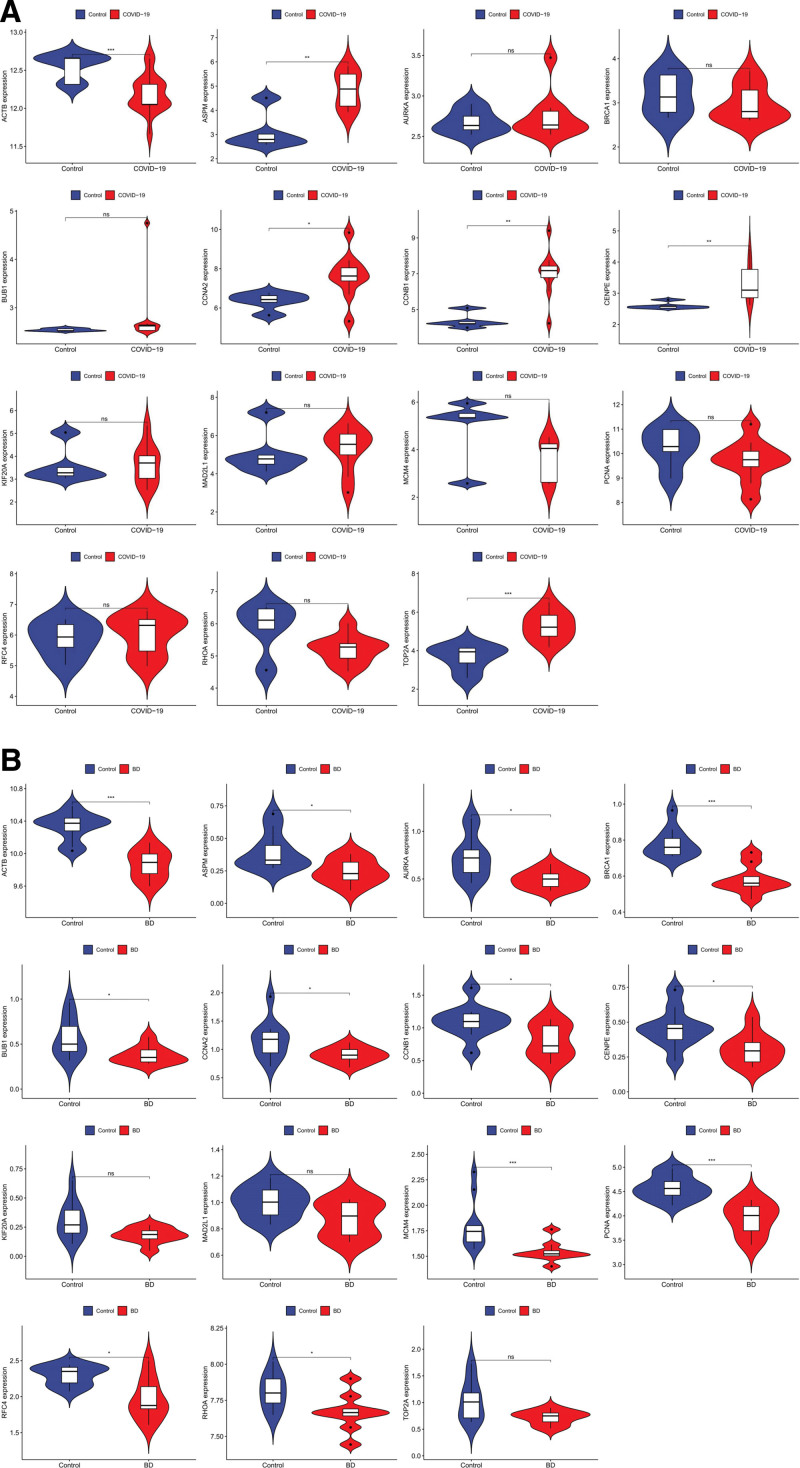
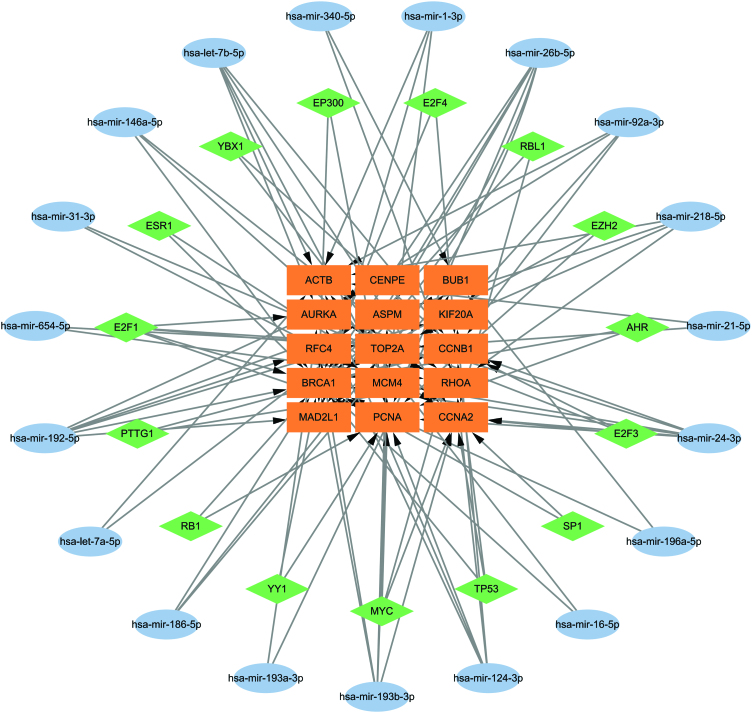
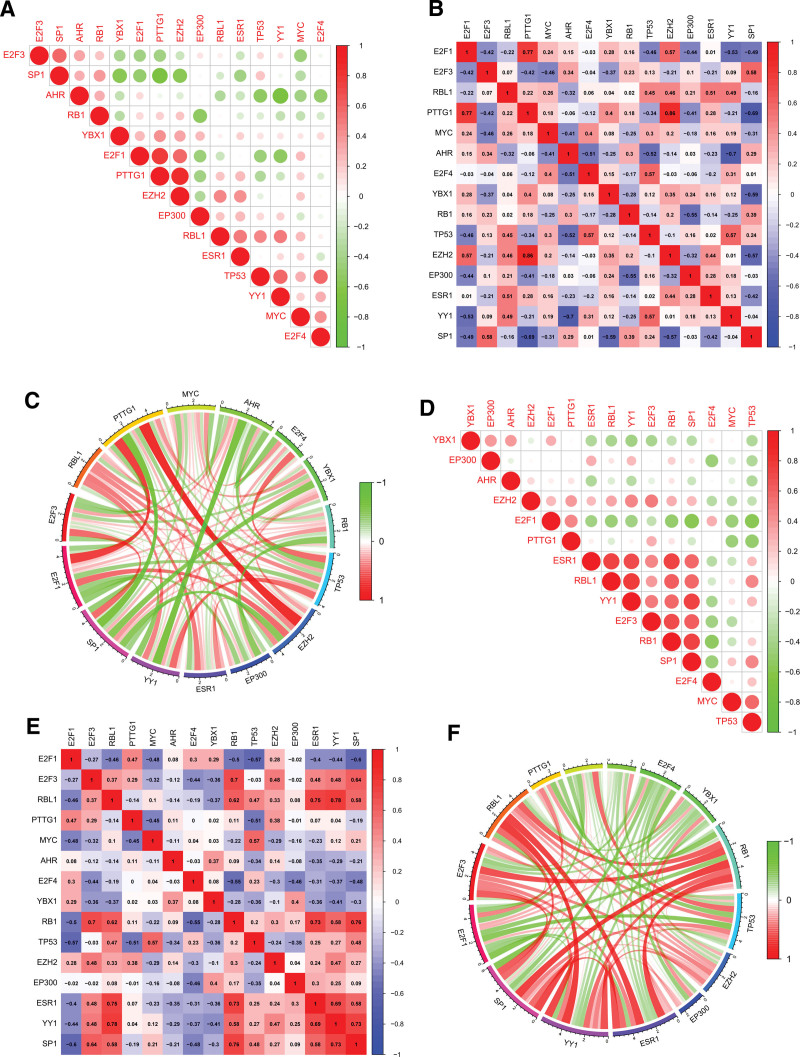
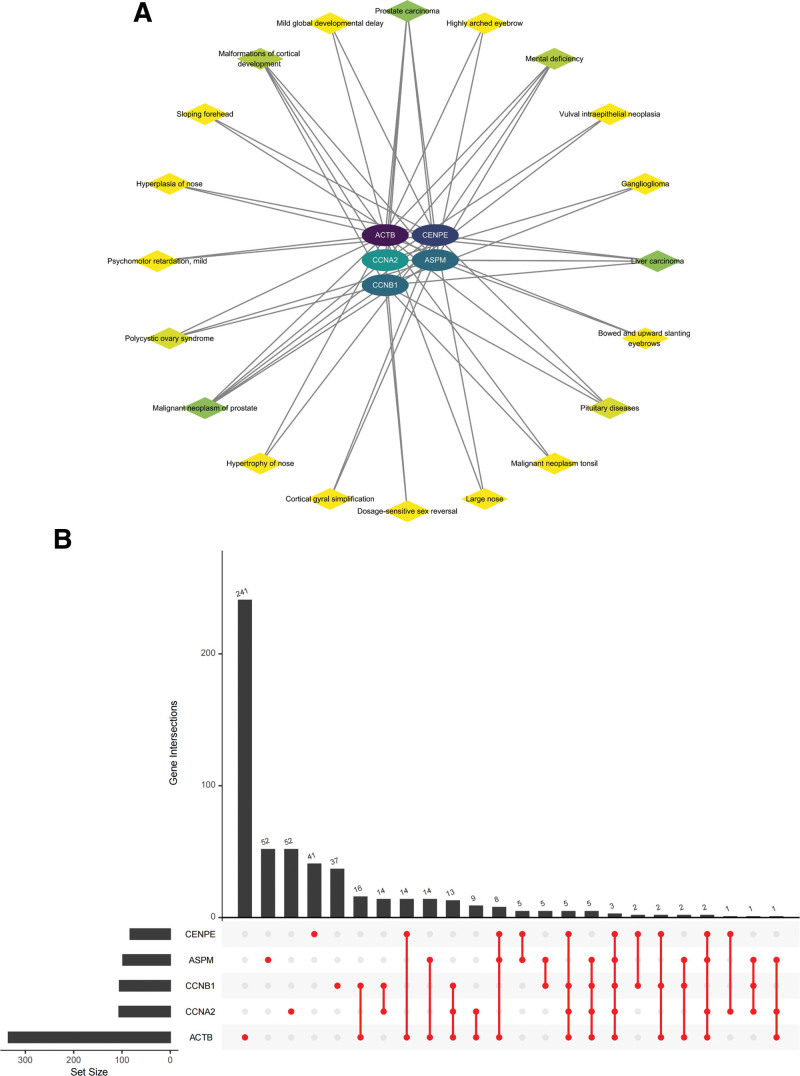
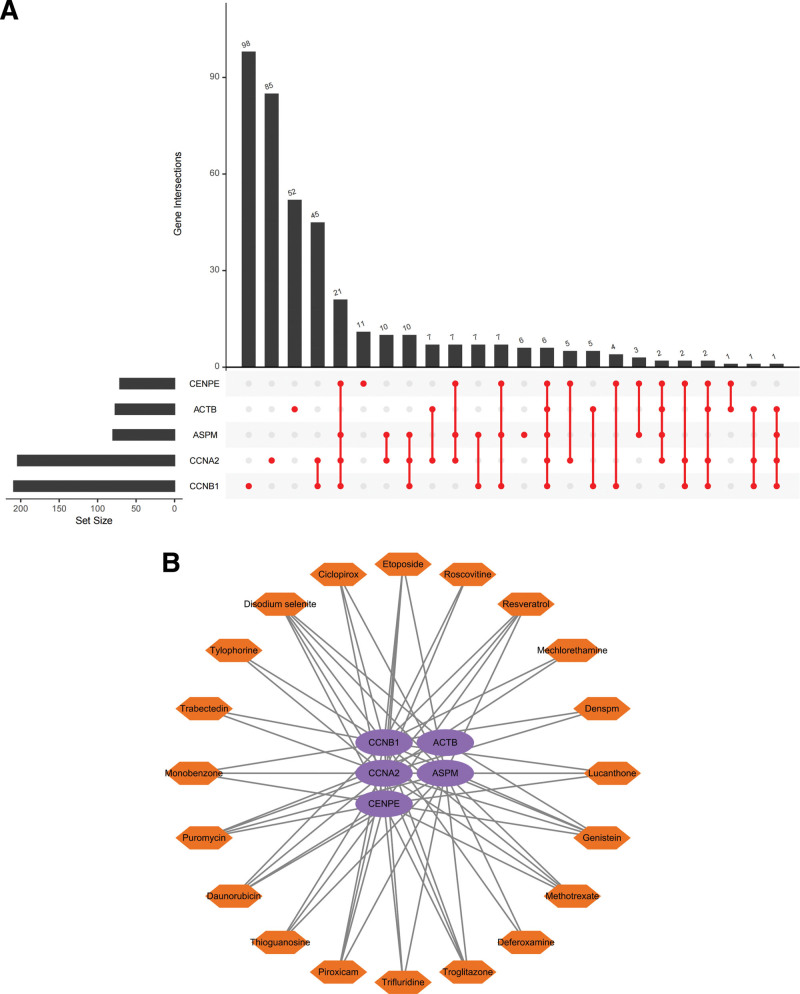
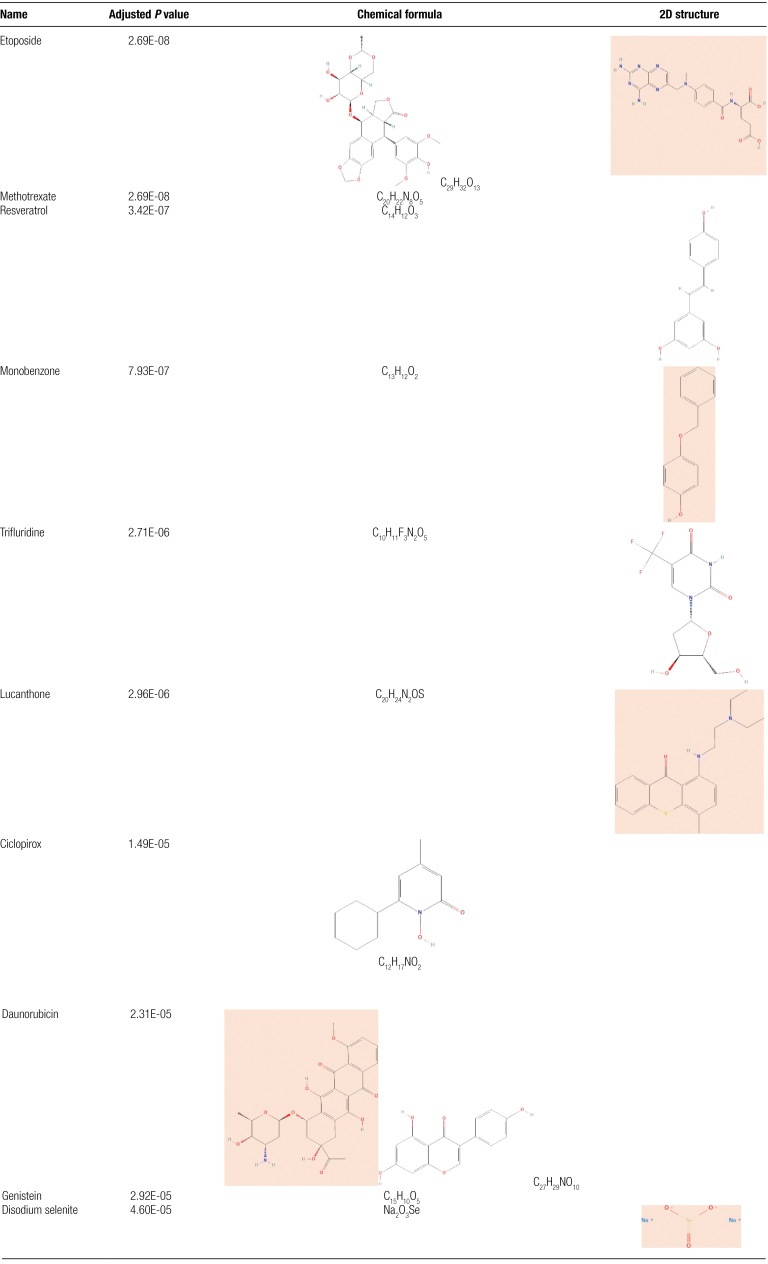
To investigate the potential role of COVID-19 in relation to Behcet's disease (BD) and to search for relevant biomarkers. We used a bioinformatics approach to download transcriptomic data from peripheral blood mononuclear cells (PBMCs) of COVID-19 patients and PBMCs of BD patients, screened the common differential genes between COVID-19 and BD, performed gene ontology (GO) and pathway analysis, and constructed the protein-protein interaction (PPI) network, screened the hub genes and performed co-expression analysis. In addition, we constructed the genes-transcription factors (TFs)-miRNAs network, the genes-diseases network and the genes-drugs network to gain insight into the interactions between the 2 diseases. We used the RNA-seq dataset from the GEO database (GSE152418, GSE198533). We used cross-analysis to obtain 461 up-regulated common differential genes and 509 down-regulated common differential genes, mapped the PPI network, and used Cytohubba to identify the 15 most strongly associated genes as hub genes (ACTB, BRCA1, RHOA, CCNB1, ASPM, CCNA2, TOP2A, PCNA, AURKA, KIF20A, MAD2L1, MCM4, BUB1, RFC4, and CENPE). We screened for statistically significant hub genes and found that ACTB was in low expression of both BD and COVID-19, and ASPM, CCNA2, CCNB1, and CENPE were in low expression of BD and high expression of COVID-19. GO analysis and pathway analysis was then performed to obtain common pathways and biological response processes, which suggested a common association between BD and COVID-19. The genes-TFs-miRNAs network, genes-diseases network and genes-drugs network also play important roles in the interaction between the 2 diseases. Interaction between COVID-19 and BD exists. ACTB, ASPM, CCNA2, CCNB1, and CENPE as potential biomarkers for 2 diseases.


Conflict of interest statement

The authors have no conflicts of interest to disclose.

Figures

Figure 1.
Figure 1.
Research design flow chart. PBMC = peripheral blood mononuclear cell.
Figure 2.
Figure 2.
Heatmap, volcano diagram and Venn diagram. (A) The volcano diagram of GSE152418. (B) The volcano diagram of GSE198533. Up-regulated genes are marked in red, down-regulated genes are marked in green. (C) The heatmap of GSE152418. (D) The heatmap of GSE198533. Horizontal coordinates are sample names, vertical coordinates are differentially expressed genes. Up-regulated genes are marked in red, down-regulated genes are marked in blue. (E) The 2 datasets showed an overlap of 461 up-regulated differentially expressed genes. (F) The 2 datasets showed an overlap of 509 down-regulated differentially expressed genes.
Figure 3.
Figure 3.
PPI network analysis. (A) Up-regulated and down-regulated genes are marked with different colors, Up-regulated genes are marked in red, down-regulated genes are marked in green. (B) Cluster analysis divided a total of 23 sub-networks. PPI = protein-protein interaction.
Figure 4.
Figure 4.
Gene ontology and pathway analysis of common differential genes. (A) Bar chart of Gene ontology analysis. (B) Bubble diagram of Gene ontology analysis. (C) Circle chart of Gene ontology analysis. (D) Bar chart of pathway analysis. (E) Bubble diagram of pathway analysis. (F) Sankey diagram of pathway analysis.
Figure 5.
Figure 5.
Screening of hub genes. (A) Hub genes screened by Cytohubba plugin in Cytoscape. (B) Hub genes and their co-expression genes were analyzed via GeneMANIA.
Figure 6.
Figure 6.
Gene ontology and pathway analysis of hub genes. (A) Bar chart of Gene ontology analysis. (B) Bubble diagram of Gene ontology analysis. (C) Circle chart of Gene ontology analysis. (D) Bar chart of pathway analysis. (E) Bubble diagram of pathway analysis. (F) Circle chart of pathway analysis.
Figure 7.
Figure 7.
The expression level of hub genes. The comparison between the 2 sets of data uses the mean t test. P < .05 was considered statistically significant. *P < .05; ***P < .001. (A) The expression level of hub genes in GSE164805. (B) The expression level of hub genes in GSE198533.
Figure 8.
Figure 8.
The regulatory network of hub genes and related miRNAs and TFs. TF = transcription factor.
Figure 9.
Figure 9.
Validation of the interaction relationship between hub genes-related TFs. (A) Visualization of the correlation between TFs in GSE152418, red indicates positive correlation between TFs expression levels, green indicates negative correlation between TFs expression levels. (B) Quantification of correlation between TFs in GSE152418, red indicates positive correlation between TFs expression levels, blue indicates negative correlation between TFs expression levels, and the larger the value, the stronger the correlation. (C) The correlation between TFs in GSE152418 is shown by circle chart, red indicates positive correlation between TFs expression levels, green indicates negative correlation between TFs expression levels. (D) Visualization of the correlation between TFs in GSE198533. (E) Quantification of correlation between TFs in GSE198533. (F) The correlation between TFs in GSE198533 is shown by circle chart. TF = transcription factor.
Figure 10.
Figure 10.
Genes-diseases association analysis. (A) Genes-diseases network, the darker the color, the stronger the association. (B) The upset chart shows the association of diseases with hub genes.
Figure 11.
Figure 11.
Genes-drugs association analysis. (A) The upset chart shows the association of drugs with hub genes. (B) Network relationships between top 20 drugs and genes.
Table 1
Table 1
List of drug information.

Similar articles

Cited by

References

    1. Tsai Y, Ku H, Maithreepala S, et al. . Higher risk of acute respiratory distress syndrome and risk factors among patients with COVID-19: a systematic review, meta-analysis and meta-regression. Int J Environ Res Public Health. 2022;19. - PMC - PubMed
    1. Honarmand K, Fiorini K, Chakraborty D, et al. . Clinical characteristics, multiorgan dysfunction and outcomes of patients with COVID-19: a prospective case series. CMAJ Open. 2022;10:E675–84. - PMC - PubMed
    1. Bulur I, Onder M. Behcet disease: new aspects. Clin Dermatol. 2017;35:421–34. - PubMed
    1. Shimizu J, Murayama MA, Miyabe Y, et al. . Immunopathology of Behcet’s disease: an overview of the metagenomic approaches. Rheumato. 2022;2:74–86.
    1. Dincses E, Esatoglu S, Fresko I, et al. . Outcome of invasive procedures for venous thrombosis in Behçet’s syndrome: case series and systematic literature review. Clin Exp Rheumatol. 2019:125–31. - PubMed