. 2023 Jul 1;10(Pt 4):475-486.
doi: 10.1107/S2052252523004505.

Dynamical scattering in ice-embedded proteins in conventional and scanning transmission electron microscopy

Affiliations

Dynamical scattering in ice-embedded proteins in conventional and scanning transmission electron microscopy

Max Leo Leidl et al. IUCrJ. .

Abstract

Structure determination of biological macromolecules using cryogenic electron microscopy is based on applying the phase object (PO) assumption and the weak phase object (WPO) approximation to reconstruct the 3D potential density of the molecule. To enhance the understanding of image formation of protein complexes embedded in glass-like ice in a transmission electron microscope, this study addresses multiple scattering in tobacco mosaic virus (TMV) specimens. This includes the propagation inside the molecule while also accounting for the effect of structural noise. The atoms in biological macromolecules are light but are distributed over several nanometres. Commonly, PO and WPO approximations are used in most simulations and reconstruction models. Therefore, dynamical multislice simulations of TMV specimens embedded in glass-like ice were performed based on fully atomistic molecular-dynamics simulations. In the first part, the impact of multiple scattering is studied using different numbers of slices. In the second part, different sample thicknesses of the ice-embedded TMV are considered in terms of additional ice layers. It is found that single-slice models yield full frequency transfer up to a resolution of 2.5 Å, followed by attenuation up to 1.4 Å. Three slices are sufficient to reach an information transfer up to 1.0 Å. In the third part, ptychographic reconstructions based on scanning transmission electron microscopy (STEM) and single-slice models are compared with conventional TEM simulations. The ptychographic reconstructions do not need the deliberate introduction of aberrations, are capable of post-acquisition aberration correction and promise benefits for information transfer, especially at resolutions beyond 1.8 Å.

Keywords: amorphous ice; cryogenic electron microscopy; dynamical scattering; image simulations; integrative structural biology; molecular dynamics.


Figures

Figure 1
Figure 1
A schematic drawing of the TMV embedded in glass-like ice. The z direction corresponds to the incident electron-beam direction. Initially, Δz ice = 0 Å and the slice thickness Δz is varied to study the impact of dynamical scattering. Later, Δz = 15 Å is kept constant and the ice thickness Δz ice is varied. The total specimen thickness corresponds to Δz specimen = 2Δz ice + Δz TMV.
Figure 2
Figure 2
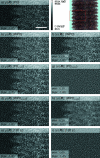
Comparison of different simulations of the specimen exit wave of TMV protein embedded in ice. The total specimen thickness Δz specimen = 19.5 nm (with no water molecules on the top or bottom surfaces). Only a part of the simulation is displayed due to the symmetry of TMV, as depicted by the red square in the top-right schematic drawing. The phase and modulus of different exit waves are shown in grey scale (min black and max white, as indicated in the bottom-left panels of each part) for (a)–(e) and (f)–(i), respectively. (a) Exit wave of the PO transmission function. (b), (f) Exit wave of the WPO approximation. (c), (g) Exit wave of the PO after an additional propagation of half the specimen thickness, 0.5Δz TMV. (d), (h) Exit wave of the WPO after an additional propagation of 0.5Δz TMV. (e), (i) Exit wave of a multislice simulation with 120 slices. The scale bar is 25 Å.
Figure 3
Figure 3
Normalized complex difference for different exit waves. Interaction models given in the headings are compared with the exit wave of a multislice simulation with 120 slices via the normalized complex difference [equation (5)]. Modulus and phase are expressed by the hue and colour according to the colour wheel in (a), respectively. Hue was spread between zero and the maximum modulus in each plot for clarity, with the maximum indicated in each heading. (a), (b) Single-slice models. (c), (d) Single-slice models with an additional propagation of 0.5Δz ice. (e), (f) Multislice simulations. The scale bar is 25 Å.
Figure 4
Figure 4
FRCs between exit waves from different interaction models and the multislice simulation with 120 slices. (a) Multislice simulations with different numbers of slices and (b) single-slice models. The subscript ‘exit’ indicates an additional propagation of 0.5Δz ice. FRC curves separating the modulus and phase can be found in Fig. S1.
Figure 5
Figure 5
CTEM simulations of the (a)–(c) WPOexit, POexit and a multislice simulation with 120 slices, and (d)–(f) after correction of phase inversions assuming a WPO [equation (3)]. The scale bar is 25 Å.
Figure 6
Figure 6
FRC curves of exit waves and CTEM simulations with a defocus of −500 nm and spherical aberration of 1.5 mm. (a) The exit waves compared with the multislice simulation with 120 slices. (b) The corresponding CTEM simulations with the CTEM simulation of the 120-slice case as reference. The dashed line shows the real part of the Fresnel propagator in Fourier space for a propagation distance of half the specimen thickness.
Figure 7
Figure 7
Comparison of MD simulation of the glass-like ice with the MIP approximation. (a) Phase and (b) modulus of the exit wave of the MIP approximation of TMV embedded in ice with a specimen thickness of 19.5 nm. (c) Normalized complex difference between the MD simulation and the MIP approximation. The colour wheel shows the modulus from 0 to 1.4. (d) FRC curves between the simulations mentioned in the legend and the MD simulation. The scale bar is 25 Å.
Figure 8
Figure 8
Comparison of simulations with different specimen thicknesses. (a), (b) Phase of the exit wave for the minimal and maximal ice thicknesses of 19.5 and 94.5 nm, respectively. (c), (d) CTEM simulations for the minimal and maximal ice thicknesses. The total specimen thickness is given in the captions. (e) FRC curves of 2D class averages from 500 CTEM simulations with defocus values randomly distributed over 0.1 to 1.0 µm for different specimen thicknesses of 34.5, 64.5 and 94.5 nm. The exit wave of the central slices that contain TMV is used as the reference. The average is performed with CTEM images that are phase flipped and the additional propagation is considered as an additional defocus. The scale bar is 25 Å.
Figure 9
Figure 9
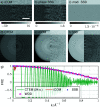
Comparison of conventional and scanning TEM simulations. The total specimen thickness Δz specimen = 19.5 nm (with no water molecules on the top or bottom surfaces). (a)–(c) Integrated COM, and phase and modulus of an SSB reconstruction. For the iCOM reconstruction, a deconvolution with the magnitude squared of an aberration-free probe was performed to show the reconstructed σV. (d)–(f) Complete power spectra of CTEM, iCOM and SSB on the left, and up to spatial frequencies of 0.25 Å−1 on the right. (g) FRC curves with respect to the phase of the OTF. For SSB and WDD, only the phase was used, and for the CTEM simulation a defocus of −500 nm and no other aberrations were used. The CTEM simulation was back-propagated to the centre of the specimen. The scale bar is 25 Å.

References

    1. Abascal, J. L. & Vega, C. (2005). J. Chem. Phys. 123, 234505. - PubMed
    1. Angert, I., Burmester, C., Dinges, C., Rose, H. & Schröder, R. (1996). Ultramicroscopy, 63, 181–192.
    1. Bangun, A., Melnyk, O., März, B., Diederichs, B., Clausen, A., Weber, D., Filbir, F. & Müller-Caspary, K. (2022). IEEE Trans. Comput. Imaging, 8, 996–1011.
    1. Baxter, W. T., Grassucci, R. A., Gao, H. & Frank, J. (2009). J. Struct. Biol. 166, 126–132. - PMC - PubMed
    1. Bock, L. V. & Grubmüller, H. (2022). Nat. Commun. 13, 1709. - PMC - PubMed