. 2023 Oct;12(26):e2300879.
doi: 10.1002/adhm.202300879. Epub 2023 Jun 27.

Induced Pluripotent Stem Cell-Derived Extracellular Vesicles Promote Wound Repair in a Diabetic Mouse Model via an Anti-Inflammatory Immunomodulatory Mechanism

Affiliations

Induced Pluripotent Stem Cell-Derived Extracellular Vesicles Promote Wound Repair in a Diabetic Mouse Model via an Anti-Inflammatory Immunomodulatory Mechanism

Daniel Levy et al. Adv Healthc Mater. 2023 Oct.

Abstract

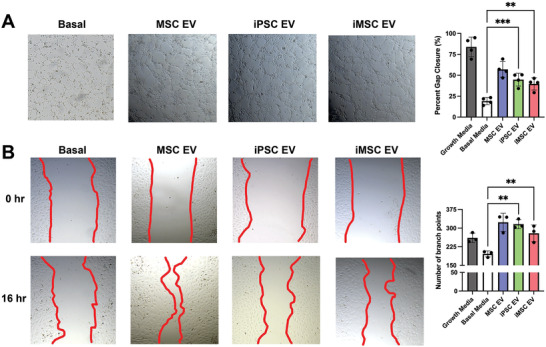
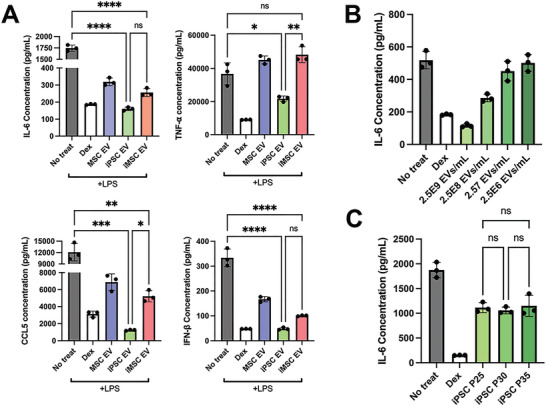
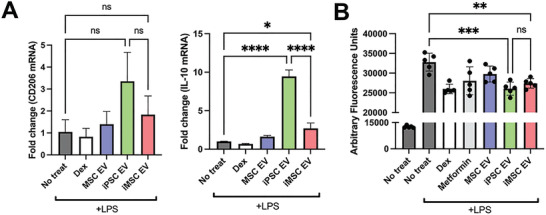
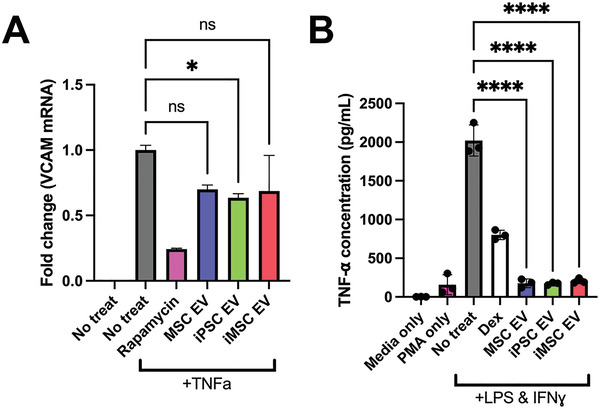
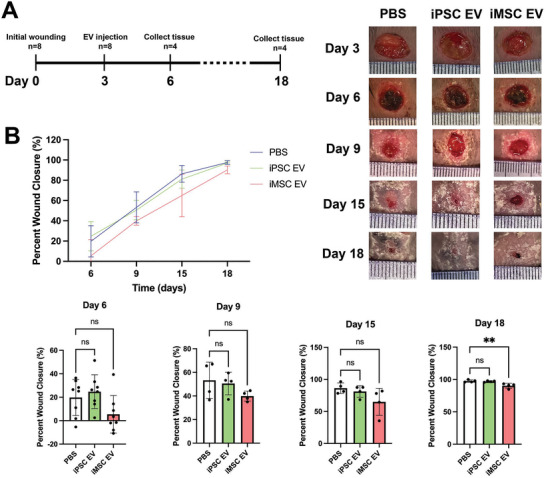
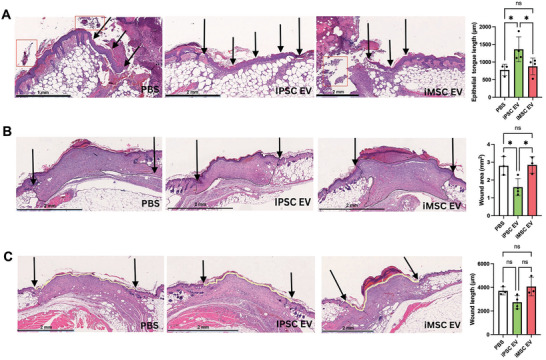
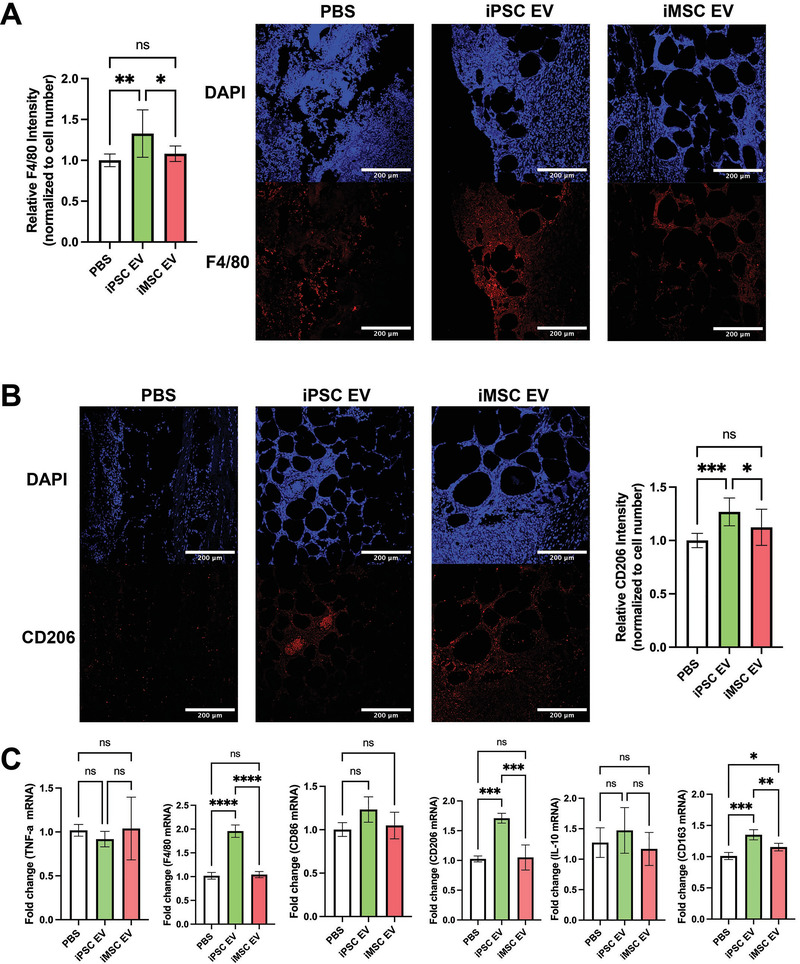
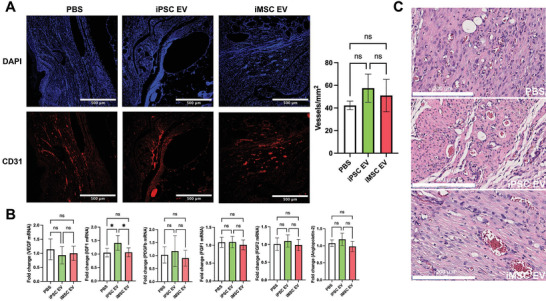
Extracellular vesicles (EVs) derived from mesenchymal stem/stromal cells (MSCs) have recently been explored in clinical trials for treatment of diseases with complex pathophysiologies. However, production of MSC EVs is currently hampered by donor-specific characteristics and limited ex vivo expansion capabilities before decreased potency, thus restricting their potential as a scalable and reproducible therapeutic. Induced pluripotent stem cells (iPSCs) represent a self-renewing source for obtaining differentiated iPSC-derived MSCs (iMSCs), circumventing both scalability and donor variability concerns for therapeutic EV production. Thus, it is initially sought to evaluate the therapeutic potential of iMSC EVs. Interestingly, while utilizing undifferentiated iPSC EVs as a control, it is found that their vascularization bioactivity is similar and their anti-inflammatory bioactivity is superior to donor-matched iMSC EVs in cell-based assays. To supplement this initial in vitro bioactivity screen, a diabetic wound healing mouse model where both the pro-vascularization and anti-inflammatory activity of these EVs would be beneficial is employed. In this in vivo model, iPSC EVs more effectively mediate inflammation resolution within the wound bed. Combined with the lack of additional differentiation steps required for iMSC generation, these results support the use of undifferentiated iPSCs as a source for therapeutic EV production with respect to both scalability and efficacy.

Keywords: exosomes; induced pluripotent stem cell-mesenchymal stem/stromal cells; induced pluripotent stem cells; inflammation; wound healing.


Conflict of interest statement

The authors declare no conflict of interest.

Figures

Figure 1
Figure 1
Characterization of EV size, morphology, and protein markers of EVs and parental cells. A) NTA concentration and size distribution profiles of donor matched iPSC, iMSC, and non‐donor matched BDMSC EVs. B) Western blot analysis of donor‐matched iPSC and iMSC EV markers ALIX and CD63 as well as Calnexin, a negative marker. C) TEM images of iPSC and iMSC EVs post‐isolation. D) Representative ICC images of SSEA4 and OCT4 expression to confirm pluripotency of EV‐producing iPSCs.
Figure 2
Figure 2
iPSC EVs have similar pro‐angiogenic potential to donor‐matched iMSC EVs. A) After resuspension in EV treatments, HUVEC tube formation was quantified by the number of branch points per bright field image (n = 3). B) After inducing a scratch, HUVECs were treated with EVs in basal media and the percentage of gap closure was assessed using bright field images (n = 4). All values were expressed as mean ± standard deviation (**p < 0.01, ***p < 0.001). In all cases, data are representative of at least three independent experiments and EV isolations.
Figure 3
Figure 3
iPSC EVs possess superior anti‐inflammatory properties compared to donor‐matched iMSC EVs. A) RAW264.7 mouse macrophages were pre‐treated with the indicated EV treatments before LPS stimulation. The cell supernatant was then collected and IL‐6, TNF‐α, CCL5, and IFN‐β protein levels were quantified using ELISA (n = 3). B) RAW264.7 mouse macrophages were pre‐treated with iPSC EVs at the indicated doses before LPS stimulation (10 ng mL−1). Cell supernatants were collected and IL‐6 levels were quantified using ELISA (n = 3). C) EVs isolated from iPSCs over multiple passages were used in the same LPS‐stimulated RAW264.7 macrophage assay and IL‐6 levels in the cell culture media was quantified via ELISA (n = 3). All values were expressed as mean ± standard deviation (*p < 0.05, **p < 0.01, ***p < 0.001, ****p < 0.0001). In all cases, data are representative of at least three independent experiments and EV isolations.
Figure 4
Figure 4
iPSCs EVs resolve inflammation by transitioning macrophages to an “M2” phenotype and reduce ROS levels. A) In a “post‐treat” regime, where RAW264.7s were stimulated with LPS, treated with EVs before lysis, anti‐inflammatory macrophage markers/cytokine mRNA expression levels were quantified via RT‐qPCR (n = 3). B) RAW264.7 mouse macrophages were pre‐treated with EVs before LPS stimulation (100 ng mL−1) and subsequent ROS quantification using a H2DCFDA fluorescent dye along with fluorescence quantification via plate reader (n = 6). All values were expressed as mean ± standard deviation (*p < 0.05, **p < 0.01, ***p < 0.001), ****p < 0.0001). In all cases, data are representative of at least three independent experiments and EV isolations.
Figure 5
Figure 5
iPSC and iMSC EVs have anti‐inflammatory effects in human cell models. A) HUVECs were pre‐treated with EVs for 24 h at a dose of 5E9 particles per mL before stimulation with 10 ng mL−1 TNFα for 16 h before lysing and quantification the endothelial adhesion marker, VCAM1 via RT‐qPCR. B) We looked to confirm the anti‐inflammatory effects of our EV samples in a human LPS‐stimulated THP1 macrophage assay. The conditioned media of stimulated THP1s was collected and TNF‐α levels were quantified via ELISA. All values were expressed as mean ± standard deviation (*p < 0.05, ****p < 0.0001). In all cases, data are representative of at least three independent experiments and EV isolations.
Figure 6
Figure 6
iPSC EVs do not improve wound closure rate in a db/db mouse wound healing model. A) Timeline of wounding, injection, and tissue harvesting. B) Wound closure rate was assessed over 15 days via planimetry from representative wound images for wounds treated with donor‐matched iPSC and iMSC EVs as well as a PBS vehicle control (n = 4–8). All values were expressed as mean ± standard deviation (**p < 0.01).
Figure 7
Figure 7
iPSC EVs improve wound tissue architecture during healing in a db/db mouse wound model. A) Representative images of H&E‐stained wound beds 6 days post‐wounding. Necrotic and apoptotic tissue are highlighted with red boxes. New epithelium was measured in length from the mature epithelium along the wound edge demarcated by black arrows (n = 3–4). B) Representative images of H&E‐stained wound beds 18 days post‐wounding. Total wound area was quantified by tracing the granulation tissue within the wound bed (n = 3–4). C) Representative images of H&E‐stained wound beds 18 days after wounding. Wound length was quantified by tracing and measuring the outer wound edge (n = 3–4). All values were expressed as mean ± standard deviation (*p < 0.05).
Figure 8
Figure 8
Inflammation‐resolving macrophages are increased upon iPSC EV treatment. A) Images of F4/80 IHC‐stained tissues 6 days after wounding. Total F4/80 fluorescence intensity was quantified and normalized to cell number via DAPI over multiple fields of view (n = 4). B) Representative images of CD206 IHC‐stained tissues 6 days post‐wounding. Again, CD206 fluorescence intensity was normalized to cell number for quantification (n = 4). C) Inflammatory/macrophage cytokine and surface markers were quantified via RT‐qPCR of mRNA isolated from bulk wound bed tissue 6 days post‐wounding (n = 4). All values were expressed as mean ± standard deviation (*p < 0.05, **p < 0.01, ***p < 0.001, ****p < 0.0001)
Figure 9
Figure 9
iPSC EVs marginally affect re‐vascularization during the proliferative phase of wound healing. A) Representative images of CD31 immunochemistry‐stained tissue. Blood vessels were counted within in a 1mm[ 2 ] field of view (n = 4). B) Pro‐angiogenic growth factor expression was quantified via RT‐qPCR from bulk mRNA isolated from wound tissue 18 days after wounding (n = 4). C) Representative images of H&E‐stained tissue showing the lumen of blood vessels and blood cells within them. All values were expressed as mean ± standard deviation (*p < 0.05).

Update of

References

    1. Nagelkerke A., Ojansivu M., Van Der Koog L., Whittaker T. E., Cunnane E. M., Silva A. M., Dekker N., Stevens M. M., Adv. Drug Delivery Rev. 2021, 175, 113775. - PubMed
    1. Keshtkar S., Azarpira N., Ghahremani M. H., Stem Cell Res. Ther. 2018, 9, 63. - PMC - PubMed
    1. Varderidou‐Minasian S., Lorenowicz M. J., Theranostics 2020, 10, 5979. - PMC - PubMed
    1. Murphy D. E., De Jong O. G., Brouwer M., Wood M. J., Lavieu G., Schiffelers R. M., Vader P., Exp. Mol. Med. 2019, 51, 32. - PMC - PubMed
    1. Zaborowski M. P., Balaj L., Breakefield X. O., Lai C. P., Bioscience 2015, 65, 783. - PMC - PubMed

Publication types

Substances