. 2023 Dec 8;25(12):2150-2162.
doi: 10.1093/neuonc/noad109.

Individual glioblastoma cells harbor both proliferative and invasive capabilities during tumor progression

Affiliations

Individual glioblastoma cells harbor both proliferative and invasive capabilities during tumor progression

Miriam Ratliff et al. Neuro Oncol. .

Abstract

Background: Glioblastomas are characterized by aggressive and infiltrative growth, and by striking heterogeneity. The aim of this study was to investigate whether tumor cell proliferation and invasion are interrelated, or rather distinct features of different cell populations.

Methods: Tumor cell invasion and proliferation were longitudinally determined in real-time using 3D in vivo 2-photon laser scanning microscopy over weeks. Glioblastoma cells expressed fluorescent markers that permitted the identification of their mitotic history or their cycling versus non-cycling cell state.

Results: Live reporter systems were established that allowed us to dynamically determine the invasive behavior, and previous or actual proliferation of distinct glioblastoma cells, in different tumor regions and disease stages over time. Particularly invasive tumor cells that migrated far away from the main tumor mass, when followed over weeks, had a history of marked proliferation and maintained their proliferative capacity during brain colonization. Infiltrating cells showed fewer connections to the multicellular tumor cell network, a typical feature of gliomas. Once tumor cells colonized a new brain region, their phenotype progressively transitioned into tumor microtube-rich, interconnected, slower-cycling glioblastoma cells. Analysis of resected human glioblastomas confirmed a higher proliferative potential of tumor cells from the invasion zone.

Conclusions: The detection of glioblastoma cells that harbor both particularly high proliferative and invasive capabilities during brain tumor progression provides valuable insights into the interrelatedness of proliferation and migration-2 central traits of malignancy in glioma. This contributes to our understanding of how the brain is efficiently colonized in this disease.

Keywords: cancer neuroscience; glioblastoma; migration; proliferation; tumor microtubes (TMs).


Conflict of interest statement

F.W., E.J., M.O. and W.W. report the patent (WO2017020982A1) “‘Agents for use in the treatment of glioma.’” F.W. is co-founder of DC Europa Ltd (a company trading under the name Divide and Conquer) that is developing new medicines for the treatment of glioma. Divide and Conquer also provides research funding to F.W.’s lab under a research collaboration agreement.

Figures

Figure 1.
Figure 1.
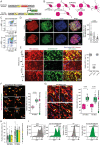
Tumor cell proliferation in patient-derived tumor samples can be found both in the tumor bulk and the infiltration zone. (A) Axial T1 contrast-enhanced (CE) MRI and T2 fluid-attenuated inversion recovery (FLAIR) MRI scans of MA01. Insets represent CE and FLAIR-hyperintensive but non-contrast-enhancing tumor (non-CE). (B) Representative spatially annotated immunofluorescence staining corresponding to the outlined regions (insets) within the MRIs in A. Nestin (green) marks tumor cells (see Supplementary Figure S1 for sensitivity and specificity of nestin as a marker for all cell states of GBCs). Ki67 (red) is expressed throughout the active cell cycle (G1, S, G2, and M phase). Hoechst dye (blue) stains nuclei. Arrowheads indicate Ki67 positive tumor cell nuclei. (C) Proliferation index relative to tumor cell density within representative single-plane scans of 200 µm2 in human tumor samples from 4 patients (MA1-4; Proliferation indices derived from CE tumor regions are encircled; Spearman rank correlation ρ and P values are given, the colored area along each regression line marks the 95% confidence interval; n = 10–15 images per patient tumor sample). Abbreviations: IZ, infiltration zone; TB, tumor bulk.
Figure 2.
Figure 2.
The Tet-Off-H2B-GFP System is a suitable methodology to track GBCs’ proliferative history. (A) Lentiviral constructs used for constitutive cytoplasmic tdTomato and doxycycline (Dox) dependent nuclear GFP expression. When present, Dox suspends GFP expression. (B) The mitotic history of each cell can be tracked by its nuclear GFP intensity over time because GFP intensity per cell is roughly halved with every cell division. (C) Exemplary flow cytometry analysis of S24 and P3 tdTomato GBCs transduced with Tet-Off-H2B-GFP show stable nuclear GFP expression (n = 5–6 replicates per GBC). (D-G) GFP intensity was reduced over time in the presence of Dox when cultivated in vitro, both in 2 and 3 dimensions, and when grown in vivo. Left panels show representative micrographs at different time points from the respective experiments; associated box plots summarize measurements of relative GFP intensity. (D) Reduction of GFP intensity in S24 spheroids in the presence of Dox (n = 10 spheroids, 185–200 GBCs quantified per time point). (E) Representative in vivo 2-photon laser scanning microscopy (IV2PM) of S24 GBCs (z = 40 µm). No Dox was administered during the first 38 days after tumor cell implantation. After 4 weeks of Dox exposure, GFP was significantly reduced at day 70. GFP expression resumed after Dox was withheld (each time point n = 4 regions in n = 3 mice, 347–433 GBCs quantified). (F) Relative change of GFP intensity in 23 P3 GBCs grown in the serum-free monolayer that underwent cell division and 30 P3 GBCs that did not divide within a time frame of 7 hours. In vitro time series. Mean GFP intensity of the 2 daughter GBCs, normalized to their cytoplasmic tdTomato, was measured as a fraction of the corresponding parental GBC. (G) Data obtained by IV2PM time-series (z = 40 µm) of S24 GBCs in vivo. Relative GFP reduction was quantified in 7 dividing S24 and 9 dividing P3 GBCs compared to 29 and 30 non-dividing GBCs, respectively. GFP values were normalized to cytoplasmatic tdTomato of the respective cell. (H) Analysis of the Ki67+ growth indices of the parental S24 and P3 wild-type GBC orthotopically growing in vivo show no significant difference compared to the GBCs stably transduced with the lentiviral constructs used in this study (n = 3 mice for the wild-type GBCs and one mouse for each stably transduced GBC model, S24 GBCs P = .132; P3 GBCs P = .172) (I) Exemplary flow cytometry analysis of S24 and P3 Tet-Off-H2B-GFP tdTomato GBCs revealed no significant differences in the Ki67+ growth fraction compared to the respective parental wild-type cell line (n = 3–4 replicates per GBC; S24 GBCs P = .499; P3 GBCs P = .663). ANOVA on ranks with Dunn’s multiple comparison method was used for the data presented in D-E and H. Two-tailed unpaired Student’s t-test was used for the data presented in F-G and I. Values in C and I are presented as mean ± SD. Arrowheads indicate dividing cells.
Figure 3.
Figure 3.
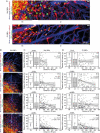
Invasive GBCs in the mouse brain have a particularly active proliferative history. (A) Representative in vivo images of S24 and P3 GBC tumor bulk and invasion zones. GBCs are transduced with Tet-Off-H2B-GFP. Dox was administered throughout tumor development. Its high tumor cell density characterizes the tumor bulk, on the left, with most cells interconnected within the tumor cell network. The invasion zone, on the right, is sparsely populated with GBCs. The S24 image is derived from the larger D28 image in (B), outlined with a dashed rectangle. The infiltrating GBCs show a neural progenitor-like morphology with tumor network-unconnected 1 or 2 tumor microtubes (B) Sequential weekly images of identical microregions covering a section of the outer tumor bulk border and the infiltration zone of S24 GBCs during 4 weeks of tumor progression (z = 90 µm). See Supplementary Figure S3A for images of the individual channels. (C,D) Quantification of GFP intensity in individual S24 (C) and P3 (D) GBCs in vivo. Right panels: Scatter blots illustrate the correlation between distance of tumor cell infiltration and GFP intensity of individual GBCs. GFP intensity was normalized to the 10% GBCs with the highest intensity values at each time-point (n = 3 mice per cell line, S24 196-473 GBCs quantified for each time-point, P3 194-421 GBCs quantified for each time-point). Two-sided Student’s t-tests were used to compare GFP intensity within the tumor bulk and the infiltration zone (box blots). Spearman’s rank correlation coefficient, linear regression lines, and 95% CI ranges are given to analyze the relation of nuclear GFP intensity and distance to tumor bulk of individual GBCs at indicated time points (dot blots). Abbreviations: IZ, infiltration zone; TB, tumor bulk.
Figure 4.
Figure 4.
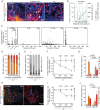
TM-dependent GBC subpopulations differ in their proliferative potential. (A) Left, a representative IV2PM of a S24 GBC tumor growing in vivo (z = 90 µm). The tumor bulk is comprised of densely arranged glioma tumor cells that form multiple tumor microtubes (TMs) to build a highly interconnected tumor cell network. The interconnectivity decreases towards the transition zone, the surface of the main tumor (inset 1). Infiltrating GBCs (inset 2) are rarely interconnected. Inset 1: Connected GBCs with multiple TMs coexist with neural progenitor-like tumor cells (white arrowhead). The connected GBCs maintained their nuclear GFP (outlined with dashed white circle). The neural progenitor-like tumor cells displayed a reduced nuclear GFP intensity. Inset 2: The neural progenitor-like tumor cells dominate the infiltration zone and have mostly lost their nuclear GFP. (B) Quantification of S24 nuclear GFP (box blots) and S24 tumor cell density (black dots show mean GBC density ± SEM) in identical 3D infiltration zone microregions measured weekly for 28 days (S24 nuclear GFP intensity decreases significantly over time, Kruskal–Wallice one way ANOVA on ranks; the mean tumor cell density increased but did not reach statistical significance over the course of 4 weeks P = .178; n = 3 mice, one way ANOVA). (C) Left, box plot, quantification of relative GFP intensity of S24 GBCs in the tumor infiltration zone on day 28 after implantation, among tumor cells grouped according to the number of TMs they possess; right, dot blots, disaggregation of tumor cell GFP intensity and infiltration distance within the groups defined by their number of TMs. Compared to S24 GBCs with >4 TMs (mean infiltration distance of 65 µm), S24 GBCs without TMs at the time of image acquisition (mean infiltration distance of 134 µm; P < .001) and the neural progenitor-like S24 GBC with 1 or 2 TMs (mean infiltration distance of 197 µm, P < .001) covered a longer infiltration distance. GFP intensity was normalized to the 10% GBCs with the highest intensity values (n = 3 mice, 289 GBCs analyzed, t-test, Mann–Whitney rank sum test). (D) Changes in prevalence of the various morphological S24 GBC subtypes within the infiltration zone. Over time the fraction of the neural progenitor-like tumor cells decreases to the benefit of the glioma cell subtype with more TMs. (E) Changes in tumor cell interconnectivity over time. S24 GBCs form more interconnections over time to build a multicellular network of tumor cells (connection, C). (F) Measurement of nuclear GFP intensity in the S24 neural progenitor-like GBCs as a fraction of the corresponding GBCs with >4 TMs (horizontal line). For the comparison, mean GFP values of GBCs with >4 TMs were set to 1 at each time point. As no GBCs with >4 TMs were found at day 7, their mean GFP intensity value at day 14 was used instead (n = 3 mice, 38–197 S24 neural progenitor-like GBCs measured; t-test, Mann–Whitney rank sum test, data are presented as mean ± SEM). (G) S24 GBCs of the infiltration zone were divided into low and high GFP intensity groups relative to the median nuclear GFP intensity and were further stratified according to the number of TMs they possessed. The low GFP group included 180 GBCs and the high GFP group (equal to or higher than median GFP intensity) included 183 GBCs (n = 3 mice, 363 S24 GBCs quantified, Student’s t-test, columns are mean ± SEM). (H) Representative IV2PM illustrating the dynamic changes of nuclear GFP expression within the infiltration zone of a mature S24 GBC tumor at day 43 and day 64 (z = 40 µm). Dietary Dox administration was started at day 43. On day 43 the neural progenitor-like tumor cell dominated the infiltration zone. On day 64, after 4 weeks of brain colonization in the presence of Dox, GBCs have morphologically evolved into tumor cells now frequently attributed with more interconnecting TMs forming a multicellular tumor network. (I) Measurement of nuclear GFP intensity in mature tumor in vivo in the S24 neural progenitor-like glioma cell as fraction of the corresponding mean nuclear GFP intensity in GBCs with >4 TMs (horizontal line). Analysis was performed as described above for F (n = 3 mice, 109–150 neural progenitor-like GBCs measured; t-test, Mann–Whitney rank sum test, data are presented as mean ± SEM). (J) Analysis of nuclear GFP intensity in a mature S24 GBC tumor on day 64 after 4 weeks of dietary Dox. Quantification as described above for G. The low GFP and high GFP groups each included 173 GBCs (n = 3 mice, 346 S24 GBCs quantified, Student’s t-test). Abbreviations: C, connection; IZ, infiltration zone; TB, tumor bulk.
Figure 5.
Figure 5.
Glioblastoma cell states are connected to invasivity, and second reporter system. (A) Representative confocal microscopy images of a dense and sparse serum-free S24 GBC monolayer labeled with LipiLight-488 membrane dye. (B) Pie chart illustrating the frequency of neural precursor-like cells based on their ≤2 TM morphology in sparse and dense serum-free S24 GBC monolayer. The rate of S24 GBCs with ≤2 TM is significantly higher under sparse conditions (P < .00001, Fisher’s exact test). (C) All cells were assigned to either G1S or G2M cycling or non-cycling cell states. Frequency of cycling cells (combined G1S and G2M cells) is enhanced in the sparse condition (Fisher´s exact test). (D) Fold change of pooled NPC/OPC population versus AC/MES in sparse and dense conditions after reassigning G1S and G2M GBCs to the best matching non-cycling cell state shows a significant enrichment of the NPC/OPC population in sparse culture conditions (Fisher´s exact test). (E) Scheme of EF1-mVenus-p27K expressing nuclear mVenus in non-cycling cells. Proliferating cells are tdTomato+mVenus-; non-proliferating cells are tdTomato+mVenus+. (F) Flow cytometry analyses of S24 serum-free neurosphere cultures stably expressing EF1-mVenus-p27K. The Ki67+ growth fraction within the cycling mVenus- GBC subpopulation and within the mVenus+ GBC subpopulation (a total of 34 742 GBCs quantified). (G) Scatter blot showing the proliferation index (mVenus) relative to tumor cell density within representative 3D microregions of 400 µm2 and z = 30 µm in GBC xenografts (Spearman rank correlation ρ and P values are given, the colored area along the regression line marks the 95% confidence interval; n = 31 images from 4 mice). (H) Representative IV2PM images of a S24 EF1-mVenus-p27K GBC tumor on day 51 (z = 60 µm). Various tumor cell densities represent areas of the infiltration zone (IZ; top row) and the tumor bulk (TB; bottom row). The infiltration zone was almost exclusively composed of unconnected, GBCs with 1 or 2 TMs. Arrowheads indicate proliferating cells. Abbreviations: IZ, infiltration zone; TB, tumor bulk.
Figure 6.
Figure 6.
Proliferative capabilities of GBCs derived from the resected human infiltration zone are higher than those from the tumor bulk. (A) Representative pre-operative MRI of a glioblastoma patient (left: Axial contrast-enhanced T1-weighted image, right: Axial FLAIR image); insets indicate sampling sites. (B) Scheme illustrates derivation of clinical cell samples. Samples were expanded separately for 5 passages before analysis. (C-F) Proliferation kinetics between passages 5 and 10. (C) Cell growth kinetics comparing patient-derived tumor cells from the core of the tumor-population doublings (PDs) per day (mean 0.19 PD/day) to PD of tumor cells derived from the periphery of the tumor (mean 0.29 PDs/day; tumor bulk (TB) n = 54 samples; infiltration zone (IZ) n = 158 samples from the 54 patients). (D) Quantification of GBC expansion time necessary for 5 passages (GBCs from tumor bulk, mean 32 days; GBCs from infiltration zone, mean 19 days; tumor bulk n = 54; infiltration zone n = 158). (E,F) Differences in proliferation and expansion kinetics were not due to differences in growth kinetic stability through continuous in vitro passaging as determined by linear regression analysis (P = .0556; tumor bulk n = 14; infiltration zone n = 54) or differences in cell density in culture dishes (P = .05531; tumor bulk n = 54; infiltration zone n = 158). Note, a regression index of R2 close to 1 indicates a consistent proliferative activity over time. Abbreviations: IZ, infiltration zone; PD, population doubling of propagated cultures; TB, tumor bulk.

Comment in

Similar articles

Cited by

References

    1. Venkataramani V, Yang Y, Schubert MC, et al. . Glioblastoma hijacks neuronal mechanisms for brain invasion. Cell. 2022;185(16):2899–2917. - PubMed
    1. Giese A, Bjerkvig R, Berens ME, Westphal M.. Cost of migration: Invasion of malignant gliomas and implications for treatment. J Clin Oncol. 2003;21(8):1624–1636. - PubMed
    1. Drumm MR, Dixit KS, Grimm S, et al. . Extensive brainstem infiltration, not mass effect, is a common feature of end-stage cerebral glioblastomas. Neuro Oncol. 2020;22(4):470–479. - PMC - PubMed
    1. Sahm F, Capper D, Jeibmann A, et al. . Addressing diffuse glioma as a systemic brain disease with single-cell analysis. Arch Neurol. 2012;69(4):523–526. - PubMed
    1. Garofano L, Migliozzi S, Oh YT, et al. . Pathway-based classification of glioblastoma uncovers a mitochondrial subtype with therapeutic vulnerabilities. Nat Cancer. 2021;2(2):141–156. - PMC - PubMed

Publication types