. 2023 Sep 22;193(2):1395-1415.
doi: 10.1093/plphys/kiad340.

Autophagy during maize endosperm development dampens oxidative stress and promotes mitochondrial clearance

Affiliations

Autophagy during maize endosperm development dampens oxidative stress and promotes mitochondrial clearance

Jessica A S Barros et al. Plant Physiol. .

Abstract

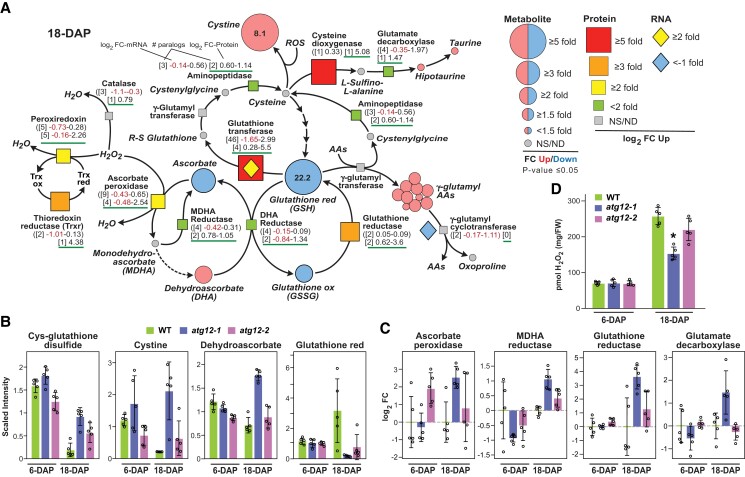
The selective turnover of macromolecules by autophagy provides a critical homeostatic mechanism for recycling cellular constituents and for removing superfluous and damaged organelles, membranes, and proteins. To better understand how autophagy impacts seed maturation and nutrient storage, we studied maize (Zea mays) endosperm in its early and middle developmental stages via an integrated multiomic approach using mutants impacting the core macroautophagy factor AUTOPHAGY (ATG)-12 required for autophagosome assembly. Surprisingly, the mutant endosperm in these developmental windows accumulated normal amounts of starch and Zein storage proteins. However, the tissue acquired a substantially altered metabolome, especially for compounds related to oxidative stress and sulfur metabolism, including increases in cystine, dehydroascorbate, cys-glutathione disulfide, glucarate, and galactarate, and decreases in peroxide and the antioxidant glutathione. While changes in the associated transcriptome were mild, the proteome was strongly altered in the atg12 endosperm, especially for increased levels of mitochondrial proteins without a concomitant increase in mRNA abundances. Although fewer mitochondria were seen cytologically, a heightened number appeared dysfunctional based on the accumulation of dilated cristae, consistent with attenuated mitophagy. Collectively, our results confirm that macroautophagy plays a minor role in the accumulation of starch and storage proteins during maize endosperm development but likely helps protect against oxidative stress and clears unneeded/dysfunctional mitochondria during tissue maturation.


Conflict of interest statement

Conflict of interest statement. None declared.

Figures

Figure 1.
Figure 1.
Atg12 mutations, while attenuating autophagy, do not impair starch and seed storage protein accumulation in the maize endosperm. A)atg12 seeds develop normally. Photographs of homozygous atg12-1 and atg12-2 cobs and individual whole and dissected seeds next to those from their corresponding wild type (WT) at 8 and 18 DAP. The images were digitally placed on a black background. Endo, endosperm; Emb, embryo. Scale bar = 1 mm. B and C)atg12 seeds accumulate major seed storage proteins normally. Total aqueous extracts B) and ethanol-soluble extracts enriched for Zeins C) from endosperm harvested at 6 and 18 DAP. Equal volumes of extracts were subjected to SDS–PAGE and stained for protein with Coomassie Blue. D) Ethanol-soluble extracts from C) subjected to immunoblot analysis with antibodies against α- and γ-Zeins. E)atg12 mutants accumulate starch normally. Starch levels were quantified spectrophotometrically after hydrolysis to glucose from 5 biological replicates (±Sd) from WT and atg12 endosperm at 6 and 18 DAP. F and G)atg12 seeds have defective autophagy as evidenced by the hyperaccumulation of ATG8 and NBR1. atg12 and WT samples from 6 and 18 DAP endosperm were either subjected to immunoblot analysis with antibodies against Arabidopsis ATG8a or NBR1 F) or quantified for the ATG8d (GRMZM2G134613) and NBR1a (GRMZM2G09447) isoforms in total cell extracts by LC-MS/MS G). Near equal loading in F) was confirmed by immunoblot analysis with anti-histone H3 antibodies. Mean values in G) were determined from the MS1 precursor ion intensities from 5 biological replicates (±Sd) each analyzed by 4 technical replicates. All values were normalized to the mean value for WT endosperm at 6 or 18 DAP. H) Levels of the ATG8d and NBR1a mRNAs in the endosperm are unaffected by the atg12 mutations. polyA+ mRNA isolated from the same endosperm as in G) were subjected to RNA-seq. Each bar represents the mean log2 FC of 3 biological replicates (±Sd). All values were normalized to the mean value for WT endosperm at 6 or 18 DAP. Log2 FC for the ATG8d and NBR1a proteins and mRNAs in G and H) used in the same floating scale dimensions to permit direct comparisons.
Figure 2.
Figure 2.
Metabolic responses of maize atg12 endosperm at 6 and 18 DAP. A) PCA of the metabolome, transcriptome, proteome, and ionome data sets for 6- and 18-DAP endosperm collected from atg12-1, atg12-2, and wild-type (WT) seeds. The values were calculated from log2-transformed ion counts for the metabolome and ionome data sets (n = 5 biological replicates), median-normalized log2-transformed transcript counts for the transcriptomic data sets (n = 3 mean biological replicates), and log2-transformed MS1 precursor ion intensities for the proteomic data sets (n = 5 biological replicates, each with 4 technical replicates). The amounts of variation explained by the first 2 components are indicated on the axes. The dashed circles outline the PC coordinates for the biological replicates from each genotype/sample. B) Heat maps comparing the abundances of 440 metabolites measured in atg12-1, atg12-2, and WT endosperm at 6 and 18 DAP. The metabolites were quantified by LC-MS from 5 biological replicates each prepared from 30 to 50 seeds. The relative abundance of each metabolite was calculated by Z-scores after normalization of each mean value generated with WT at each developmental time point. The metabolites were clustered based on chemical type and specific subcategory. C) Scatterplots showing strong correlations for affected metabolites in atg12-1 and atg12-2 endosperm at 6 and 18 DAP. The dashed line shows the correlation within each comparison. Log2 FC values (atg12/WT) for metabolites significantly impacted in both atg12 backgrounds (P ≤ 0.05; q ≤ 0.05; 80 for 6-DAP and 70 for 18-DAP samples) and for the rest of the 440 metabolites are shown in red and gray, respectively. The Pearson correlation coefficient (Corr) and fit (R2) values are indicated. D) Metabolic pathway overrepresentation and topology analysis determined by MetaboAnalyst for metabolites that differed significantly in both atg12 alleles compared to those from WT. P-values generated as in (Chong et al. 2019) reflect overrepresentation of each category, while the pathway impact weighs the importance of the affected metabolites within the pathway. Significantly impacted pathways/clusters are indicated. Yellow box highlights pathways with insignificant impact values (impact <0.15 and −log10P < 2). E) Metabolic enrichment of specific metabolic pathways showed in the heat maps. The enrichment was generated by clusterProfiler package in R and was based on the −log10P-value enrichment comparisons of the metabolite levels within each pathway between WT and atg12 endosperm.
Figure 3.
Figure 3.
Specific metabolic clusters that are substantially impacted by ATG12 in maize endosperm. A) Cytoscape clustering of metabolites related to glutathione/ascorbate, serine, and glutamate metabolism that showed significant FCs for atg12-1 versus wild-type (WT) endosperm at 18 DAP. The sizes of the circles reflect FC in abundance between the WT and atg12-1; red indicates FC significantly higher in atg12-1, blue indicates FC significantly higher in the WT, and gray indicates no significant difference. FC values ≥5 are indicated. Cytoscape clusterings of all 440 metabolites in 6 and 18 DAP samples are displayed in Supplemental Figs. S6 and S7. NS, not significant. B) Specific metabolites that differentially accumulate in atg12-1 endosperm at 6 and/or 18 DAP. Each bar represents the mean of 5 biological replicates (±Sd). Glucarate and galactarate are the oxidized products of glucose and galactose, respectively, S-methylcysteine is a methylated derivative of cysteine, hydroxyproline is the hydroxylated version of proline, 1-linoleoyl-GPA (18:2) and 1-steroyl-GPA (18:2) are intermediates of phospholipid degradation, N-acetylglutamate is a condensate of glutamate and acetyl-CoA, and indoleacetylaspartate is connected to auxin metabolism.
Figure 4.
Figure 4.
ATG12 mildly impacts the maize endosperm transcriptome. A) Heat maps showing the log2 FC in transcript abundance in 6 and 18 DAP endosperm from the atg12-1 and atg12-2 mutants versus wild type (WT). Abundances were calculated using EBSeq and were normalized to the mean values obtained for WT. Of the 33,066 total transcripts detected, 539 were found to be DEGs with either log2 FC ≥ 0.5 up or ≤−0.5 down in both mutants. B) Venn diagram showing the overlap in the numbers of transcripts that were consistently up- or downregulated in both atg12 mutants versus WT in 6- and 18-DAP endosperm. C) Scatterplots of significantly affected transcripts identified in B) that compared the 2 atg12 mutants versus WT. The total number of significantly affected transcripts analyzed is indicated in each plot, along with Pearson correlation coefficient (Corr) and fit (R2) values. The dashed line shows the correlation within each comparison. D) Specific GO terms for DEGs that were significantly enriched or depleted in the atg12 backgrounds versus WT for 6- and 18-DAP endosperm. Log10 fold enrichment/depletion values were based on a singular enrichment of specific GO terms for transcripts consistently altered in abundance for 2 atg12 backgrounds. E) Response of representative endosperm transcripts differentially impacted by development and the atg12 mutations. Shown are the responses of transcripts encoding a putative GDH, glutamine synthetase (GLN)-2, S-adenosylmethionine synthase (SAM)-1, spermine synthetase (SPDS)-1, the DNA replication complex subunit B (RPA70B), and RNR-1. Each bar represents the mean log2 FC of 3 biological replicates (±Sd) from endosperm collected at 6 and 18 DAP from WT, atg12-1, and atg12-2 seeds.
Figure 5.
Figure 5.
The maize endosperm proteome is substantially altered by atg12 mutations. A) Volcano plots comparing protein abundance in 6- and 18-DAP endosperm from the atg12-1 mutant versus wild type (WT). Protein abundances were quantified by LC-MS/MS based on the MS1 precursor ion intensities, normalized by a collection of 150 stable proteins, and plotted based on their log2 FC in abundance (atg12-1/WT) and their −log10P-value in significance. The dashed yellow boxes outline the collection of proteins whose abundances did not significantly differ in atg12-1 versus WT (FC < 1.5-fold or −log10P > 0.05). The mean value for each protein was determined from 5 biological replicates, each analyzed by 4 technical replicates. The enlargements highlight a section of the volcano plots containing proteins with significant P-values that were at least 1.5-fold and 4-fold more abundant in the atg12-1 mutant at 6 and 18 DAP, respectively. Select significantly affected proteins are indicated. Proteins connected to autophagy, histones, and the collection of normalization proteins are colored in cyan, orange, and red, respectively. Comparable volcano plots for atg12-2 endosperm at 6 and 18 DAP can be found in Supplemental Fig. S10. The total number of proteins analyzed (n) and the numbers in the indicated quadrants are shown. B) Scatterplots comparing significantly affected proteins in the 2 atg12 alleles versus WT. The total number of significantly affected proteins analyzed is indicated in each plot, along with Pearson correlation coefficient (Corr) and fit (R2) values. Dashed lines show the correlation within each comparison. C and D) Specific GO terms for proteins that were significantly enriched or depleted in the atg12-1 endosperm versus WT at 6 DAP C) and 18 DAP D). Log10 fold enrichment/depletion values were based on a singular enrichment of specific GO terms for proteins consistently altered in abundance for the atg12-1 background.
Figure 6.
Figure 6.
Comparisons between transcript and protein abundances for atg12 endosperm. A) Scatterplots showing the relation between log2 FC in protein abundance versus the log2 FC in mRNA abundance in atg12-1 versus wild-type W22 (WT) endosperm at 6 and 18 DAP. The different colored regions indicate sectors that contain proteins and/or mRNAs whose abundances were impacted ≥2-fold by the atg12-1 mutation. Yellow, proteins (but not mRNA) that were more abundant in WT; orange, mRNAs (but not proteins) that were more abundant in atg12-1; blue, proteins (but not mRNAs) that were more abundant in atg12-1; green, proteins and their mRNAs that were both more abundant in atg12-1; and gray, mRNAs (but not proteins) that were less abundant in WT. The total number of proteins/transcripts (n) analyzed and the number of proteins in each sector are shown in parentheses. Proteins connected to autophagy and histones are colored in red and orange, respectively. Specific outlier proteins/mRNAs are labeled. The dashed yellow boxes outline the collection of proteins whose protein and transcript abundances did not significantly differ in atg12-1 versus WT (<2-fold). The white cross shows the mean FC value for all protein detected. B) GO term enrichment for proteins found within the blue and yellow sectors in (A) based on a FC ≥ 2 (blue) or ≤−2 (yellow) in protein abundance but not mRNA abundance in atg12-1 versus WT at each developmental point. C) Scatterplots highlighting the protein/mRNA ratios for proteins associated with mitochondria (blue) and the ribonucleoprotein complex (green). All other proteins are in gray. Pearson correlation coefficient (Corr) and fit (R2) values are given for each selection. The dashed lines show the correlation for the highlighted proteins. The dashed red boxes outline the collection of proteins whose protein and transcript abundances did not significantly differ in atg12-1 versus WT (FC < 2). The yellow crosses show the mean FC value for all detected protein from mitochondria and the ribonucleoprotein complex. The number of proteins (but not mRNA) significantly up or down (FC ≥ 2 or ≤−2) is shown in parentheses. n, total number of selected proteins analyzed.
Figure 7.
Figure 7.
Maize endosperm mitochondria and their proteomes are affected by autophagy. A) Volcano plots showing the preferential accumulation of proteins assigned by GO to mitochondria (total) or to specific mitochondrial sub-compartments/complexes in atg12-1 versus wild-type (WT) endosperm at 6 and 18 DAP. Protein abundances were quantified by LC-MS/MS as in Fig. 5 and plotted based on their log2 FC in abundance (atg12-1/WT) and their −log10P-value in significance. The dashed yellow boxes outline those proteins whose abundances did not significantly differ in atg12-1 versus WT (FC < 1.5-fold or P > 0.05). Representative proteins specific for each sub-compartment/complex with significantly altered levels (up or down) are labeled. The total number of detected proteins assigned to mitochondria or each sub-compartment/complex (n) and those that significantly increased or decreased are in parentheses. B) Simplified flow chart of the mitochondrial electron transport chain and TCA cycle describing how levels of the associated metabolites and relevant proteins and their corresponding mRNAs were altered by the atg12-1 mutation in 18-DAP endosperm. FCs as compared to WT of each metabolite and associated protein and mRNA are indicated by the size of the geometric shapes (see legend). NS and ND, not significant and not detected, respectively. C) Examples of specific proteins associated with the mitochondrial respiratory Subcomplexes I, II, III, and V that differentially accumulated in atg12-1 endosperm. Log2 FCs in protein abundances were quantified by LC-MS/MS as in A). Each bar represents the mean of 5 biological replicates each analyzed by 4 technical replicates (±Sd). All values were normalized to the mean value for WT at either 6 or 18 DAP. D) The atg12-1 mutation alters the morphology of starchy endosperm mitochondria. Shown are transmission electron microscopic images from representative normal mitochondria in WT and abnormal mitochondria with dilated/abnormal cristae (red stars) in atg12-1 starchy endosperm cells harvested at 20 DAP. Scale bars = 500 nm. E) Quantification of total, normal, and dilated mitochondria and mitochondrial area in WT and atg12-1 endosperm cells analyzed as in D). Mitochondrial area per cell and numbers of normal/dilated mitochondria per µm2 were quantified from 32 cells from 2 to 3 kernels for each genotype. In each box plot, the center orange box indicates the median, the green/blue box encompasses the upper and lower quartiles, the error bar shows the maximum and minimum of the distribution, and circles indicate individual data points (n = 32). Asterisks indicate significant differences based on the two-tailed Students’ t test.
Figure 8.
Figure 8.
Atg12 mutations alter redox metabolism in maize endosperm. A) Simplified flow chart of various pathways involved in redox metabolism describing how the associated metabolites are impacted by the atg12 mutations in 18-DAP endosperm and how relevant enzymes changed with respect to their protein and corresponding mRNA levels. FCs as compared to wild type (WT) of each metabolite and associated protein and corresponding mRNA are indicated by the size of the geometric shapes (see legend). NS and ND, not significant and not detected, respectively. B) Examples of key redox metabolites that differentially accumulate in atg12-1 starchy endosperm. Each bar represents the mean of 5 biological replicates (±Sd). C) Examples of key redox enzymes that differentially accumulate in atg12-1 endosperm at 6 and 18 DAP. Log2 FCs in protein abundance were quantified by LC-MS/MS based on the MS1 precursor ion intensities. Each bar represents the mean of 5 biological replicates (±Sd), each analyzed by 4 technical replicates. All values were normalized to the mean value for WT endosperm at 6 and 18 DAP. D) Levels of H2O2 in 6- and 18-DAP endosperm. Each bar represents the mean of 5 biological replicates (±Sd), each assayed in duplicate by the Amplex Red assay. Asterisks indicate a significant difference based on the 2-tailed Students’ t test.

Comment in

Similar articles

Cited by

  • The lowdown on breakdown: Open questions in plant proteolysis.
    Eckardt NA, Avin-Wittenberg T, Bassham DC, Chen P, Chen Q, Fang J, Genschik P, Ghifari AS, Guercio AM, Gibbs DJ, Heese M, Jarvis RP, Michaeli S, Murcha MW, Mursalimov S, Noir S, Palayam M, Peixoto B, Rodriguez PL, Schaller A, Schnittger A, Serino G, Shabek N, Stintzi A, Theodoulou FL, Üstün S, van Wijk KJ, Wei N, Xie Q, Yu F, Zhang H. Eckardt NA, et al. Plant Cell. 2024 Sep 3;36(9):2931-2975. doi: 10.1093/plcell/koae193. Plant Cell. 2024. PMID: 38980154 Free PMC article. Review.
  • Vacuolar degradation of plant organelles.
    Otegui MS, Steelheart C, Ma W, Ma J, Kang BH, De Medina Hernandez VS, Dagdas Y, Gao C, Goto-Yamada S, Oikawa K, Nishimura M. Otegui MS, et al. Plant Cell. 2024 Sep 3;36(9):3036-3056. doi: 10.1093/plcell/koae128. Plant Cell. 2024. PMID: 38657116 Free PMC article. Review.
  • Mitochondrial proteases and their roles in mitophagy in plants, animals, and yeast.
    Ludwig K, Heidorn-Czarna M. Ludwig K, et al. Plant Cell Physiol. 2025 Aug 12;66(7):973-990. doi: 10.1093/pcp/pcaf038. Plant Cell Physiol. 2025. PMID: 40269524 Free PMC article. Review.
  • A tissue-specific rescue strategy reveals the local roles of autophagy in leaves and seeds for resource allocation.
    Marmagne A, Chardon F, Masclaux-Daubresse C. Marmagne A, et al. Plant Physiol. 2024 Dec 23;197(1):kiae647. doi: 10.1093/plphys/kiae647. Plant Physiol. 2024. PMID: 39661375 Free PMC article.
  • Autophagy in plants.
    Petersen M, Avin-Wittenberg T, Bassham DC, Dagdas Y, Fan C, Fernie AR, Jiang L, Mishra D, Otegui MS, Rodriguez E, Hofius D. Petersen M, et al. Autophagy Rep. 2024 Oct 15;3(1):2395731. doi: 10.1080/27694127.2024.2395731. eCollection 2024. Autophagy Rep. 2024. PMID: 40395529 Free PMC article. Review.

References

    1. Arcalís E, Hörmann-Dietrich U, Stöger E. Multiscale imaging reveals the presence of autophagic vacuoles in developing maize endosperm. Front Plant Sci. 2023:13:1082890. 10.3389/fpls.2022.1082890 - DOI - PMC - PubMed
    1. Avin-Wittenberg T, Bajdzienko K, Wittenberg G, Alseekh S, Tohge T, Bock R, Giavalisco P, Fernie AR. Global analysis of the role of autophagy in cellular metabolism and energy homeostasis in Arabidopsis seedlings under carbon starvation. Plant Cell 2015:27(2):306–322. 10.1105/tpc.114.134205 - DOI - PMC - PubMed
    1. Barros JAS, Magen S, Lapidot-Cohen T, Rosental L, Brotman Y, Araújo WL, Avin-Wittenberg T. Autophagy is required for lipid homeostasis during dark-induced senescence. Plant Physiol. 2021:185(4):1542–1558. 10.1093/plphys/kiaa120 - DOI - PMC - PubMed
    1. Brumbarova T, Le CTT, Bauer P. Hydrogen peroxide measurement in Arabidopsis root tissue using Amplex Red. Bio-protocols 2016:6:e199. 10.21769/BioProtoc.1999 - DOI
    1. Bu F, Yang M, Guo X, Huang W, Chen L. Multiple functions of ATG8 family proteins in plant autophagy. Front Cell Dev Biol. 2020:8:466. 10.3389/fcell.2020.00466 - DOI - PMC - PubMed

Publication types

LinkOut - more resources