Lessons from relatives: C4 photosynthesis enhances CO2 assimilation during the low-light phase of fluctuations
- PMID: 37335935
- PMCID: PMC10517189
- DOI: 10.1093/plphys/kiad355
Lessons from relatives: C4 photosynthesis enhances CO2 assimilation during the low-light phase of fluctuations
Abstract
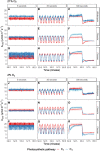
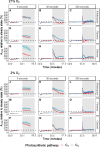
Despite the global importance of species with C4 photosynthesis, there is a lack of consensus regarding C4 performance under fluctuating light. Contrasting hypotheses and experimental evidence suggest that C4 photosynthesis is either less or more efficient in fixing carbon under fluctuating light than the ancestral C3 form. Two main issues have been identified that may underly the lack of consensus: neglect of evolutionary distance between selected C3 and C4 species and use of contrasting fluctuating light treatments. To circumvent these issues, we measured photosynthetic responses to fluctuating light across 3 independent phylogenetically controlled comparisons between C3 and C4 species from Alloteropsis, Flaveria, and Cleome genera under 21% and 2% O2. Leaves were subjected to repetitive stepwise changes in light intensity (800 and 100 µmol m-2 s-1 photon flux density) with 3 contrasting durations: 6, 30, and 300 s. These experiments reconciled the opposing results found across previous studies and showed that (i) stimulation of CO2 assimilation in C4 species during the low-light phase was both stronger and more sustained than in C3 species; (ii) CO2 assimilation patterns during the high-light phase could be attributable to species or C4 subtype differences rather than photosynthetic pathway; and (iii) the duration of each light step in the fluctuation regime can strongly influence experimental outcomes.
© The Author(s) 2023. Published by Oxford University Press on behalf of American Society of Plant Biologists.
Conflict of interest statement
Conflict of interest statement. None declared.
Figures


Similar articles
-
Activation of CO2 assimilation during photosynthetic induction is slower in C4 than in C3 photosynthesis in three phylogenetically controlled experiments.Front Plant Sci. 2023 Jan 4;13:1091115. doi: 10.3389/fpls.2022.1091115. eCollection 2022. Front Plant Sci. 2023. PMID: 36684779 Free PMC article.
-
Effects of elevated CO2 on photosynthetic traits of native and invasive C3 and C4 grasses.BMC Ecol. 2016 May 31;16:28. doi: 10.1186/s12898-016-0082-z. BMC Ecol. 2016. PMID: 27246099 Free PMC article.
-
A comparison of stomatal conductance responses to blue and red light between C3 and C4 photosynthetic species in three phylogenetically-controlled experiments.Front Plant Sci. 2023 Sep 27;14:1253976. doi: 10.3389/fpls.2023.1253976. eCollection 2023. Front Plant Sci. 2023. PMID: 37828928 Free PMC article.
-
Evolution of an intermediate C4 photosynthesis in the non-foliar tissues of the Poaceae.Photosynth Res. 2022 Sep;153(3):125-134. doi: 10.1007/s11120-022-00926-7. Epub 2022 Jun 1. Photosynth Res. 2022. PMID: 35648247 Review.
-
Photorespiration connects C3 and C4 photosynthesis.J Exp Bot. 2016 May;67(10):2953-62. doi: 10.1093/jxb/erw056. Epub 2016 Feb 22. J Exp Bot. 2016. PMID: 26912798 Review.
Cited by
-
Estimating CO2 response in a mixed broadleaf forest using the dynamic assimilation technique.BMC Plant Biol. 2025 Jan 21;25(1):79. doi: 10.1186/s12870-024-05912-w. BMC Plant Biol. 2025. PMID: 39838287 Free PMC article.
-
Diurnal light fitness of the C3 and C4 species from the genus Atriplex under control and drought conditions.Photosynth Res. 2025 Jun 11;163(3):35. doi: 10.1007/s11120-025-01154-5. Photosynth Res. 2025. PMID: 40498222 Free PMC article.
-
Effects of plant nutrient acquisition strategies on biomass allocation patterns in wetlands along successional sequences in the semi-arid upper Yellow River basin.Front Plant Sci. 2024 Sep 2;15:1441567. doi: 10.3389/fpls.2024.1441567. eCollection 2024. Front Plant Sci. 2024. PMID: 39290726 Free PMC article.
References
-
- Arce Cubas L, Vath RL, Bernardo EL, Sales CRG, Burnett AC, Kromdijk J. Activation of CO2 assimilation during photosynthetic induction is slower in C4 than in C3 photosynthesis in three phylogenetically controlled experiments. Front Plant Sci. 2023:13:1091115. 10.3389/fpls.2022.1091115 - DOI - PMC - PubMed
-
- Bates D, Mächler M, Bolker B, Walker S. Fitting linear mixed-effects models using lme4. J Stat Softw. 2015:67(1):1–48. 10.18637/jss.v067.i01 - DOI
Publication types
MeSH terms
Substances
Grants and funding
LinkOut - more resources
Full Text Sources
Miscellaneous

