. 2023 Oct 1:269:114275.
doi: 10.1016/j.physbeh.2023.114275. Epub 2023 Jun 17.

Prior experience with flavored alcohol increases preference for flavored alcohol but flavor does not influence binge-like drinking behavior in mice

Affiliations

Prior experience with flavored alcohol increases preference for flavored alcohol but flavor does not influence binge-like drinking behavior in mice

Yueyi Chen et al. Physiol Behav. .

Abstract

Background: Binge drinking can lead to various negative consequences and in non-experimental settings, alcohol usually contains flavoring, which may promote increased binge drinking. Preclinical models of binge-like drinking have been well established, however, the influence of flavor on alcohol preference and binge-like drinking has not been fully explored.

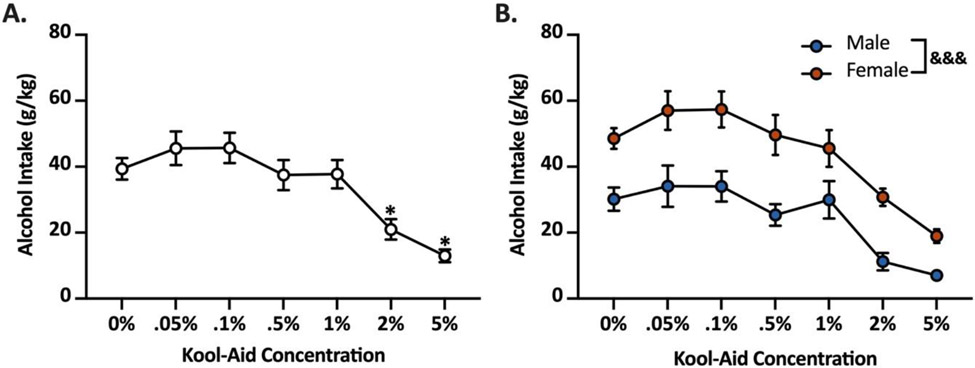
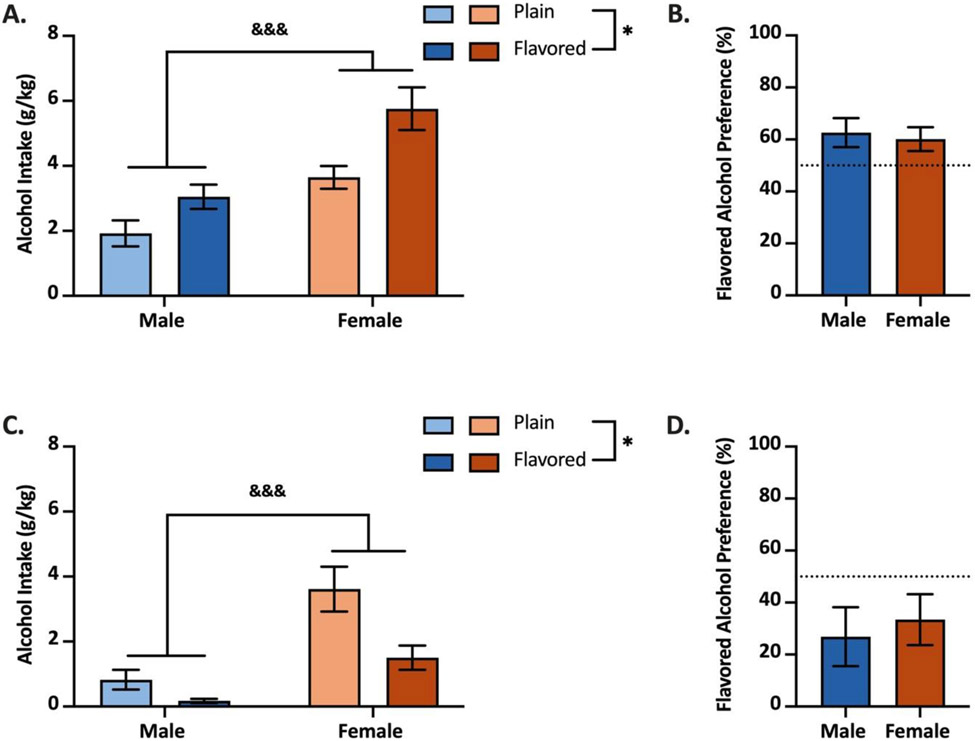
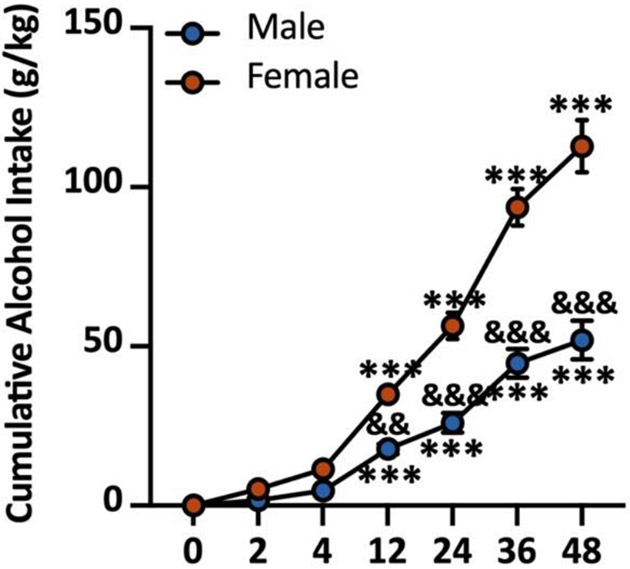
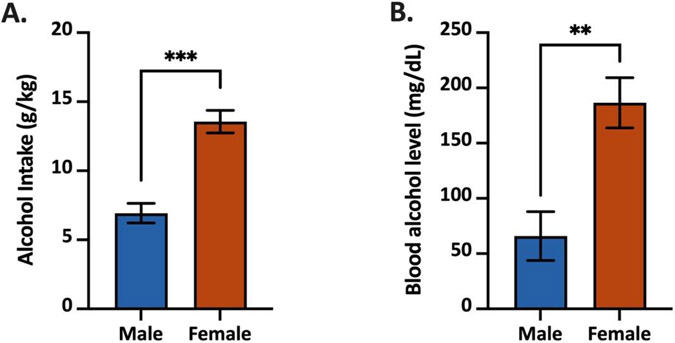
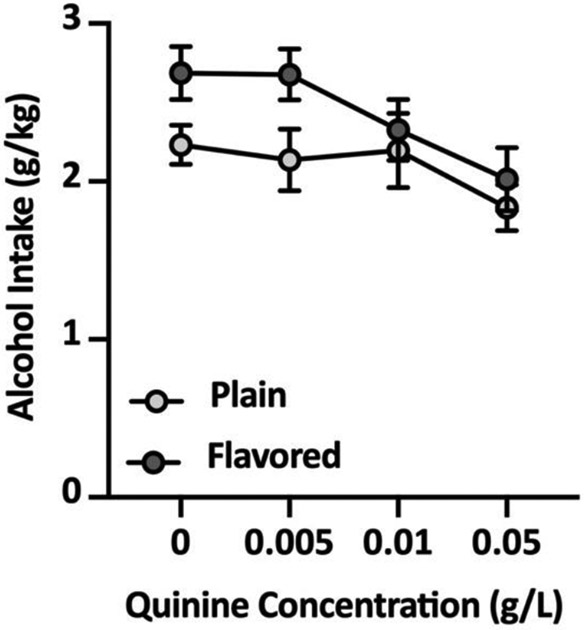
Methods: Male and female C57BL/6 J mice were tested via two-bottle choice with alcohol flavored with different concentrations of unsweetened Cherry flavor Kool-Aid and water. Next, mice were tested for preference for flavored alcohol over plain alcohol. Consumption of flavored alcohol versus water was examined over 48 h. Binge-like drinking with flavored alcohol was validated via drinking in the dark (DID). A separate cohort of mice underwent chronic DID for 6 weeks with either flavored or plain alcohol. After chronic DID, mice were then tested for preference for flavored versus plain alcohol and then alcohol consumption despite adverse effects was examined using the quinine adulteration test.

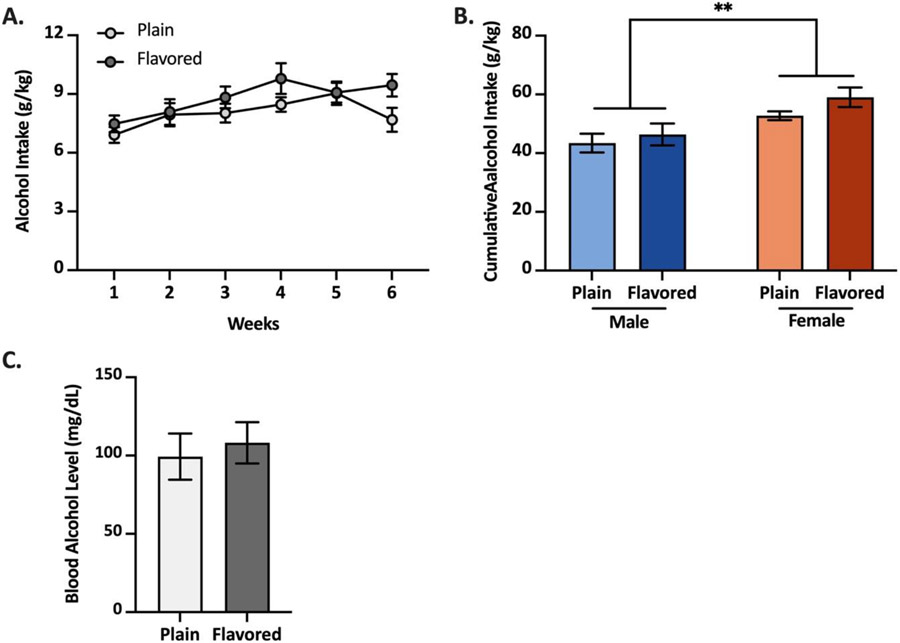
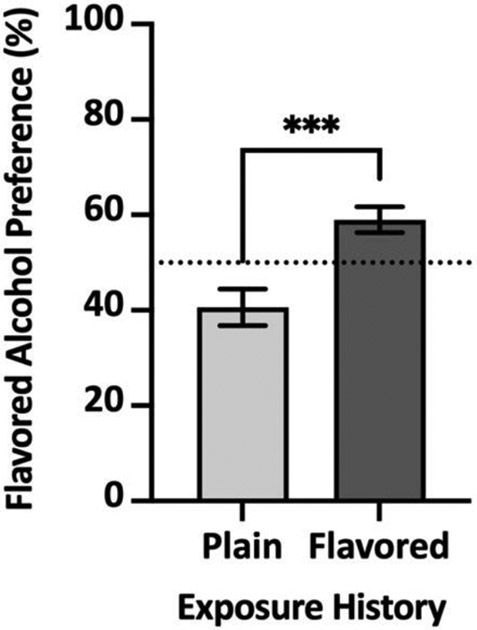
Results: The 0.1% Kool-Aid concentration was chosen to use for further testing based on intake. Mice preferred Kool-Aid flavored alcohol over plain alcohol after the concentration test, but mice with no prior exposure to plain or flavored alcohol preferred plain over flavored alcohol. Throughout all initial testing, female mice showed increased alcohol intake compared to male mice. Both male and female mice showed binge-like drinking of flavored alcohol, with females having higher intake and blood alcohol levels. Kool-Aid flavor did not increase alcohol intake during chronic binge-like drinking. Previous exposure to flavored alcohol during DID increased the preference for flavored alcohol over plain alcohol but did not influence alcohol consumption despite adverse effects.

Conclusion: The present study indicates that prior experience with flavored alcohol increases preference and intake, suggesting an effect of learned safety from neophobia. However, flavor does not impact binge-like alcohol consumption or alcohol drinking despite negative consequences. Additionally, the current study shows that female mice will consume more flavored alcohol than males, similar to findings from other alcohol studies.

Keywords: 2BC; DID; Ethanol; Learned safety; Neophobia.


Conflict of interest statement

Declaration of Competing Interest None.

Figures

Figure 1:
Figure 1:
Alcohol intake during two-bottle choice with alcohol flavored with varying Kool-Aid concentrations versus water. (A) Alcohol intake of varying concentrations of Kool-Aid added to alcohol (n = 16; 8 male, 8 female). Mice consumed significantly less alcohol compared to all other concentrations (0%, .05%, .1%, .5% and 1% Kool-Aid concentration) when it was flavored with 2% and 5% Kool-Aid. (B) Alcohol intake with various Kool-Aid concentrations added of male (blue; n = 8) and female (orange; n = 8) mice. Female mice consumed significantly more alcohol than male mice. Alcohol intake is calculated as a 2-day average and expressed in g/kg. *p < .05; comparison to 0%, .05%, .1%, .5% and 1% Kool-Aid concentrations. &&&p < .001; comparison between sexes.
Figure 2:
Figure 2:
Alcohol intake during 2BC of 0.1% Kool-Aid flavored alcohol versus plain alcohol. (A) Intake of plain alcohol (light blue and light orange) and Kool-Aid flavored alcohol (dark blue and dark orange) of male (blue; n = 8) and female (orange; n = 8) mice that had prior flavored alcohol experience during the concentration test. Mice with prior flavored alcohol experience consumed significantly more flavored alcohol than plain alcohol. Female mice had significantly higher total alcohol intake than male mice. (B) Both male (blue; n = 8) and female (orange; n = 8) mice with prior flavored alcohol experience had a greater than 50% preference for flavored alcohol. (C) Intake of plain alcohol (light blue and light orange) and Kool-Aid flavored alcohol (dark blue and dark orange) of male (blue; n = 6) and female (orange; n = 6) mice naive to alcohol. Alcohol naive mice consumed significantly more plain alcohol. Female mice showed greater alcohol intake than male mice. (D) Both male and female alcohol-naïve mice had a less than 50% preference for flavored alcohol. Alcohol intake is calculated as a 2-day average and expressed in g/kg. *p < .05; comparison between plain and flavored alcohol drinking. &&&p < .001; comparison between sexes.
Figure 3:
Figure 3:
Alcohol intake during two-bottle choice with flavored alcohol versus water over 48 hours. Intake of 0.1% Kool-Aid flavored alcohol in male (blue; n = 8) and female (orange; n = 8) mice during the 48-hr two-bottle choices test. Cumulative intake is presented at each time point. Mice increased flavored alcohol intake over 48 hours. Female mice drank significantly more flavored alcohol than males from 12- to 48- hours. Alcohol intake is expressed in g/kg. ***p < .001 compared to consumption at 2-hour; &&p < .01, &&&p < .001 between sexes.
Figure 4:
Figure 4:
Drinking in the Dark of 0.1% Kool-Aid flavored alcohol and associated blood alcohol levels. (A) Intake of 0.1% Kool-Aid flavored alcohol in male (blue; n = 8) and female (orange; n = 8) mice. Female mice drank significantly more flavored alcohol than male mice during the 4-hour DID session. (B) Blood alcohol levels (mg/dL) of male (blue; n = 8) and female (orange; n = 8) mice. Female mice had significantly higher blood alcohol levels than male mice after the 4-hour DID session. Alcohol intake is expressed in g/kg and blood alcohol levels in mg/dL. **p < .01. ***p < .001.
Figure 5:
Figure 5:
Six-week chronic DID with Kool-Aid flavored or plain alcohol and representative associated blood alcohol levels. (A) Alcohol intake of mice drinking plain alcohol (light gray; n = 16; 8 male, 8 female) and mice drinking flavored alcohol (dark gray; n = 16; 8 male, 8 female). (B) Cumulative alcohol intake over 6 weeks of DID in male (blue, n = 16; 8 plain [light], 8 flavored [dark]) and female (orange; n = 16; 8 plain [light], 8 flavored [dark]) mice. (C) Blood alcohol levels (mg/dL) of mice drinking plain alcohol (light gray; n = 16; 8 male, 8 female) and mice drinking flavored alcohol (dark gray; n = 16; 8 male, 8 female). Flavored alcohol did not lead to greater alcohol intake over 6-week chronic binge-like drinking or influence blood alcohol levels. Female mice drank more alcohol than male mice. Alcohol intake is expressed in g/kg and blood alcohol levels in mg/dL. ** p < .01. *** p < .001.
Figure 6:
Figure 6:
Alcohol preference of flavored alcohol compared to plain alcohol based on exposure history to either flavored or plain alcohol over 6 weeks of DID. Flavored alcohol preference of mice with a history of plain alcohol over 6 weeks of DID (light gray; n = 16; 8 male, 8 female) and mice with a history of flavored alcohol drinking over 6 weeks of DID(dark gray; n = 16; 8 male, 8 female). Mice with an exposure history of Kool-Aid flavored alcohol showed a significantly higher preference for flavored alcohol over plain alcohol than mice with a history of drinking plain alcohol. Preference was calculated as the intake of flavored alcohol divided by the total intake of flavored alcohol and plain alcohol. Prior alcohol exposure is labeled on the x-axis. *** p < .001.
Figure 7:
Figure 7:
Quinine adulteration of alcohol. Alcohol intake of mice that drank plain alcohol (light gray; n = 16; 8 male; 8 female) and mice that drank flavored alcohol (dark gray; n = 16; 8 male; 8 female) with increasing concentrations of quinine added.

Similar articles

References

    1. Algallal H, Allain F, Ndiaye NA, & Samaha AN (2020). Sex differences in cocaine self-administration behaviour under long access versus intermittent access conditions. Addict Biol, 25(5), e12809. 10.1111/adb.12809 - DOI - PubMed
    1. Austen JM, Strickland JA, & Sanderson DJ (2016). Memory-dependent effects on palatability in mice. Physiol Behav, 167, 92–99. 10.1016/j.physbeh.2016.09.001 - DOI - PMC - PubMed
    1. Bachmanov AA, Kiefer SW, Molina JC, Tordoff MG, Duffy VB, Bartoshuk LM, & Mennella JA (2003). Chemosensory factors influencing alcohol perception, preferences, and consumption. Alcohol Clin Exp Res, 27(2), 220–231. 10.1097/01.ALC.0000051021.99641.19 - DOI - PMC - PubMed
    1. Barak S, Ahmadiantehrani S, Kharazia V, & Ron D (2011). Positive autoregulation of GDNF levels in the ventral tegmental area mediates long-lasting inhibition of excessive alcohol consumption. Transl Psychiatry, 1(12), e60-. 10.1038/tp.2011.57 - DOI - PMC - PubMed
    1. Barnett SA (1958). Experiments on neophobia in wild and laboratory rats. Br J Psychol, 49(3), 195–201. 10.1111/j.2044-8295.1958.tb00657.x - DOI - PubMed

Publication types

LinkOut - more resources