. 2023 Aug 14;46(8):zsad122.
doi: 10.1093/sleep/zsad122.

How does obstructive sleep apnea alter cerebral hemodynamics?

Affiliations

How does obstructive sleep apnea alter cerebral hemodynamics?

Clara Gregori-Pla et al. Sleep. .

Abstract

Study objectives: We aimed to characterize the cerebral hemodynamic response to obstructive sleep apnea/hypopnea events, and evaluate their association to polysomnographic parameters. The characterization of the cerebral hemodynamics in obstructive sleep apnea (OSA) may add complementary information to further the understanding of the severity of the syndrome beyond the conventional polysomnography.

Methods: Severe OSA patients were studied during night sleep while monitored by polysomnography. Transcranial, bed-side diffuse correlation spectroscopy (DCS) and frequency-domain near-infrared diffuse correlation spectroscopy (NIRS-DOS) were used to follow microvascular cerebral hemodynamics in the frontal lobes of the cerebral cortex. Changes in cerebral blood flow (CBF), total hemoglobin concentration (THC), and cerebral blood oxygen saturation (StO2) were analyzed.

Results: We considered 3283 obstructive apnea/hypopnea events from sixteen OSA patients (Age (median, interquartile range) 57 (52-64.5); females 25%; AHI (apnea-hypopnea index) 84.4 (76.1-93.7)). A biphasic response (maximum/minimum followed by a minimum/maximum) was observed for each cerebral hemodynamic variable (CBF, THC, StO2), heart rate and peripheral arterial oxygen saturation (SpO2). Changes of the StO2 followed the dynamics of the SpO2, and were out of phase from the THC and CBF. Longer events were associated with larger CBF changes, faster responses and slower recoveries. Moreover, the extrema of the response to obstructive hypopneas were lower compared to apneas (p < .001).

Conclusions: Obstructive apneas/hypopneas cause profound, periodic changes in cerebral hemodynamics, including periods of hyper- and hypo-perfusion and intermittent cerebral hypoxia. The duration of the events is a strong determinant of the cerebral hemodynamic response, which is more pronounced in apnea than hypopnea events.

Keywords: cerebral hemodynamics; diffuse correlation spectroscopy; near-infrared spectroscopy; obstructive sleep apnea; sleep disorder.


Figures

Graphical Abstract
Graphical Abstract
Figure 1.
Figure 1.
The optical probes for each technique and the polysomnographic sensors that are placed on the subject’s head. DCS, diffuse correlation spectroscopy; EEG, electroencephalography; CPAP, continuous positive airway pressure; NIRS-DOS, near-infrared diffuse optical spectroscopy; ECG, electrocardiography.
Figure 2.
Figure 2.
Visualization of the parametrization of the relative cerebral blood flow response to a single event. The first light gray region indicates the sleep event and the second, the possible following event. The dark gray region indicates the time window used to find the first extremum. The first and the second extrema and the parameters at recovery are labeled.
Figure 3.
Figure 3.
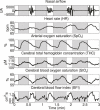
Nasal airflow, heart rate, arterial oxygen saturation, total hemoglobin concentration, cerebral blood oxygen saturation and blood flow index dynamics for three minutes of night sleep for one representative obstructive sleep apnea subject. See the text for details. The gray regions between two vertical lines indicate obstructive apneic events.
Figure 4.
Figure 4.
(Top row) The dynamics of systemic variables, i.e. heart rate (ΔrHR) and peripheral arterial oxygen saturation (ΔSpO2) and (Bottom row) those of the cerebral microvasculature, i.e. relative cerebral blood flow (ΔrCBF), total hemoglobin concentration (ΔTHC) and blood oxygen saturation (ΔStO2) are shown for both obstructive apnea and hypopnea events. The data is averaged over all patients and the shaded area shows the variability due to bootstrapping. The first and the second extrema and the recovery points are further labeled. For clarity, the results for ΔStO2 and ΔTHC are multiplied by ten (x10). (*) indicates statistically significant association (<0.001) of the extrema between apneic and hypopneic events.

Similar articles

Cited by

References

    1. Benjafield A, Ayas N, Eastwood P, et al. . Estimation of the global prevalence and burden of obstructive sleep apnoea: a literature-based analysis. Lancet Respir Med. 2019;7:S2213–2600 - PMC - PubMed
    1. Dempsey JA, Veasey SC, Morgan BJ, O’Donnell CP.. Pathophysiology of sleep apnea. Physiol Rev. 2010;90:47–112. doi:10.1152/physrev.00043.2008. - DOI - PMC - PubMed
    1. Javaheri S, Barbe F, Campos-Rodriguez F, et al. . Sleep Apnea:Types, Mechanisms, and clinical cardiovascular consequences. J Am Coll Cardiol. 2017;69(7):841–858. - PMC - PubMed
    1. Prabhakar NR, Peng YJ, Nanduri J.. Hypoxia-inducible factors and obstructive sleep apnea. J Clin Invest. 2020;130(10):5042–5051. doi:10.1172/JCI137560. - DOI - PMC - PubMed
    1. Shieu MM, Dunietz GL, Paulson HL, Chervin RD, Braley TJ.. The association between obstructive sleep apnea risk and cognitive disorders: a population-based study. J Clin Sleep Med. 2022. ;18(4):11771185. - PMC - PubMed

Publication types