. 2023 Oct 5;52(5):1545-1556.
doi: 10.1093/ije/dyad082.

Exploring regression dilution bias using repeat measurements of 2858 variables in ≤49 000 UK Biobank participants

Affiliations

Exploring regression dilution bias using repeat measurements of 2858 variables in ≤49 000 UK Biobank participants

Charlotte E Rutter et al. Int J Epidemiol. .

Abstract

Background: Measurement error in exposures and confounders can bias exposure-outcome associations but is rarely considered. We aimed to assess random measurement error of all continuous variables in UK Biobank and explore approaches to mitigate its impact on exposure-outcome associations.

Methods: Random measurement error was assessed using intraclass correlation coefficients (ICCs) for all continuous variables with repeat measures. Regression calibration was used to correct for random error in exposures and confounders, using the associations of red blood cell distribution width (RDW), C-reactive protein (CRP) and 25-hydroxyvitamin D [25(OH)D] with mortality as illustrative examples.

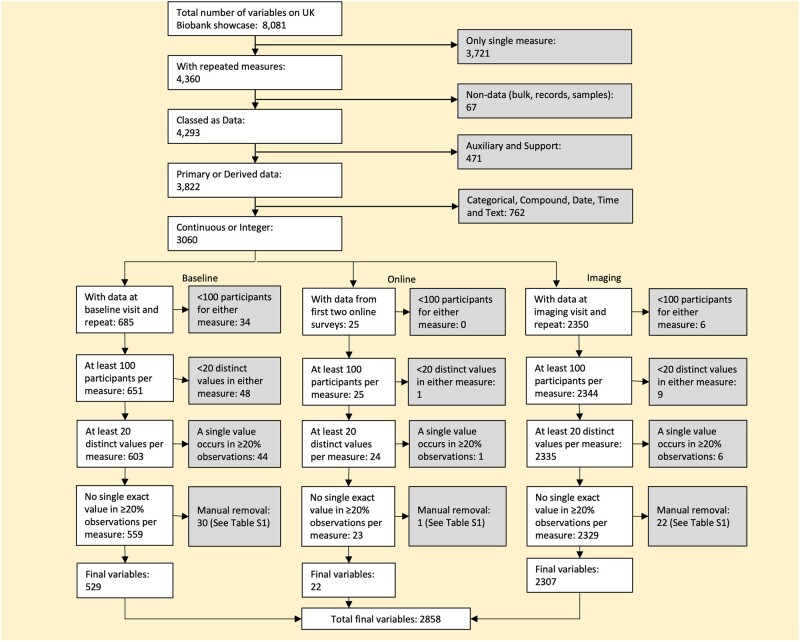
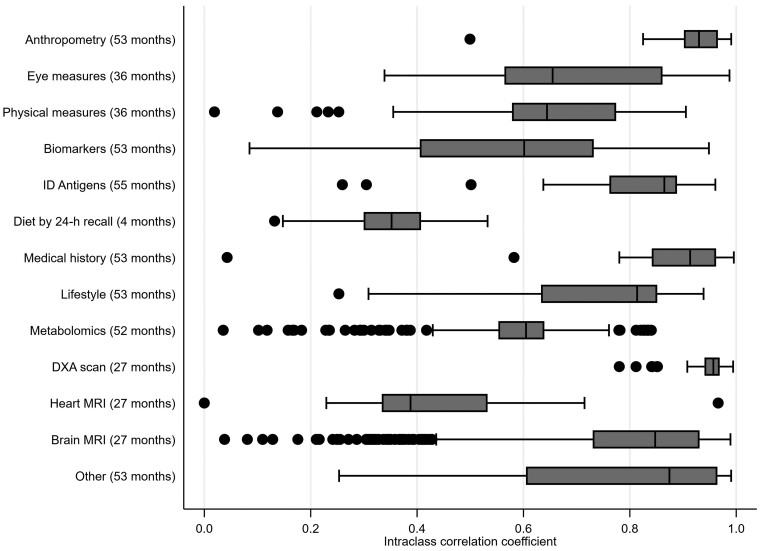
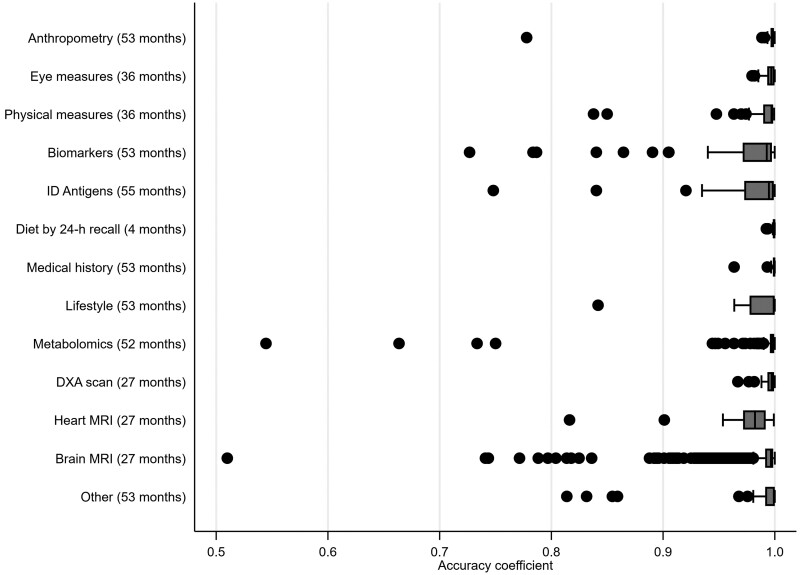
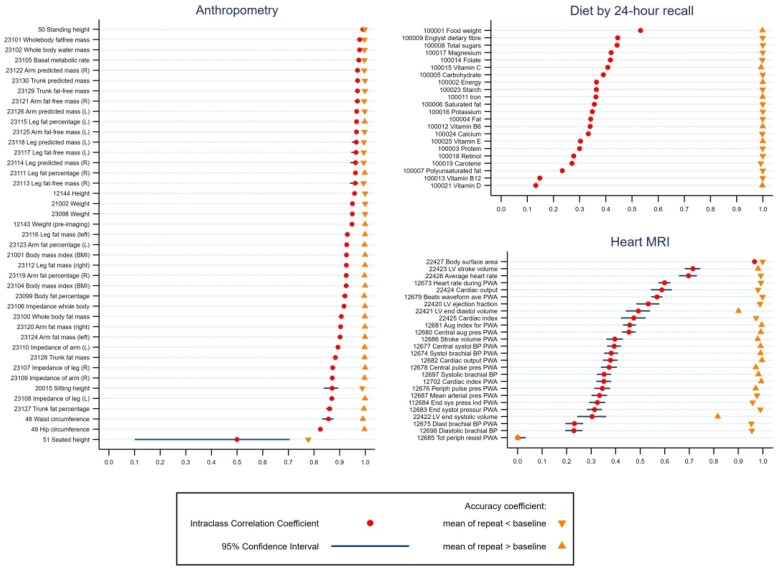
Results: The 2858 continuous variables with repeat measures varied in sample size from 109 to 49 121. They fell into three groups: (i) baseline visit [529 variables; median (interquartile range) ICC = 0.64 (0.57, 0.83)]; (ii) online diet by 24-h recall [22 variables; 0.35 (0.30, 0.40)] and (iii) imaging measures [2307 variables; 0.85 (0.73, 0.94)]. Highest ICCs were for anthropometric and medical history measures, and lowest for dietary and heart magnetic resonance imaging.The ICCs (95% confidence interval) for RDW, CRP and 25(OH)D were 0.52 (0.51, 0.53), 0.29 (0.27, 0.30) and 0.55 (0.54, 0.56), respectively. Higher RDW and levels of CRP were associated with higher risk of all-cause mortality, and higher concentration of 25(OH)D with lower risk. After correction for random measurement error in the main exposure, the associations all strengthened. Confounder correction did not influence estimates.

Conclusions: Random measurement error varies widely and is often non-negligible. For UK Biobank we provide relevant statistics and adaptable code to help other researchers explore and correct for this.

Keywords: Regression dilution bias; UK Biobank; attenuation by errors; concordance; random measurement error; random variability.


Conflict of interest statement

None declared.

Figures

Figure 1
Figure 1
Data flow chart
Figure 2
Figure 2
Box and whisker plot of intraclass correlation coefficients measuring overall agreement between repeated measurements by variable category. The months in brackets after each category name are the median time between the first and second measures. For each category the vertical line inside the horizontal box reflects the median intraclass correlation coefficient for that category; the box denotes the interquartile range (IQR); the vertical lines at the end of the protruding horizontal lines from each box reflect the adjacent values (values within 1.5 times the IQR) and the dots denote separate points more extreme than the adjacent values. ID, infectious disease; DXA, dual-energy X-ray absorptiometry; MRI, magnetic resonance imaging
Figure 3
Figure 3
Box and whisker plot of accuracy coefficients measuring systematic difference between repeated measurements by variable category. The months in brackets after each category name are the median time between the first and second measures. For each category the vertical line inside the horizontal box reflects the median accuracy coefficient for that category; the box denotes the interquartile range (IQR); the vertical lines at the end of the protruding horizontal lines from each box reflect the adjacent values (values within 1.5 times the IQR) and the dots denote separate points more extreme than the adjacent values. ID, infectious disease; DXA, dual-energy X-ray absorptiometry; MRI, magnetic resonance imaging
Figure 4
Figure 4
Intraclass correlation and accuracy coefficients for variables in anthropometry, diet by 24-h recall and heart magnetic resonance imaging. Results are the intraclass and accuracy coefficients with 95% CI for each variable in the three categories. Where the coefficients are very precisely estimated the 95% CIs are not clearly visible. Coefficient values and their 95% CIs for all 2858 variables (i.e. those in this figure and all of those in other categories not shown in this figure) are provided in Supplementary Tables S4–S6 (available as Supplementary data at IJE online). There are multiple variables for height and weight: 50 Standing height—measured as part of the baseline assessment; 12 144 Height—measured in the subgroup of participants attending the detailed imaging assessments as it is required to calibrate the DXA scans; 21 001 Weight—a derived variable amalgamating multiple methods of measurement at the assessment centre visit; 23 098 Weight—taken during impedance measurement; 12 143 Weight (pre-imaging)—measured in the subgroup of participants attending the detailed imaging assessments as it is required to calibrate the DXA scans. DXA, dual-energy X-ray absorptiometry

References

    1. Brakenhoff TB, van Smeden M, Visseren FLJ, Groenwold RHH.. Random measurement error: why worry? An example of cardiovascular risk factors. PLoS One 2018;13:e0192298. - PMC - PubMed
    1. Hutcheon JA, Chiolero A, Hanley JA.. Random measurement error and regression dilution bias. BMJ 2010;340:c2289. - PubMed
    1. Smith GD, Phillips AN.. Inflation in epidemiology: ‘the proof and measurement of association between two things’ revisited. BMJ 1996;312:1659–61. - PMC - PubMed
    1. MacMahon S, Peto R, Cutler J. et al. Blood pressure, stroke, and coronary heart disease. Part 1: Prolonged differences in blood pressure: prospective observational studies corrected for the regression dilution bias. Lancet 1990;335:765–74. - PubMed
    1. Fraser A, Macdonald-Wallis C, Tilling K. et al. Cohort Profile: The Avon Longitudinal Study of Parents and Children: ALSPAC mothers cohort. Int J Epidemiol 2013;42:97–110. - PMC - PubMed

Publication types