. 2023 Jun 19;14(1):3618.
doi: 10.1038/s41467-023-39332-5.

ATR kinase supports normal proliferation in the early S phase by preventing replication resource exhaustion

Affiliations

ATR kinase supports normal proliferation in the early S phase by preventing replication resource exhaustion

Demis Menolfi et al. Nat Commun. .

Abstract

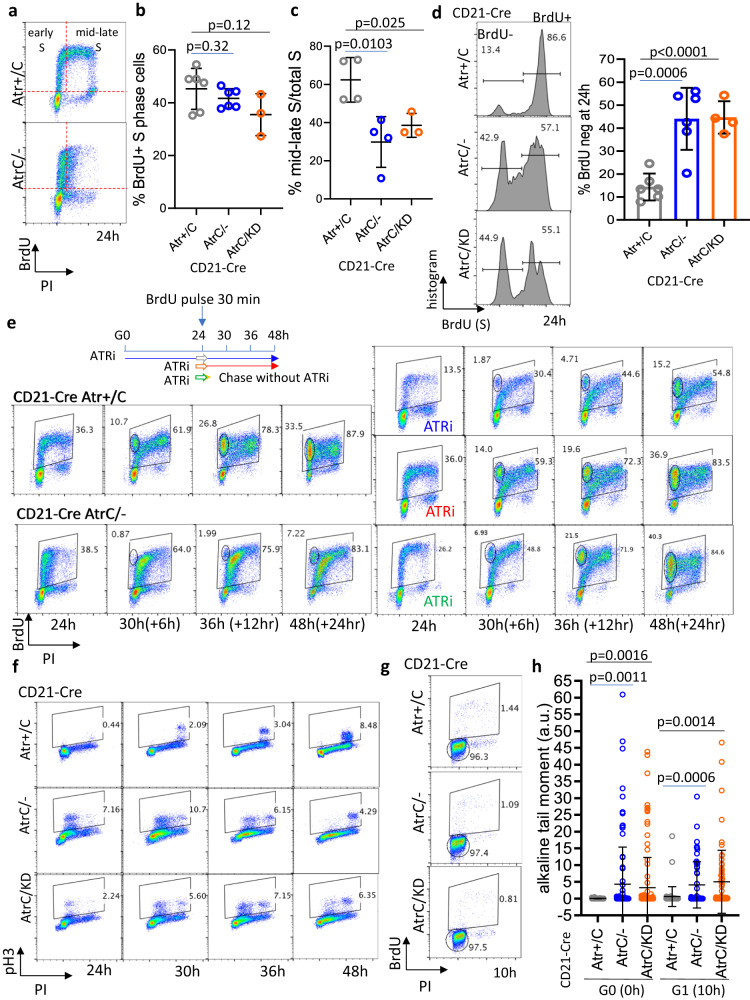
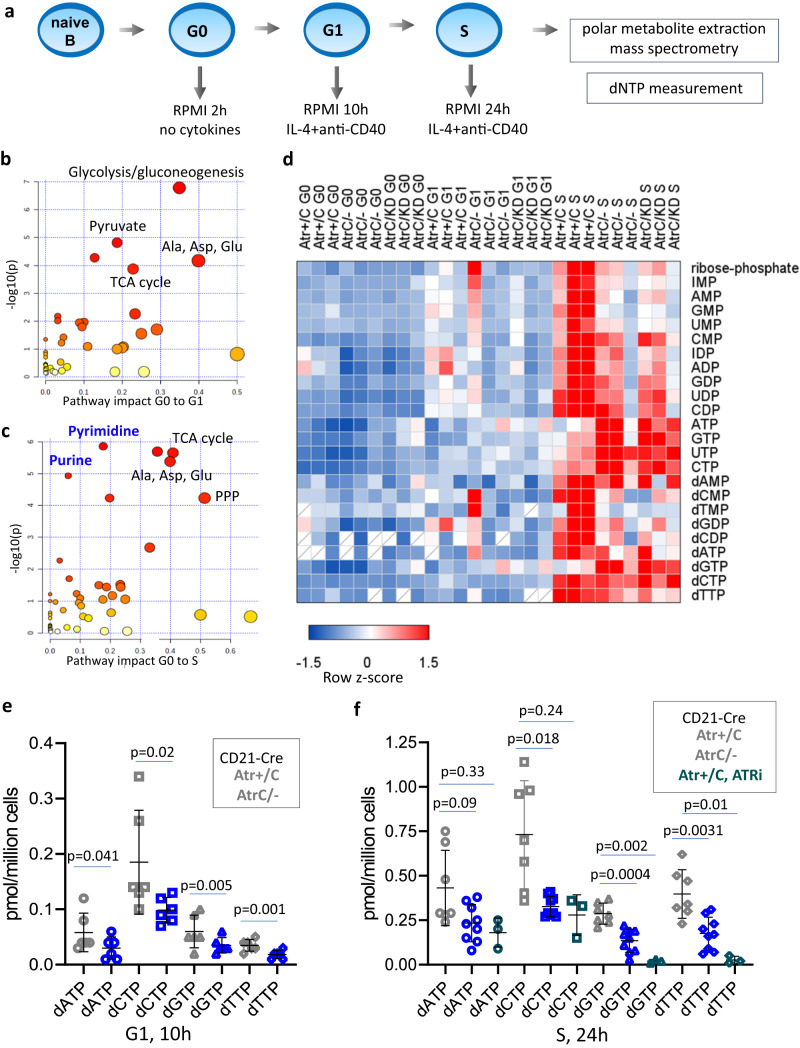
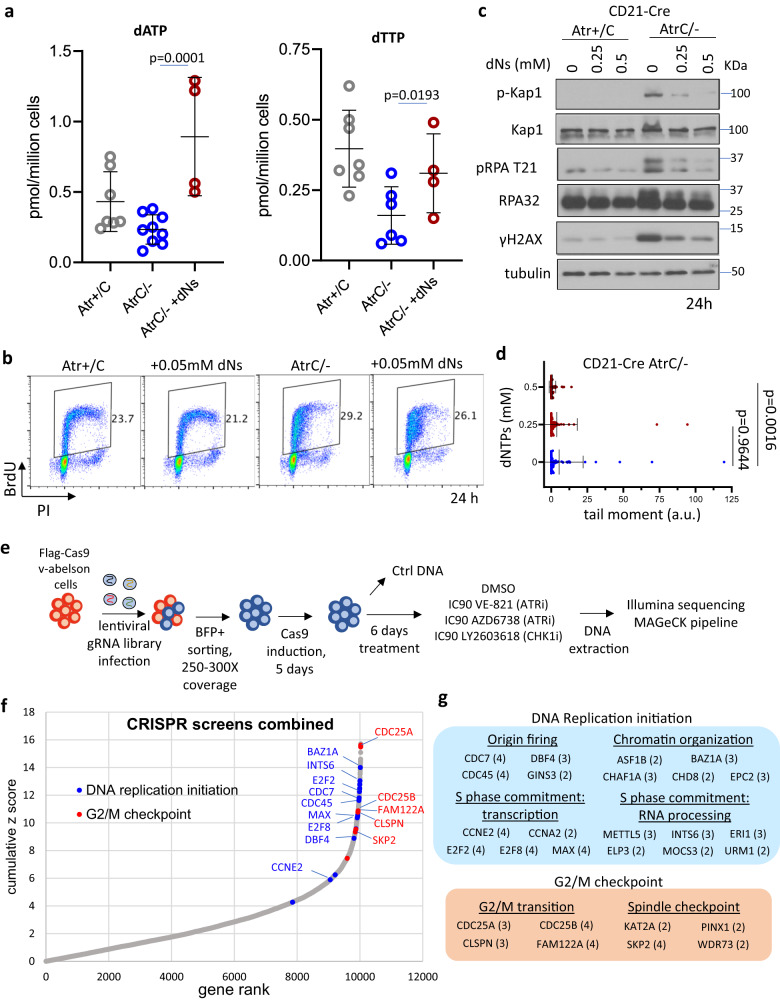
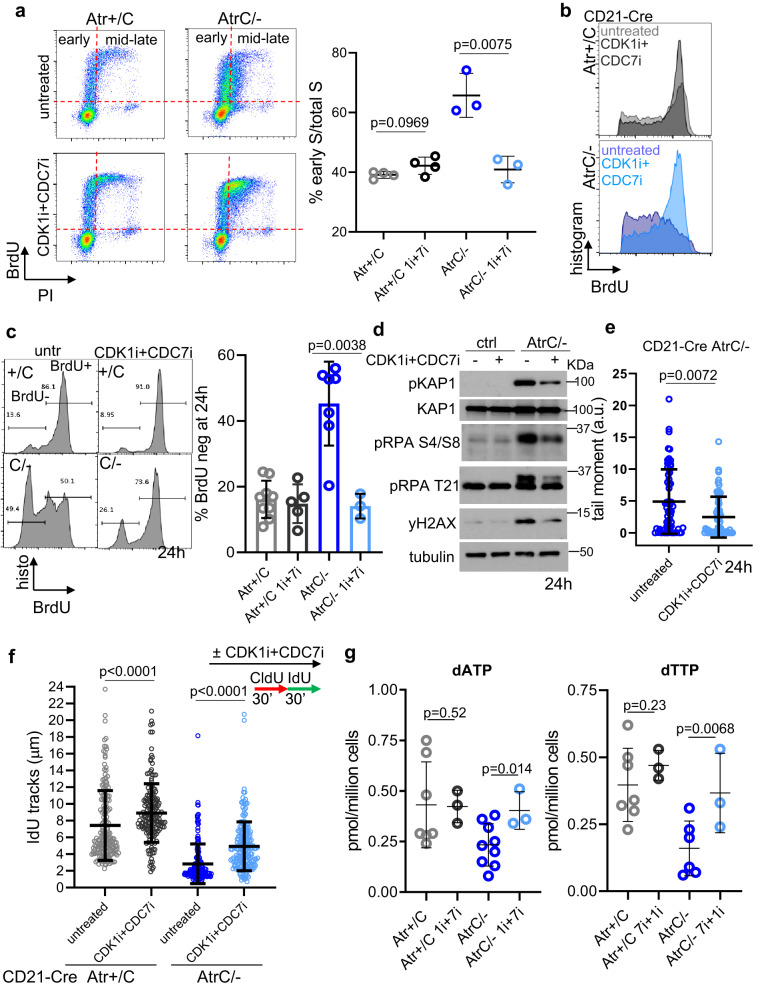
The ATR kinase, which coordinates cellular responses to DNA replication stress, is also essential for the proliferation of normal unstressed cells. Although its role in the replication stress response is well defined, the mechanisms by which ATR supports normal cell proliferation remain elusive. Here, we show that ATR is dispensable for the viability of G0-arrested naïve B cells. However, upon cytokine-induced proliferation, Atr-deficient B cells initiate DNA replication efficiently, but by mid-S phase they display dNTP depletion, fork stalling, and replication failure. Nonetheless, productive DNA replication and dNTP levels can be restored in Atr-deficient cells by suppressing origin firing, such as partial inhibition of CDC7 and CDK1 kinase activities. Together, these findings indicate that ATR supports the proliferation of normal unstressed cells by tempering the pace of origin firing during the early S phase to avoid exhaustion of dNTPs and importantly also other replication factors.


Conflict of interest statement

The authors declare no competing interests.

Figures

Fig. 1
Fig. 1. ATR is essential for early B cell development and dispensable in naïve B cells.
a Bone marrow and spleens from Mb1+/Cre Atr+/C, AtrC/- and AtrC/KD and CD21-Cre+ Atr+/C, AtrC/- and AtrC/KD mice were harvested, and cells stained with the antibodies indicated. Pro-B, immature, recirculating, and naïve B cells were gated in the bone marrow, as shown in the examples. b Quantification of B cell percentage in bone marrow from three, four or five biologically independent mice for both the Mb1+/Cre and CD21-Cre+ alleles. Data are presented as mean values ±SEM. Two-tailed t test was used. c Quantification of absolute B cell number from one femur from three biologically independent CD21-Cre+ Atr proficient or deficient mice. Mean and standard errors were plotted. d CD21-Cre+ Atr+/C, AtrC/-, and AtrC/KD B cells were purified from the mice spleens and cultured with IL-4 and anti-CD40 for CSR. Activated B cells were stained on Day 3 for IgG1 and B220 markers. Flow cytometry profiles are shown as examples. Cells were stained with Cell Trace Violet (CTV) at the beginning of the CSR experiment and analyzed for proliferation on Day 5 post-stimulation. Quantification divides CTV-stained cells into three populations, from right to left: 0–1, 2–4, and ≥5 generations. e Quantification of CSR experiments from ten CD21-Cre+ Atr+/C, eight CD21-Cre+ AtrC/- and ten CD21-Cre+ AtrC/KD biologically independent mice. Data are presented as mean values ±SD. f Flow cytometry analyses of spleen germinal center B cells (CD95+ and GL7+) in naïve and immunized (with sheep red blood cells twice) CD21-Cre+ Atr+/C and AtrC/- mice. Representative immunohistochemistry staining for Bcl6, a germinal center marker, are included on the right. g Quantification of splenic germinal center B cell number after two immunizations from four biologically independent CD21-Cre+ Atr+/C or CD21-Cre+ AtrC/- mice. Mean and standard errors were plotted. Statistical analyses in b, c, e, and g were done using unpaired two-tailed Student’s t test. Source data are provided as a Source Data file.
Fig. 2
Fig. 2. ATR kinase activity is essential for productive DNA replication.
a Flow cytometry profiles of CD21-Cre+ Atr+/C, AtrC/-, and AtrC/KD B cells pulse-labeled with BrdU for 30 min at 48 h post-stimulation. Representative dot plots are shown. Histogram plots of S-phase cells are shown with the separation in BrdU-negative (BrdU−) and BrdU-positive (Brdu+) cells. Quantification of the percentage of BrdU negative cells from four independent experiments is reported, together with the two-tailed t-test statistical analysis. Data are presented as mean values ±SEM. b CD21-Cre+ Atr+/C, AtrC/-, and AtrC/KD B cells were labeled with CldU for 30 min and with IdU for an additional 30 min on day 2 of CSR, and DNA fibers were spread and stained. The length of IdU fibers was measured using Image J and plotted as shown. Two-sided Mann-Whitney test was used. Data are presented as mean values ±SD. c CD21-Cre+ Atr+/C, AtrC/-, and AtrC/KD B cells at 48 h post-stimulation were stained for γH2AX and PI and analyzed by flow cytometry. Quantification of three independent experiments of γH2AX/PI staining is shown for CD21-Cre+ Atr+/C and AtrC/- B cells, with two-tailed t-test analysis indicated. Data are presented as mean values ±SEM. d Alkaline comet assay was performed in CD21-Cre+ Atr+/C AtrC/- and AtrC/KD B cells at 48 h post-stimulation. One representative of two independent experiments is shown. The tail moment (arbitrary units, a.u.) of single cells is reported with two-taled t-test analysis indicated. Data are presented as mean values ±SD. e CD21-Cre+ Atr+/C, AtrC/-, and AtrC/KD B cells were lysed on day 2 of CSR, and the indicated proteins were analyzed by western blot. f 48 h stimulated WT B cells were left untreated, treated with 5 µM ATRi (VE-821) from the time of B cells activation or with 10 µM ATRi (VE-821) for 2 h right before BrdU labeling (30 min) and collection (immediately after labeling). Source data are provided as a Source Data file.
Fig. 3
Fig. 3. ATR is required at G1-S transition to support productive replication.
a CD21-Cre+ Atr+/C and AtrC/- B cells were pulse-labeled with BrdU for 30 min at 24 h post-stimulation. Representative flow cytometry profiles are shown. b) Quantification of the percentage of BrdU+ S phase cells collected from six CD21-Cre+ Atr+/C, six CD21-Cre+ AtrC/- and three CD21-Cre+ AtrC/KD biologically independent mice. Data are presented as mean values ±SD. Two-tailed t-test. c Quantification of the percentage of BrdU+ mid-late S phase cells relative to total S phase cells from cell cycle experiments in B cells collected from six CD21-Cre+ Atr+/C mice, six CD21-Cre+ AtrC/-, and three CD21-Cre+ AtrC/KD biologically independent mice. Data are presented as mean values ±SD. Two-tailed t-test. d Six CD21-Cre+ Atr+/C, six AtrC/-, and four AtrC/KD biologically independent B cell samples, treated as in a, were analyzed at 24 h post-stimulation for the percentage of BrdU negative and positive S phase cells. Data are presented as mean values ±SEM. Two-tailed t-test. e Schematic representation of the BrdU pulse-chase experiments. Cells were pulse labled with BrdU for 30 min at 24 h after stimulation and chased for another 24 h. CD21-Cre+ Atr+/C cells were treated with 5 µM ATRi at time 0 (blue, pluse labeled with BrdU after exposure to ATRi for 24 h and chased for another 24 h with ATRi), at 24 h post-stimulation (red) until collection (with ATRi for 30 min, then chased with ATRi during 24–48 h) or for an hour (green) (ATRi for 30 min and then chased without ATRi during the 24–48 h). Flow cytometry profiles are shown with quantification in Supplementary Fig. 3d. f Cells were collected at 24, 30, 36, and 48 h post-stimulation and analyzed for Histone H3 S10 and PI. g Cells pulse-labeled with BrdU for 30 min at 10 h post-stimulation. G1 and S gates are shown. h Cells were collected for alkaline comet assay at 0 h or at 10 h post-stimulation. One representative of two independent experiments is shown. The alkaline tail moment is reported in arbitrary units (a.u.). Data are presented as mean values ±SD and statistical analysis used the two-tailed Mann–Whitney test. Source data are provided as a Source Data file.
Fig. 4
Fig. 4. ATR kinase does not affect the S phase transcriptional program.
a RNA-seq analyses from three independent culture splenic B cells from CD21-Cre+ Atr+/C and AtrC/- mice at G0 (t = 0 h), G1 (t = 10 h), and S (t = 24 h) after IL-4 and anti-CD40 stimulations. The RNA-seq data were processed with DeSeq2 package, which uses a Wald test: the shrunken estimate of LFC is divided by its standard error, resulting in a z-statistic, which is compared to a standard normal distribution. Gene ontology (GO) analysis was performed on genes that are significantly upregulated from the G1 to S phase with a fold increase (FC) of at least 1.5 (log2 > 0.585) and an adjust p value < 0.01. Two tailed test was used. b A heatmap of the row z-scores of transcripts per million (TPM) of DNA replication genes in the transition from G0 to S phase is shown. Source data are provided as a Source Data file.
Fig. 5
Fig. 5. Metabolome profiling and direct dNTP measurement reveal selective nucleoside and deoxyribonucleotide defects in Atr-deficient B cells.
a Schematic representation of the time points collected (2 h, 10 h, and 24 h) for the metabolome and dNTP analyses. b, c Pathway impact analysis performed using a hypergeometric test on ctrl CD21-Cre+ Atr+/C B cells comparing the transition from G0 to G1 (b) and from G0 to S phase (c). d Heatmap of the row z-scores of integrated peak area values of several metabolites of the purine and pyrimidine pathways for CD21-Cre+ Atr+/C, AtrC/-, and AtrC/KD in G0, G1, and S phases. e dNTP (dATP, dCTP, dGTP, and dTTP) amounts were quantified in pmol/million cells from six independent CD21-Cre+ Atr+/C or AtrC/- B cells collected at 10 h post-activation. Statistical analysis was performed using a two-tailed t-test. f Analysis as in e, but cells were collected at 24 h post-activation from seven or nine independent samples. Three independent ATRi-treated CD21-Cre+ Atr+/C B cell cultures were added to the analysis. ATRi was added at 10 h post-stimulation and kept in culture until 24 h. Statistical analysis was performed using a two-tailed t-test. Source data are provided as a Source Data file.
Fig. 6
Fig. 6. Effects of deoxyribonucleoside supplementation and CRISPR-Cas9 screen in v-abl virus-transformed B cells.
a dNTP analysis was performed in CD21-Cre+ Atr+/C and AtrC/- B cells collected at 24 h post-stimulation (same data as in Fig. 5f) and in CD21-Cre+ AtrC/- B cells supplemented with 2.5 mM of deoxyribonucleosides for 14 h (added at 10 h). Quantifications of dATP and dTTP are reported. Statistical analysis used two-tailed t-test. b CD21-Cre+ Atr+/C and AtrC/- B cells were treated at 10 h post-stimulation with 0.05 mM of deoxyribonucleosides. Samples were pulse-labeled with BrdU for 30 min at 24 h. c CD21-Cre+ Atr+/C and AtrC/- B cells were cultured with 0 mM, 0.25 mM, or 0.5 mM of deoxyribonucleosides supplemented at 10 h post-stimulation. Cells were collected at 24 h, and western blots were performed for the proteins indicated. d Alkaline comet assay was performed at 24 h post-stimulation in CD21-Cre+ AtrC/- cells untreated or treated with 0.25 mM or 0.5 mM of deoxyribonucleosides. One representative of two independent experiments is shown. Data are presented as mean values ±SD. Statistical analysis done with the two-tailed Mann–Whitney test. e Flag-Cas9 v-abl B cells were infected with a BFP-expressing lentiviral gRNA library. BFP+ cells were sorted and Cas9 induced with doxycycline for 5 days. Cells were treated with the indicated inhibitors for 6 days, after which DNA was collected for sequencing. Details are described in the methods. f The cumulative Z score was calculated from the four screens combined, and genes were ranked accordingly. Some of the DNA replication initiation and G2/M checkpoint genes with an FDR < 0.2 in at least two of the four screens have been highlighted in the gene rank plot. The CRISPR data were analzyed via the MAGeCK package and the FDR and Z score are direct output from the MAGeCK pipeline. g The DNA replication initiation and G2/M checkpoint genes with an FDR < 0.2 in at least two of the four screens are grouped. Genes have been divided into subcategories based on biological processes. The numbers in brackets represent the number of screens in which each gene has been significantly picked.Source data are provided as a Source Data file.
Fig. 7
Fig. 7. CDC7 and CDK1 concomitant inhibition rescues the productive DNA synthesis and nucleotide supply in Atr-deficient B cells.
a CD21-Cre+ Atr+/C and AtrC/- cells untreated or treated at 10 h post-stimulation with 2.5 µM of CDC7i (XL413) and 2.5 µM of CDK1i (Ro-3306) were pulse-labeled with BrdU for 30 min and collected at 24 h. Representative flow cytometry dot plots are reported. Grid indicates early vs. mid-late S phase cells. Quantification of early S phase and mid+late S phase cells from three or four biologically independent experiments. Data are presented as mean values ±SD. Statistical analysis used two-tailed t-test. b Overlay of cell cycle histograms of BrdU-positive cells with or without CDC7i + CDK1i for CD21-Cre+ Atr+/C and AtrC/- cells. c The percentages of BrdU negative and positive S phase cells at 24 h from several independent experiments of CD21-Cre+ Atr+/C and AtrC/- cells untreated or treated with both CDC7i and CDK1i for 14 h. d Indicated cells were left untreated or treated with both CDC7i and CDK1i and proteins collected at 24 h. e Alkaline comet assay was performed in cells untreated or treated with both CDC7i and CDK1i for 14 h, and the tail moment of single cells is shown in arbitrary units. One representative of two independent experiments is shown. Data are presented as mean values ±SD. Two-tailed Mann-Whitney test was used. f CD21-Cre+ Atr+/C and AtrC/- cells were left untreated or treated with both CDC7i and CDK1i for 14 h. In all conditions, cells were pulse-labeled at 24 h with CldU for 30 min and then with IdU for additional 30 min. The length of IdU fibers was plotted, one representative of two independent experiments is shown, data are presented as mean values ±SD and the two-tailed Mann–Whitney test was used. g CD21-Cre+ Atr+/C and AtrC/- cells were left untreated or treated with both CDC7i and CDK1i for 14 h. Samples were collected at 24 h for dNTP measurement. Untreated samples are from Fig. 5f. Quantifications of dATP and dTTP are reported. Two-tailed t-test was used.Source data are provided as a Source Data file.

Update of

Similar articles

Cited by

References

    1. Menolfi D, Zha S. ATM, ATR and DNA-PKcs kinases-the lessons from the mouse models: inhibition not equal deletion. Cell Biosci. 2020;10:8. doi: 10.1186/s13578-020-0376-x. - DOI - PMC - PubMed
    1. Macheret M, Halazonetis TD. Intragenic origins due to short G1 phases underlie oncogene-induced DNA replication stress. Nature. 2018;555:112–116. doi: 10.1038/nature25507. - DOI - PMC - PubMed
    1. Saldivar JC, Cortez D, Cimprich KA. The essential kinase ATR: ensuring faithful duplication of a challenging genome. Nat. Rev. Mol. Cell Biol. 2017;18:622–636. doi: 10.1038/nrm.2017.67. - DOI - PMC - PubMed
    1. Brown EJ, Baltimore D. ATR disruption leads to chromosomal fragmentation and early embryonic lethality. Genes Dev. 2000;14:397–402. doi: 10.1101/gad.14.4.397. - DOI - PMC - PubMed
    1. Brown EJ, Baltimore D. Essential and dispensable roles of ATR in cell cycle arrest and genome maintenance. Genes Dev. 2003;17:615–628. doi: 10.1101/gad.1067403. - DOI - PMC - PubMed

Publication types

MeSH terms

Substances