. 2023 Jun 19;13(1):9939.
doi: 10.1038/s41598-023-36575-6.

Impact of urban spatial structure elements on carbon emissions efficiency in growing megacities: the case of Chengdu

Affiliations

Impact of urban spatial structure elements on carbon emissions efficiency in growing megacities: the case of Chengdu

Tian Feng et al. Sci Rep. .

Abstract

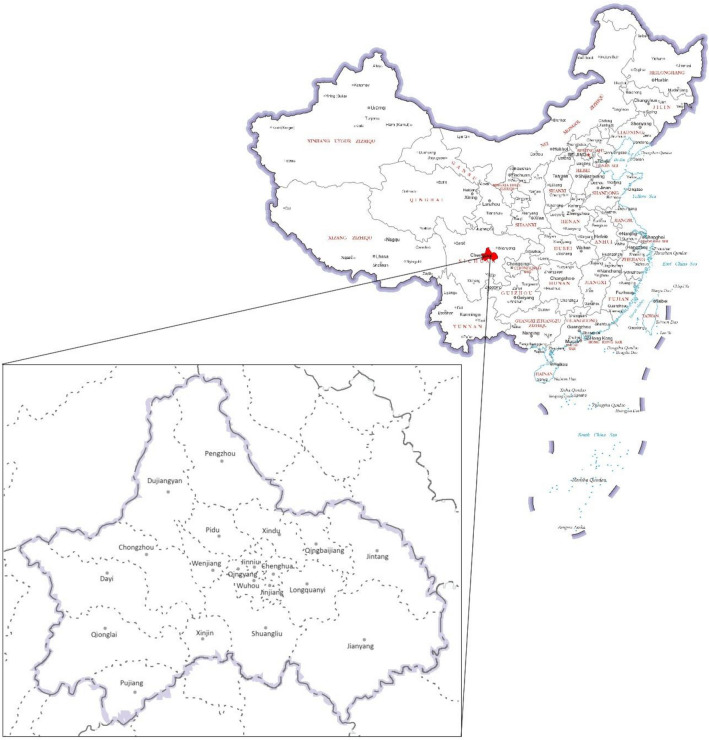
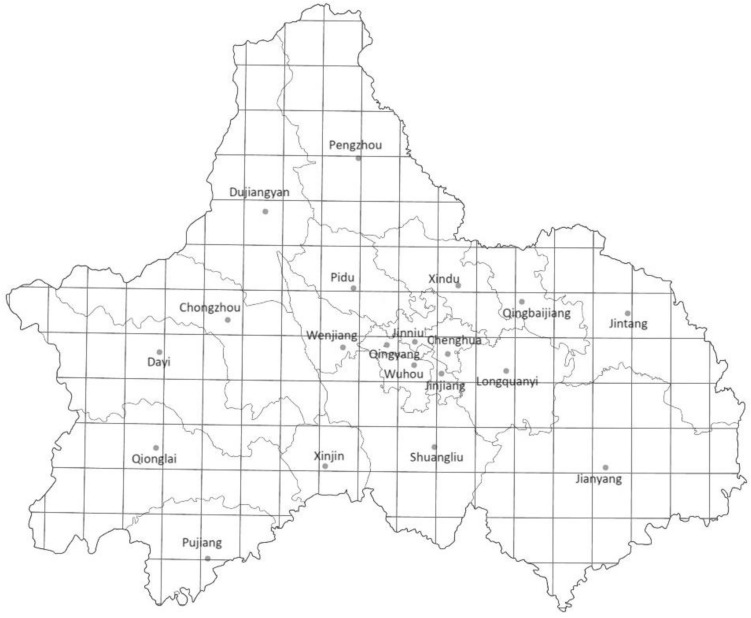
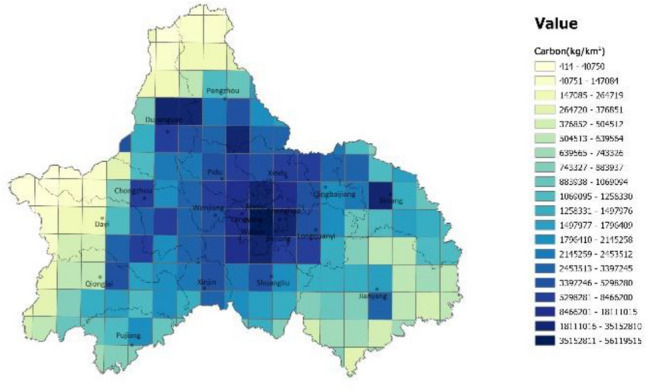
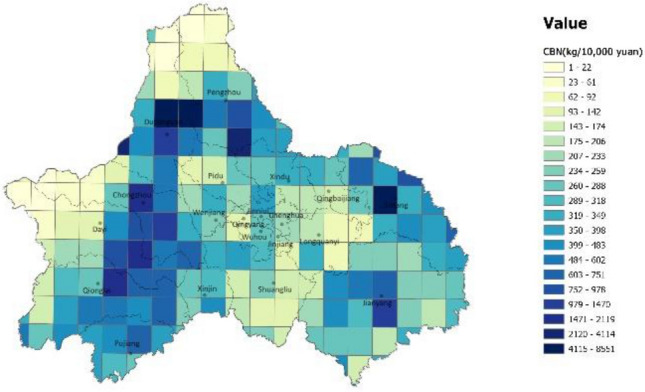
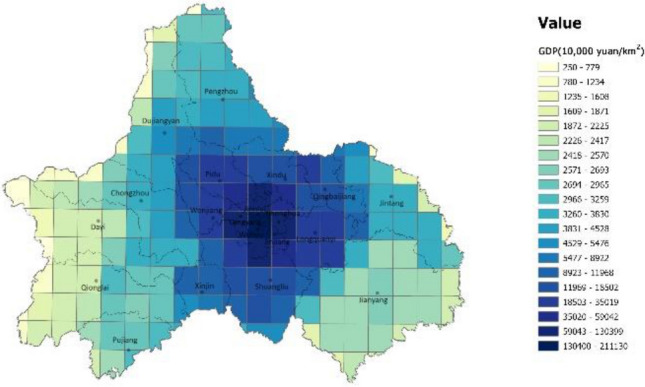
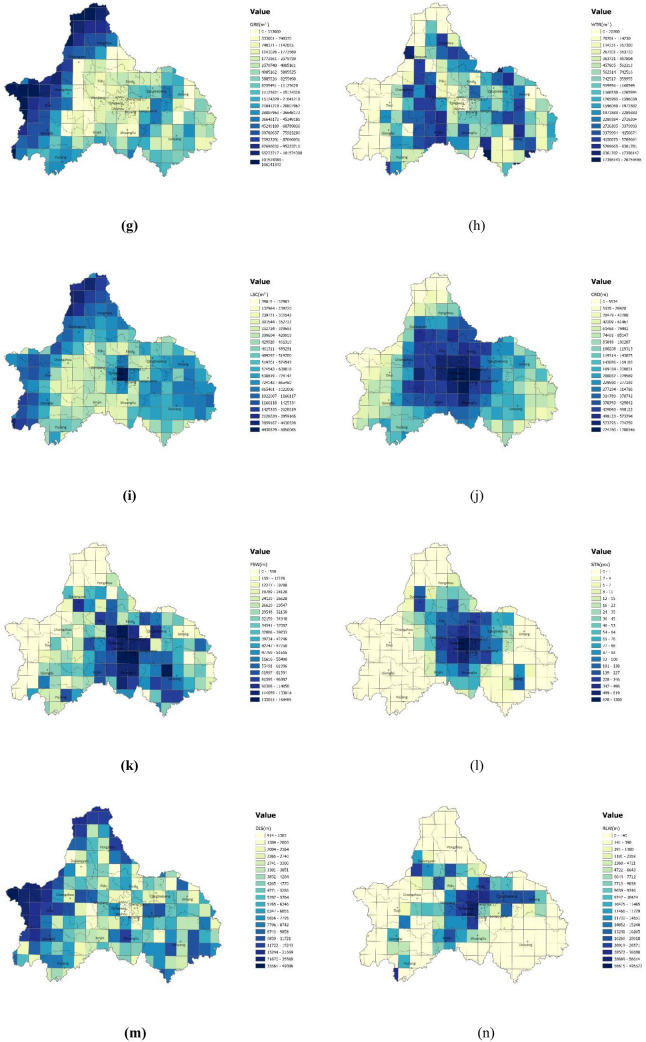
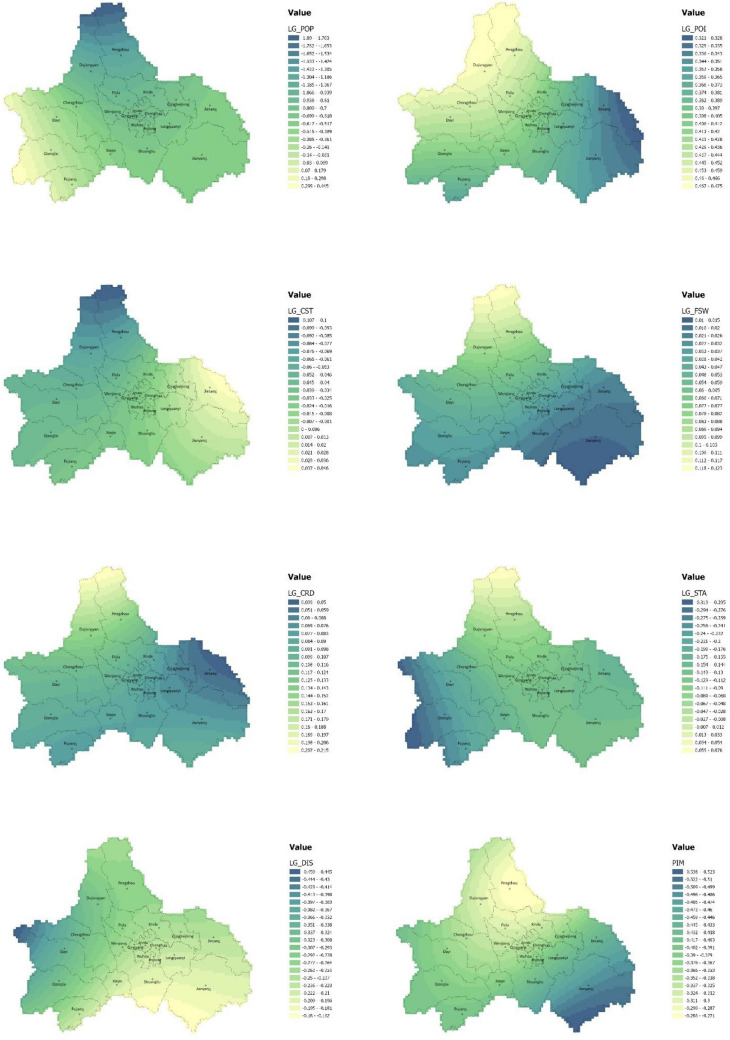
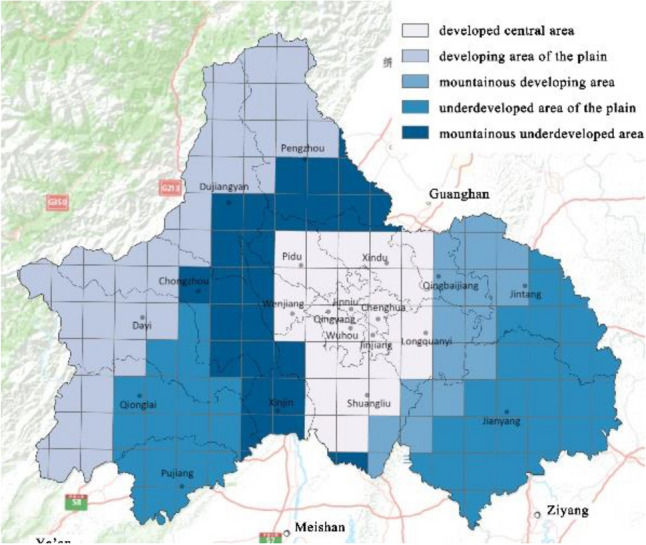
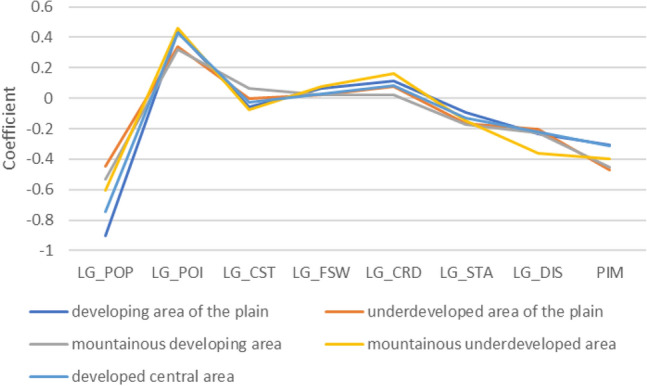
Quantitative research on the impact weight and impact of regional heterogeneity of urban spatial structure elements on carbon emissions efficiency can provide a scientific basis and practical guidance for low-carbon and sustainable urban development. This study uses the megacity of Chengdu as an example to measure and analyze the spatial carbon emission efficiency and multidimensional spatial structure elements by building a high-resolution grid and identifying the main spatial structure elements that affect urban carbon emissions and their impact weights via the Ordinary Least Squares regression (OLS) and Geographically Weighted Regression (GWR). The spatial heterogeneity of the impact of each element is also explored. The results show that the overall carbon emission efficiency of Chengdu is high in the center and low on the sides, which is related to urban density, functional mix, land use, and traffic structure. However, the influence of each spatial structure element is different in the developed central areas, developing areas of the plain, mountainous developing areas, underdeveloped areas of the plain, and mountainous underdeveloped areas. Thus, it is appropriate to form differentiated urban planning strategies based on the characteristics of the development of each zone. The findings provide inspiration and a scientific basis for formulating policies and practice to the future low-carbon development of Chengdu, while provide a reference for other growing megacities.


Conflict of interest statement

The authors declare no competing interests.

Figures

Figure 1
Figure 1
The location and geographic scope of Chengdu. (Note: the map on the right side is from Ministry of Natural Resources of the People’s Republic of China, No.GS(2019)1671, http://bzdt.ch.mnr.gov.cn/browse.html?picId=%224o28b0625501ad13015501ad2bfc0266%22; the map on left side was drawn by author with ArcGIS Pro, Version 3.0.2, ESRI, referring to information on Sichuan Bureau of Surveying, Mapping and Geoinformation, http://scsm.mnr.gov.cn/nbzdt.htm.)
Figure 2
Figure 2
The intra-city carbon emission efficiency grid of the city of Chengdu, which is a 0.1° × 0.1° grid divided by latitude and longitude, with an actual area of approximately 10 km × 10 km, 176 samples in total. (Note: ArcGIS Pro, Version 3.0.2, ESRI was used to create this figure).
Figure 3
Figure 3
A description of the spatial distribution of carbon emissions in Chengdu (unit: kg/km2). The color range spanning from blue to yellow, represents the carbon emissions from high to low. (Note: ArcGIS Pro, Version 3.0.2, ESRI was used to create this figure).
Figure 4
Figure 4
A description of the spatial distribution of carbon emissions efficiency in Chengdu (unit: kg/10,000 yuan). The color range spanning from blue to yellow, represents the carbon emissions from high to low. (Note: ArcGIS Pro, Version 3.0.2, ESRI was used to create this figure).
Figure 5
Figure 5
A description of the spatial distribution of GDP in Chengdu (unit: 10,000 yuan/ km2). The color range spanning from blue to yellow, represents the carbon emissions from high to low. (Note: ArcGIS Pro, Version 3.0.2, ESRI was used to create this figure).
Figure 6
Figure 6
Spatial distribution of spatial structure elements of Chengdu: (a) Population density; (b) Building density; (c) POI density; (d) Land use mix; (e) Land nature mix; (f) Construction site area; (g) Green area; (h) Water area; (i) Land patch scale; (j) City roads length; (k) Fastway length; (l) Station density; (m) Distance to the nearest transit station; (n) Railway length. The color range spanning from blue to yellow, represents values from high to low. (Note: ArcGIS Pro, Version 3.0.2, ESRI was used to create this figure).
Figure 6
Figure 6
Spatial distribution of spatial structure elements of Chengdu: (a) Population density; (b) Building density; (c) POI density; (d) Land use mix; (e) Land nature mix; (f) Construction site area; (g) Green area; (h) Water area; (i) Land patch scale; (j) City roads length; (k) Fastway length; (l) Station density; (m) Distance to the nearest transit station; (n) Railway length. The color range spanning from blue to yellow, represents values from high to low. (Note: ArcGIS Pro, Version 3.0.2, ESRI was used to create this figure).
Figure 7
Figure 7
Spatial distribution of influence coefficients of spatial structure elements: (a) Population density; (b) Building density; (c) POI density; (d) Land use mix; (e) Land nature mix; (f) Construction site area; (g) Green area; (h) Water area; (i) Land patch scale; (j) City roads length; (k) Fastway length; (l) Station density; (m) Distance to the nearest transit station; (n) Railway length. The color range spanning from yellow to green, represents values from high to low. (Note: ArcGIS Pro, Version 3.0.2, ESRI was used to create this figure).
Figure 8
Figure 8
The city of Chengdu is divided into developed central area, developing area of the plain, mountainous developing area, underdeveloped area of the plain, and mountainous underdeveloped area by GDP and topography. (Note: ArcGIS Pro, Version 3.0.2, ESRI was used to create this figure).
Figure 9
Figure 9
A chart to show the average influence coefficient of different urban spatial structure elements in each zone.

References

    1. Cai M, et al. The need for urban form data in spatial modeling of urban carbon emissions in China: A critical review. J. Clean. Prod. 2021;319:128792. doi: 10.1016/j.jclepro.2021.128792. - DOI
    1. Newman PWG, Kenworthy JR. Gasoline consumption and cities. J. Am. Plann. Assoc. 1989;55:24. doi: 10.1080/01944368908975398. - DOI
    1. Ma J, Zhou S, Mitchell G, Zhang J. CO2 emission from passenger travel in Guangzhou, China: A small area simulation. Appl. Geogr. 2018;98:121. doi: 10.1016/j.apgeog.2018.07.015. - DOI
    1. Makido Y, Dhakal S, Yamagata Y. Relationship between urban form and CO2 emissions: Evidence from fifty Japanese cities. Urban Clim. 2012;2:55. doi: 10.1016/j.uclim.2012.10.006. - DOI
    1. Liu X, Sweeney J. Modelling the impact of urban form on household energy demand and related CO2 emissions in the Greater Dublin Region. Energy Policy. 2012;46:359. doi: 10.1016/j.enpol.2012.03.070. - DOI