. 2023 Jul;26(7):1267-1280.
doi: 10.1038/s41593-023-01356-x. Epub 2023 Jun 19.

Multicellular communities are perturbed in the aging human brain and Alzheimer's disease

Affiliations

Multicellular communities are perturbed in the aging human brain and Alzheimer's disease

Anael Cain et al. Nat Neurosci. 2023 Jul.

Abstract

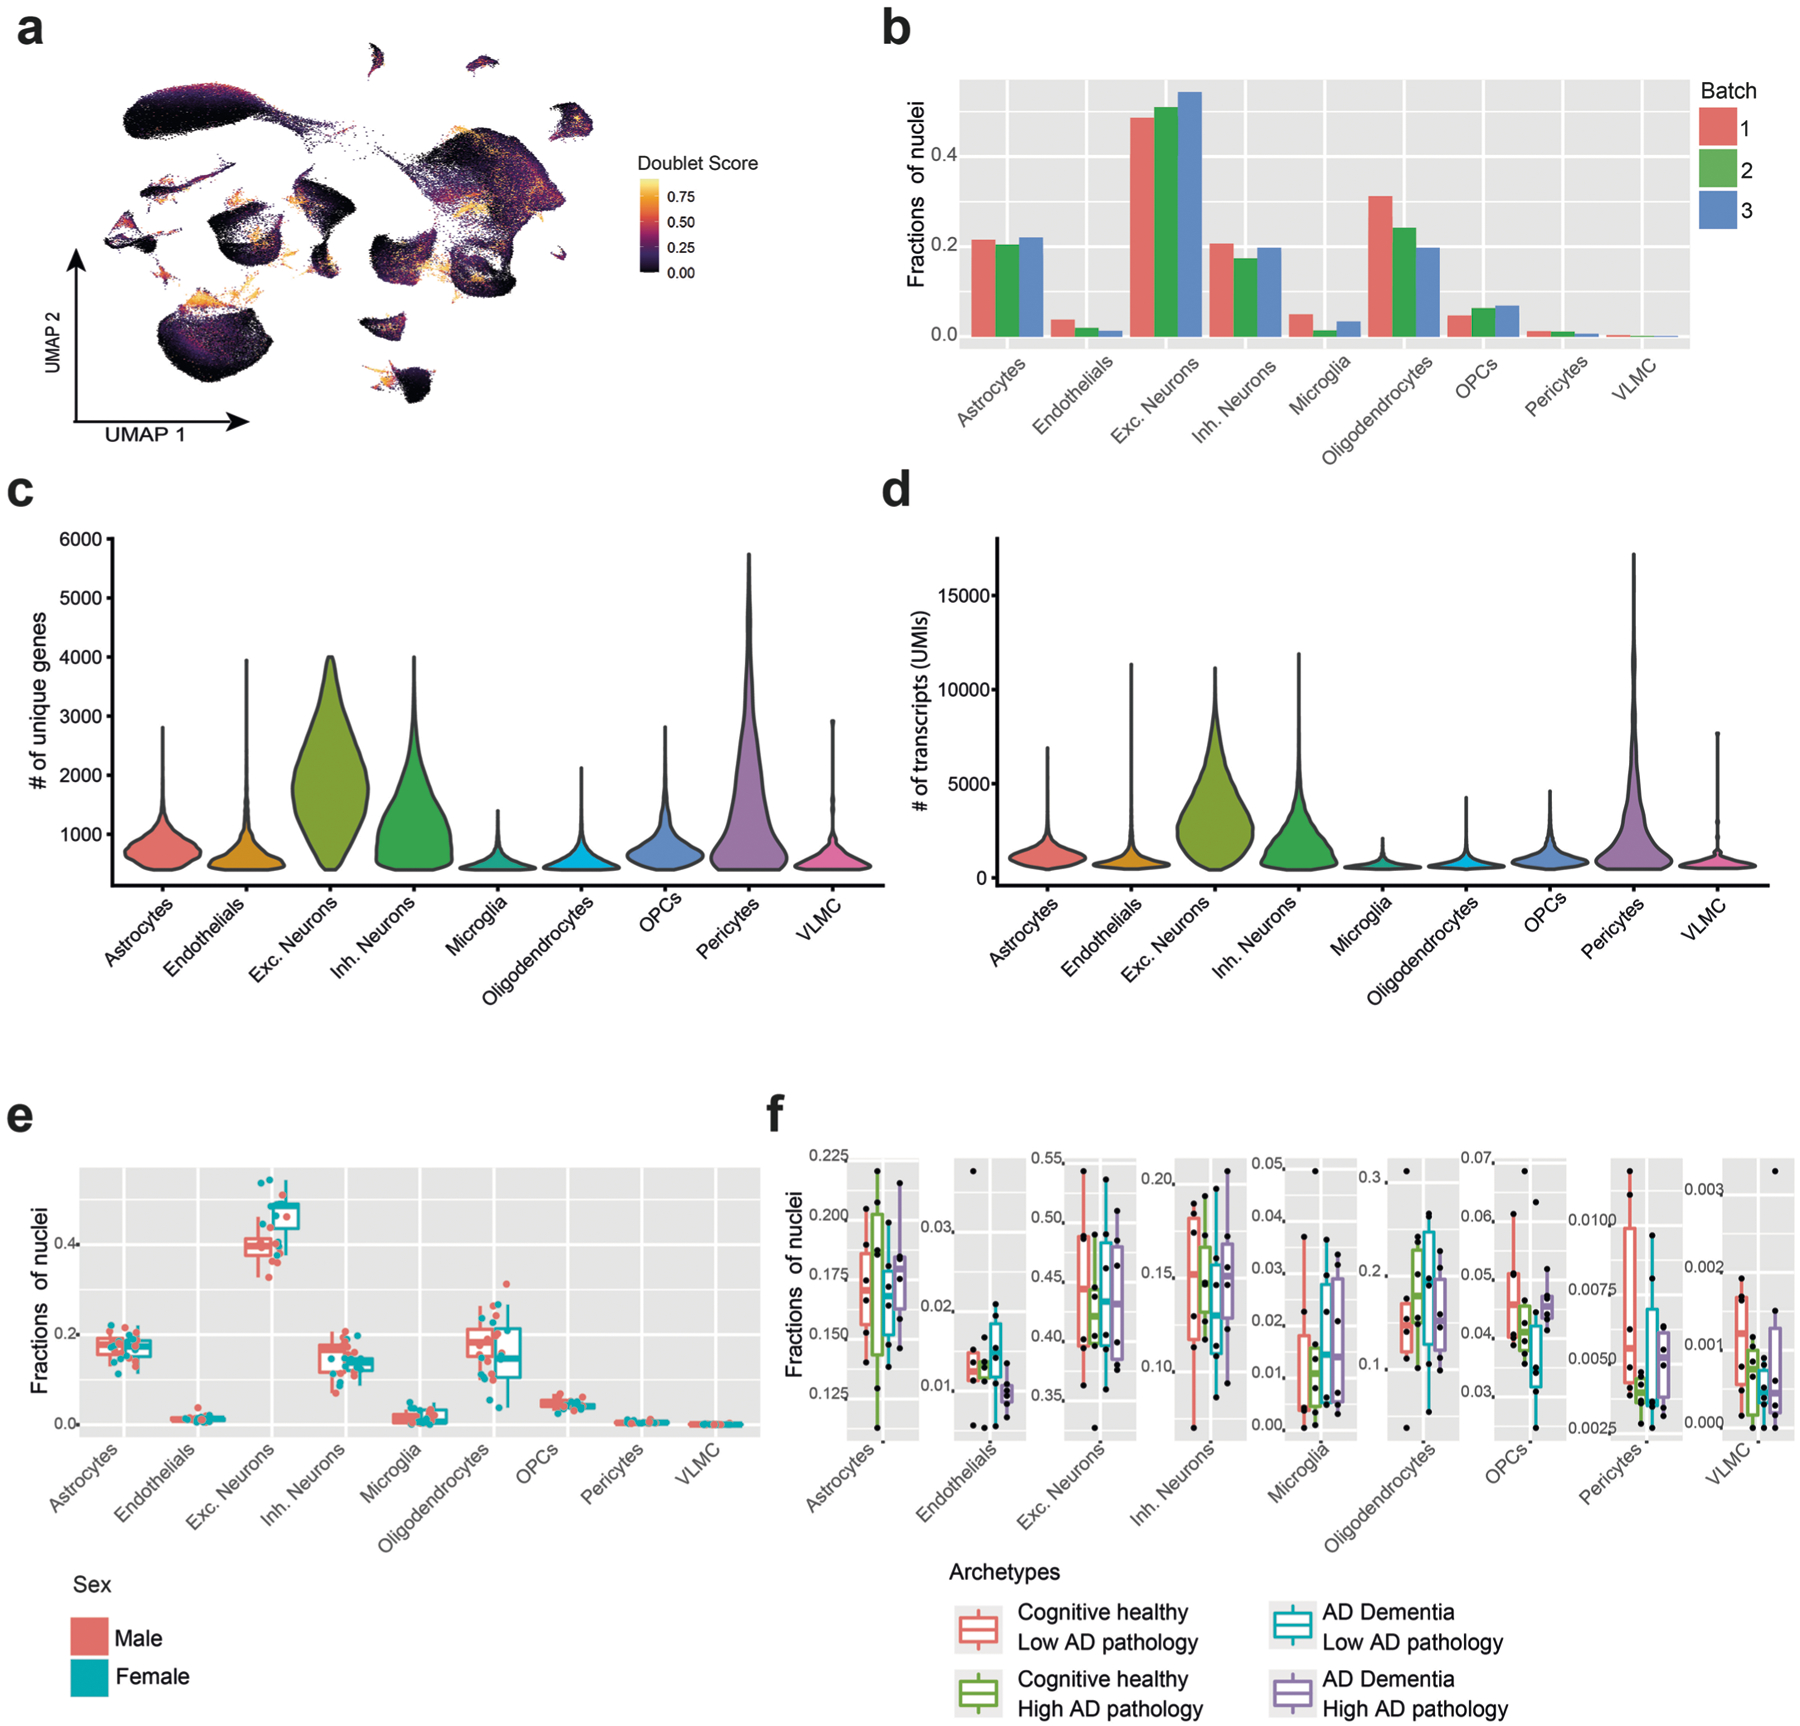
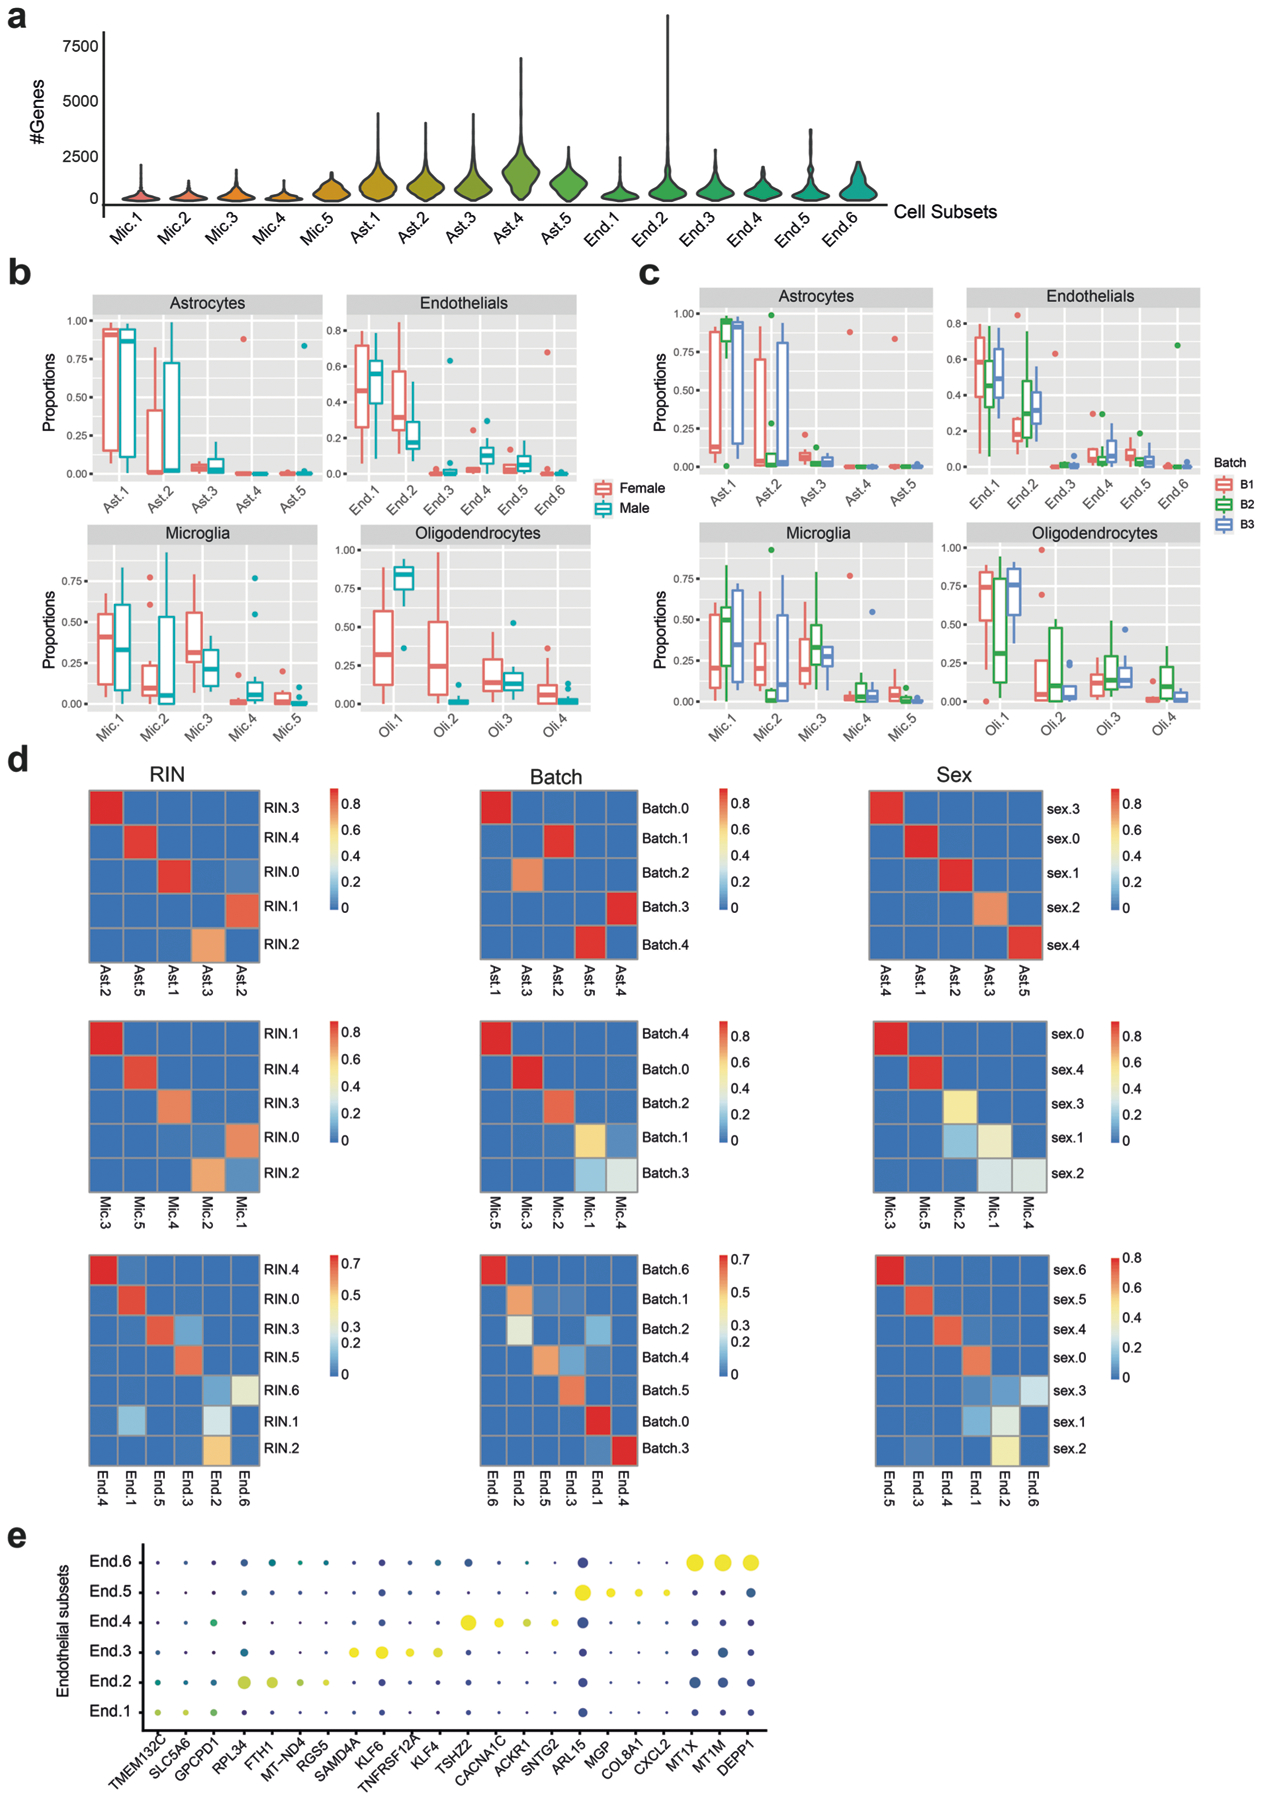
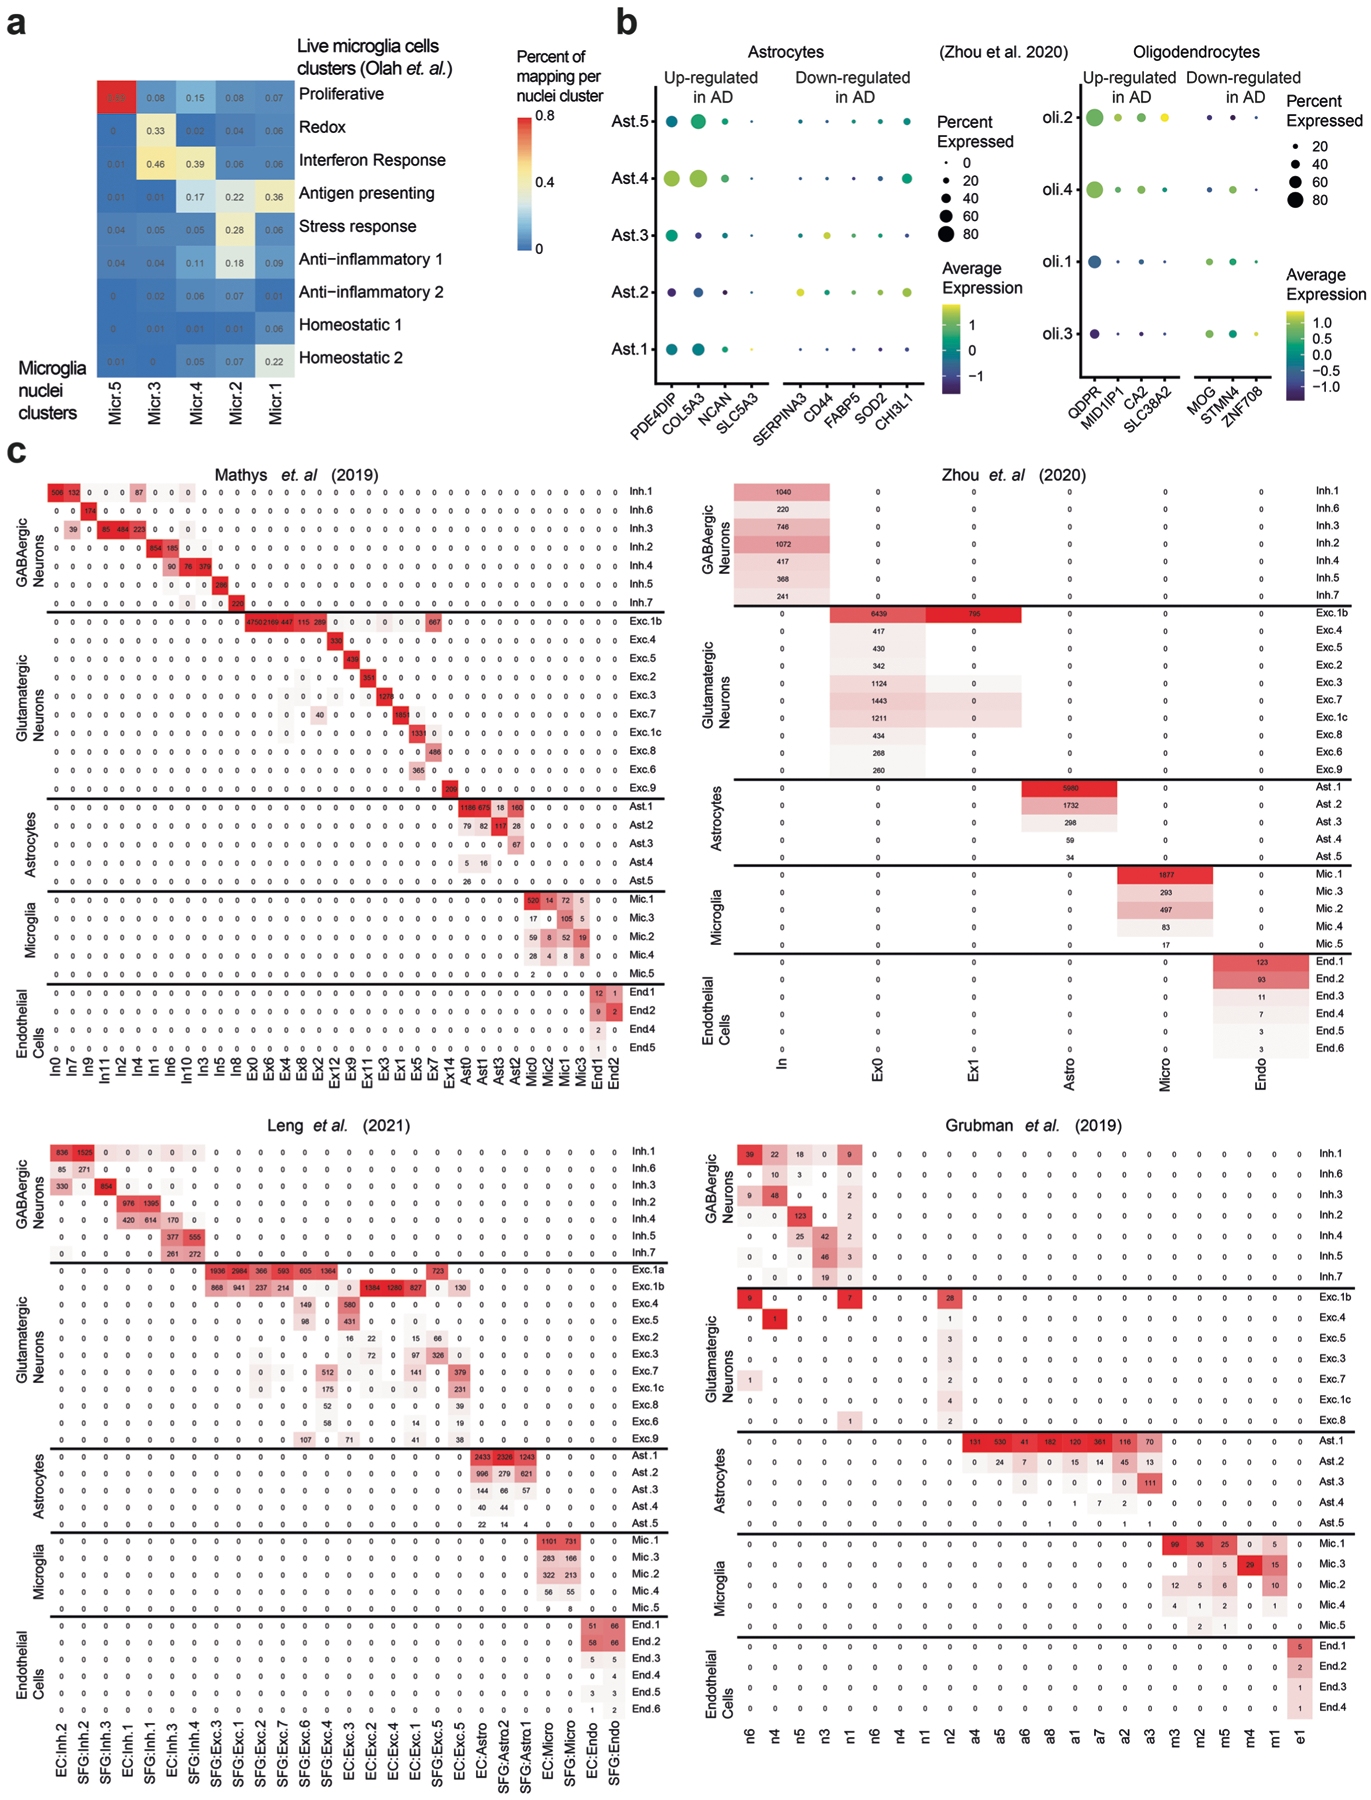
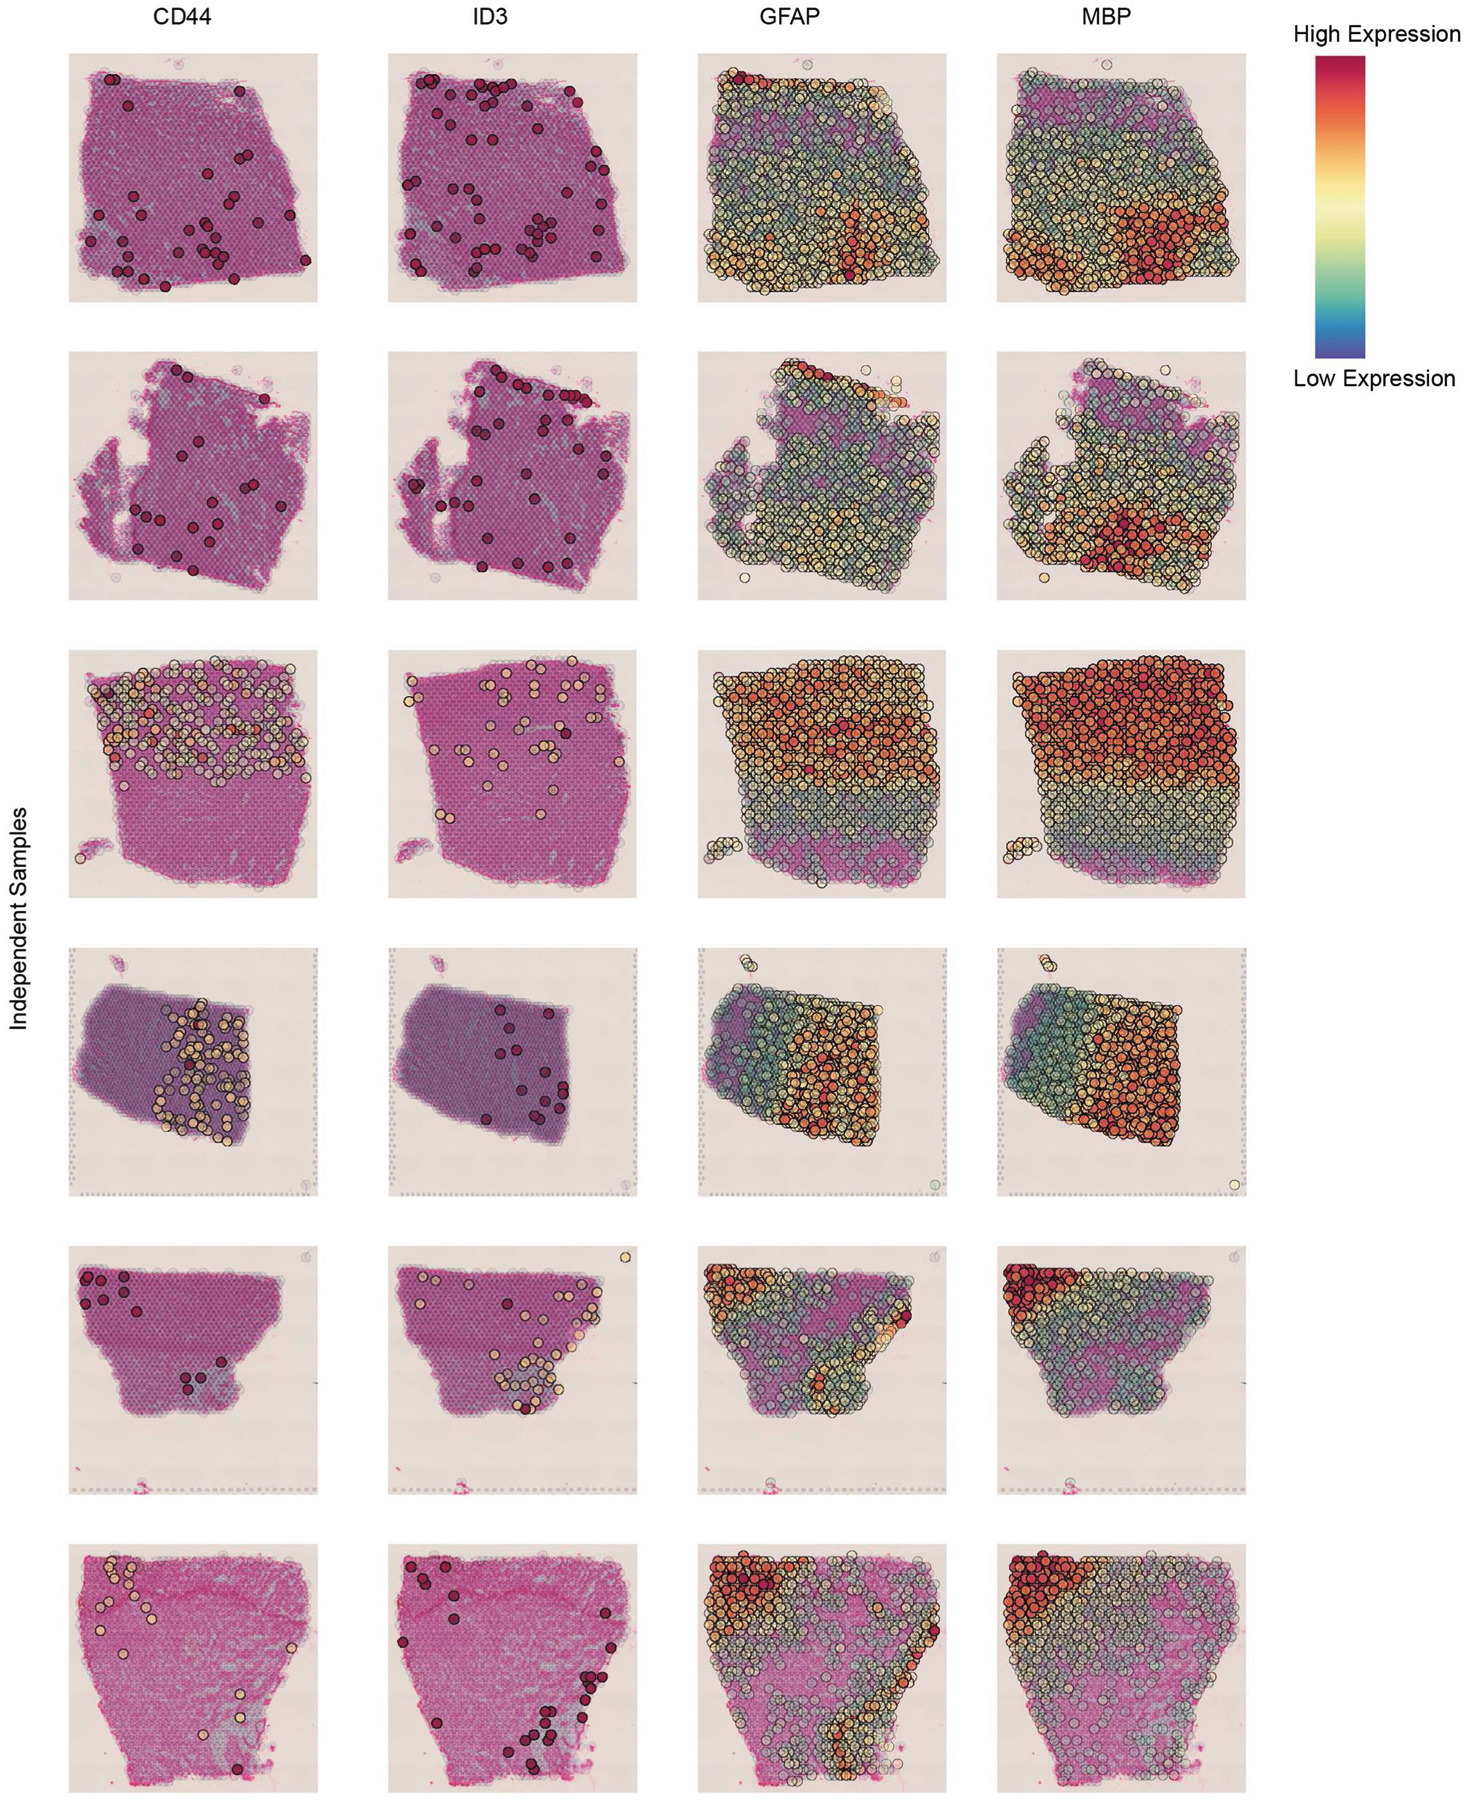
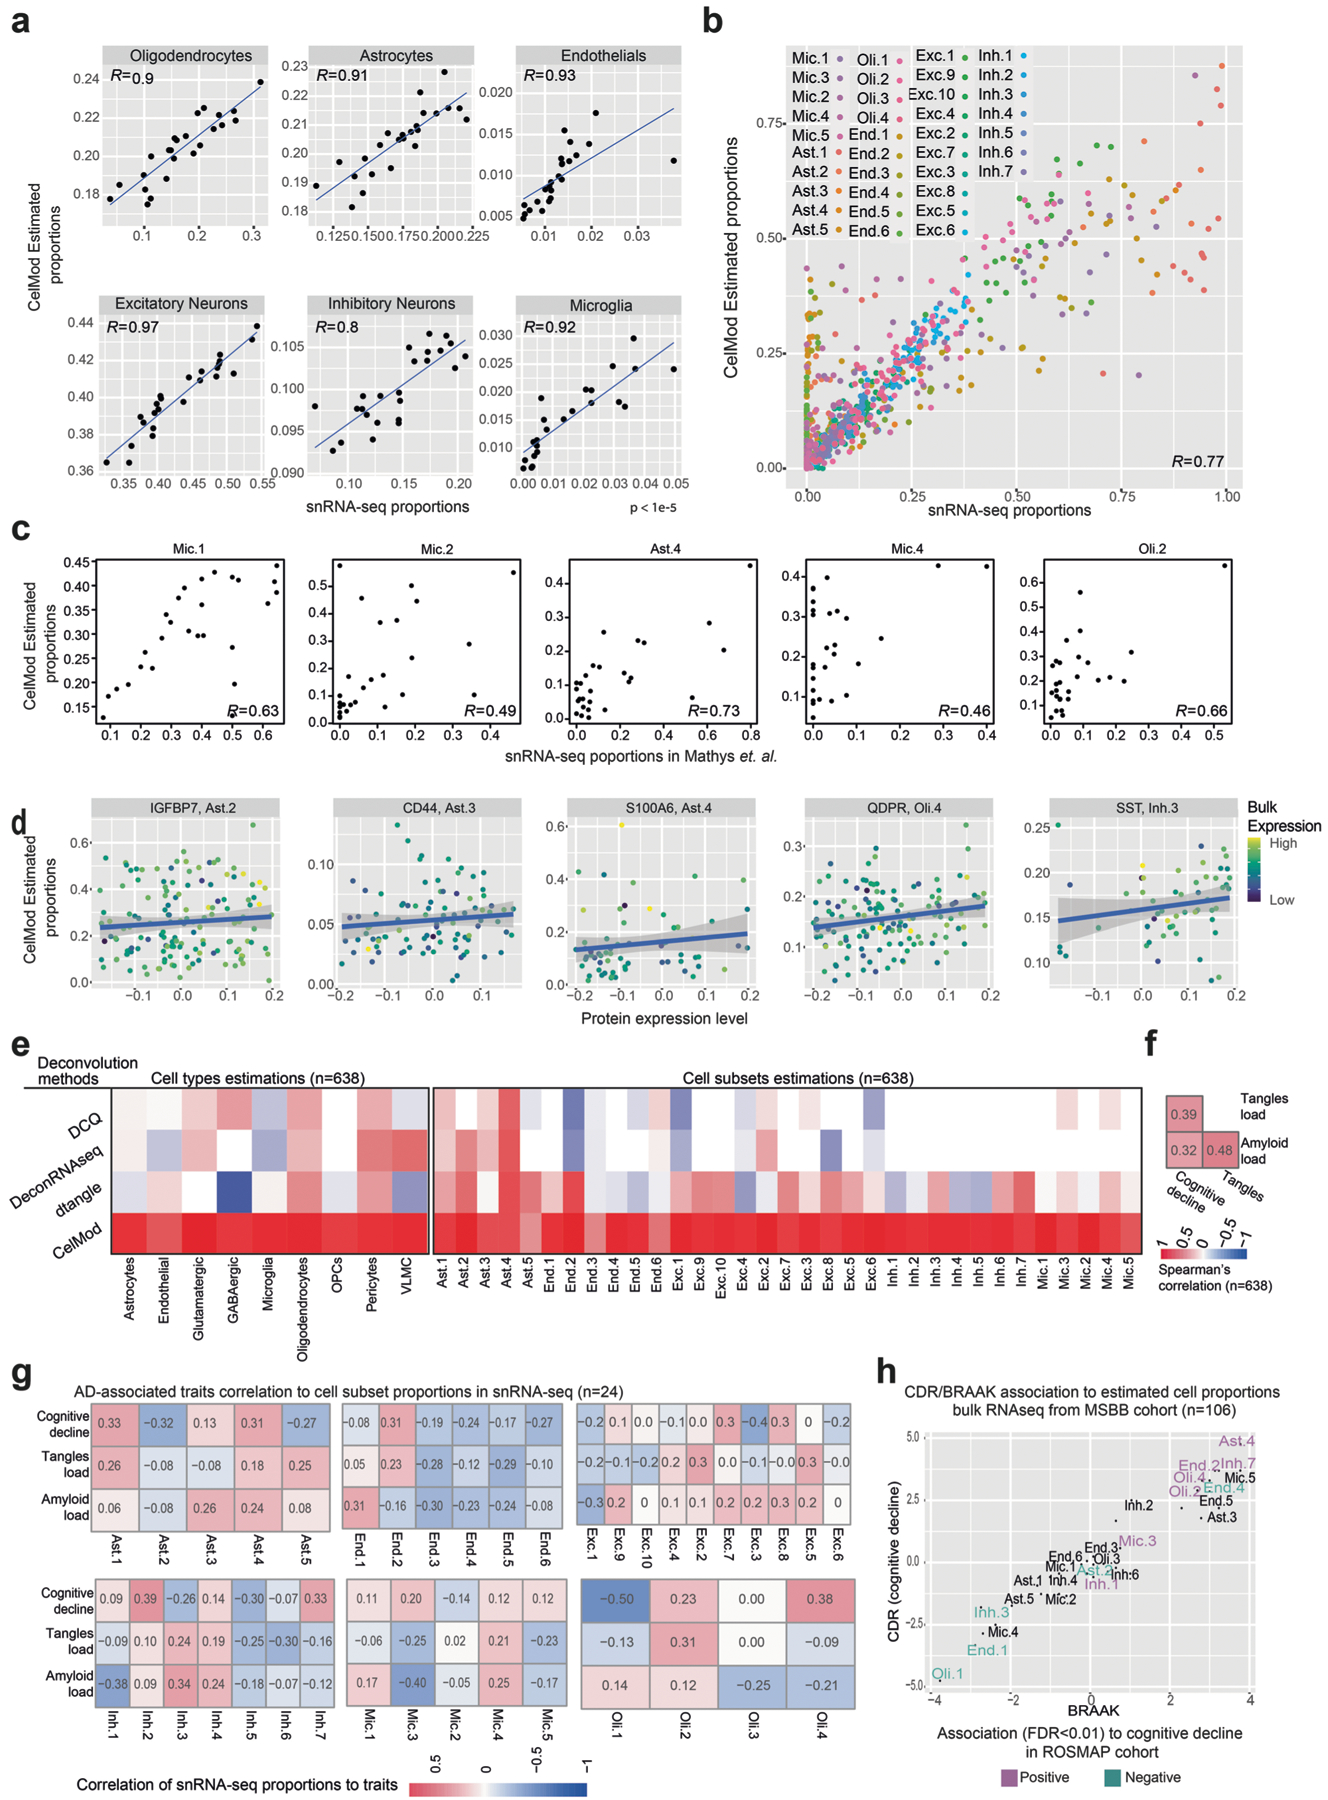
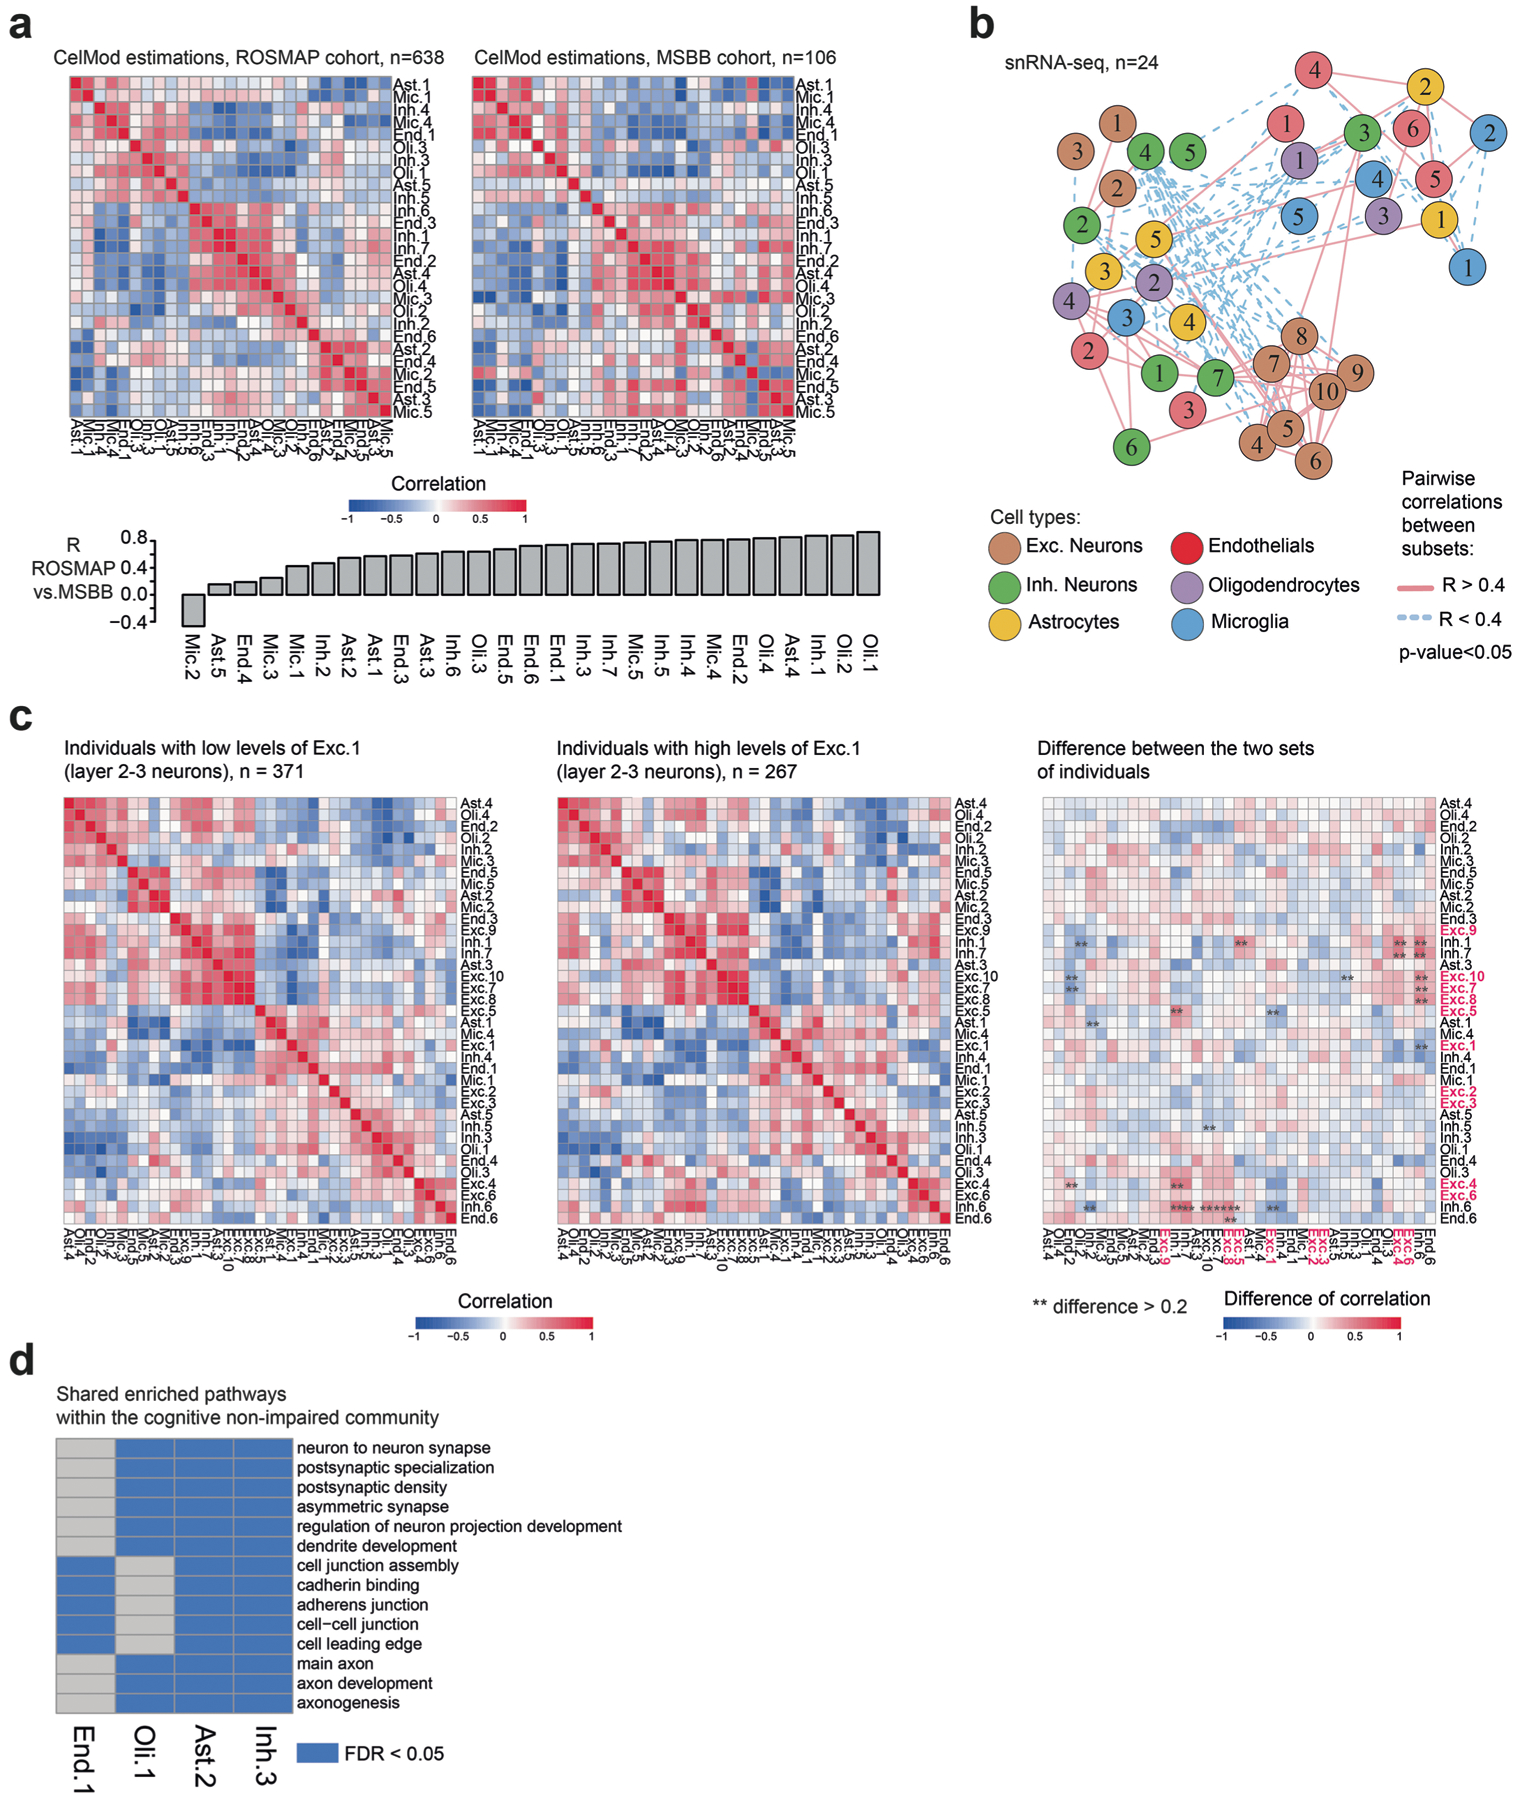
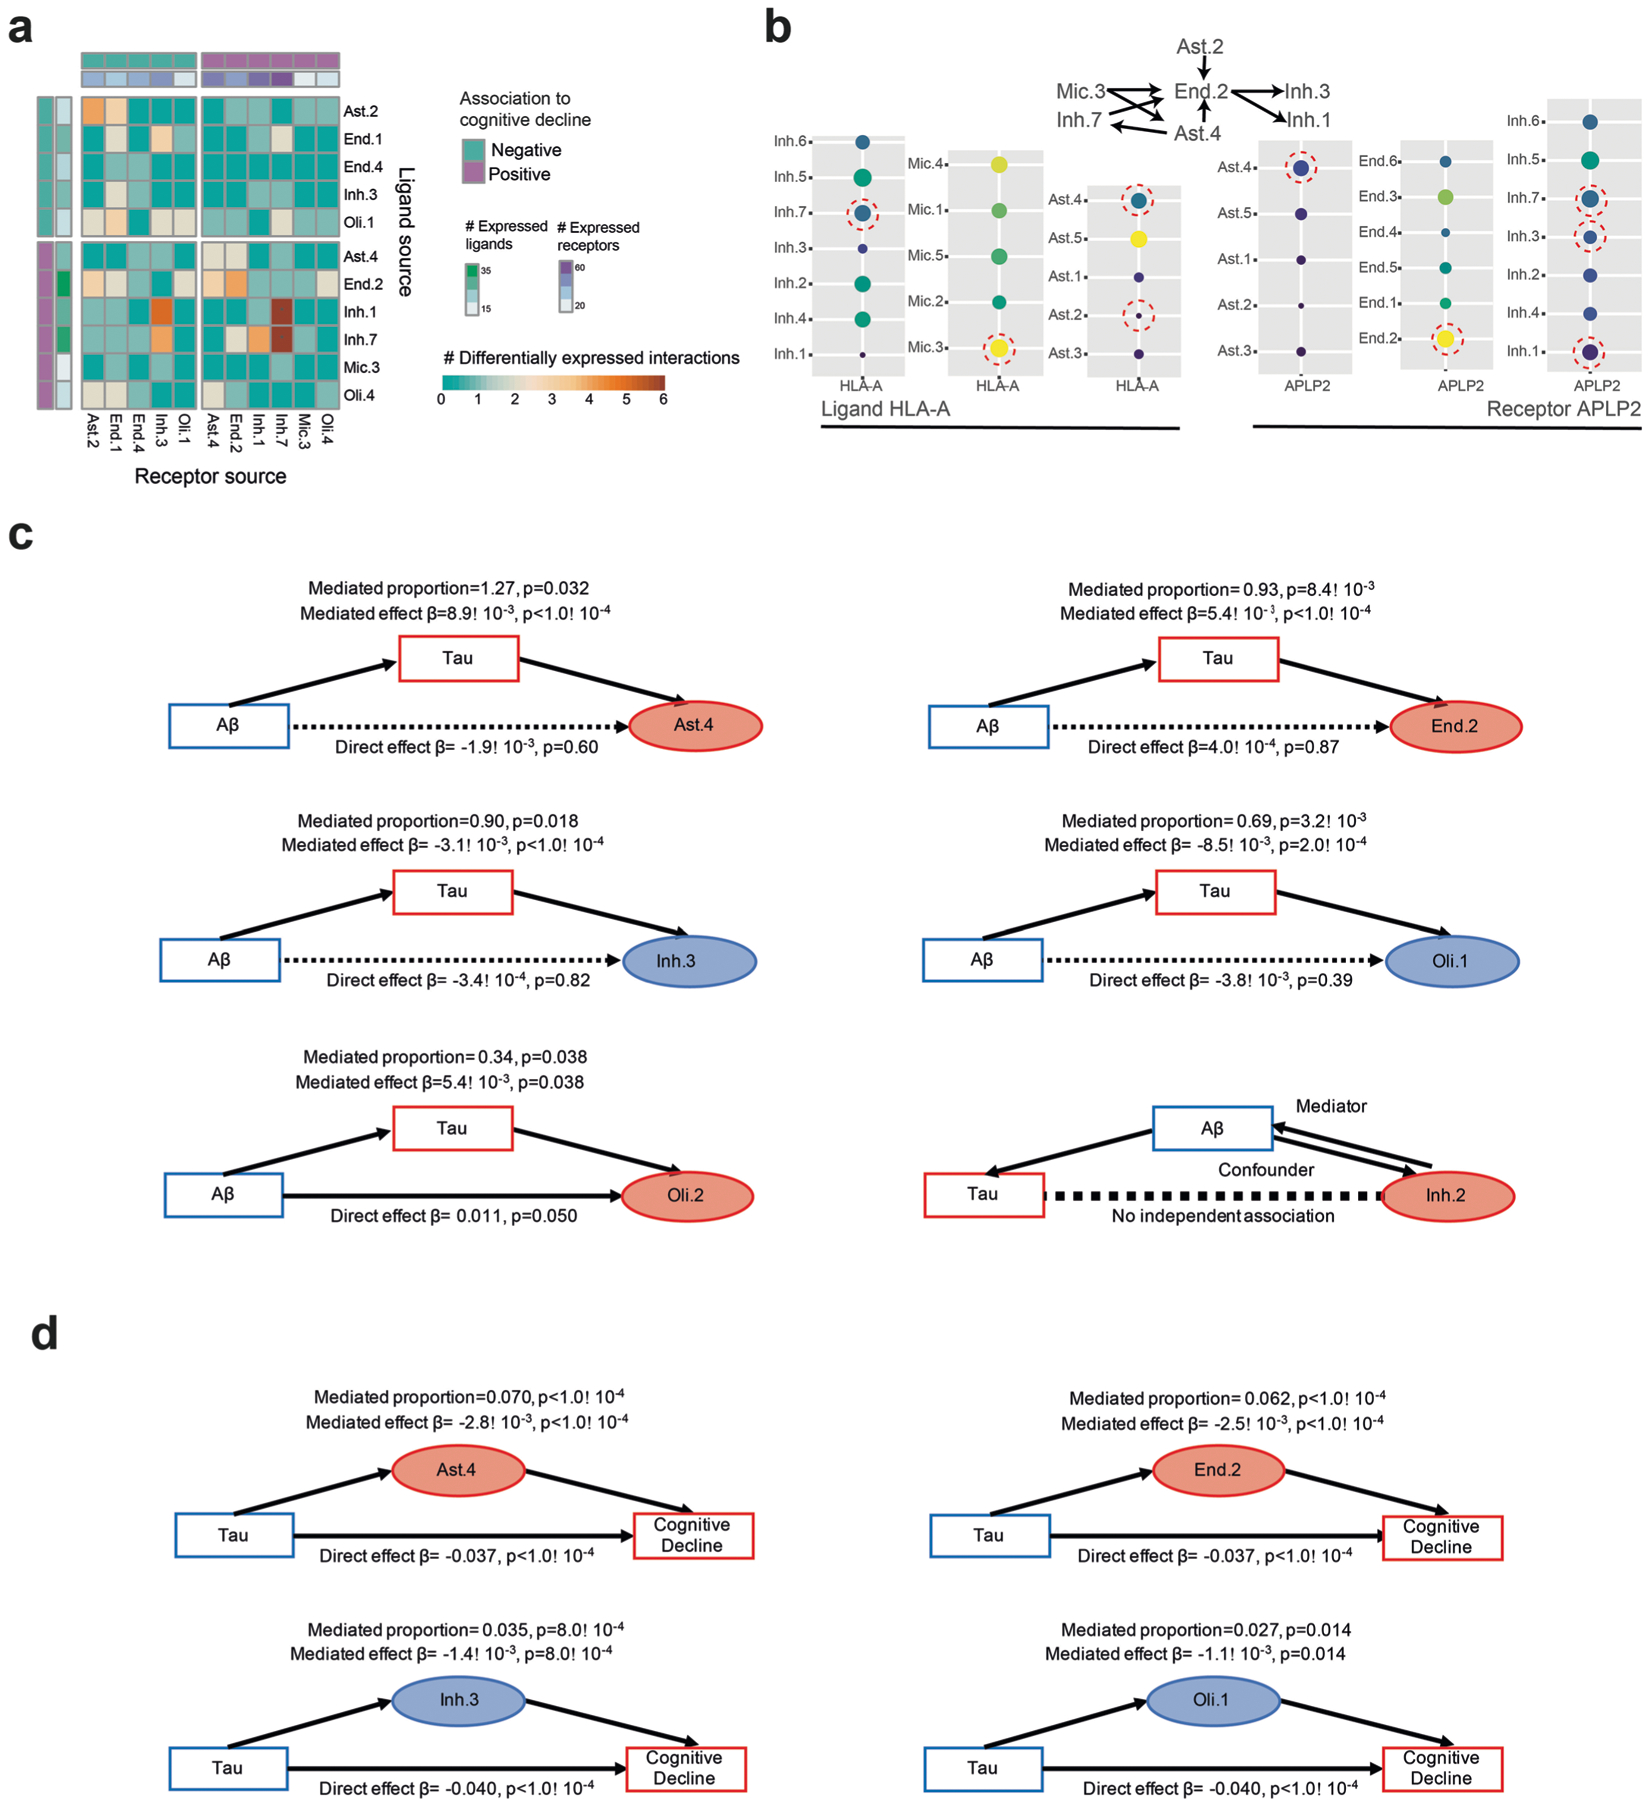
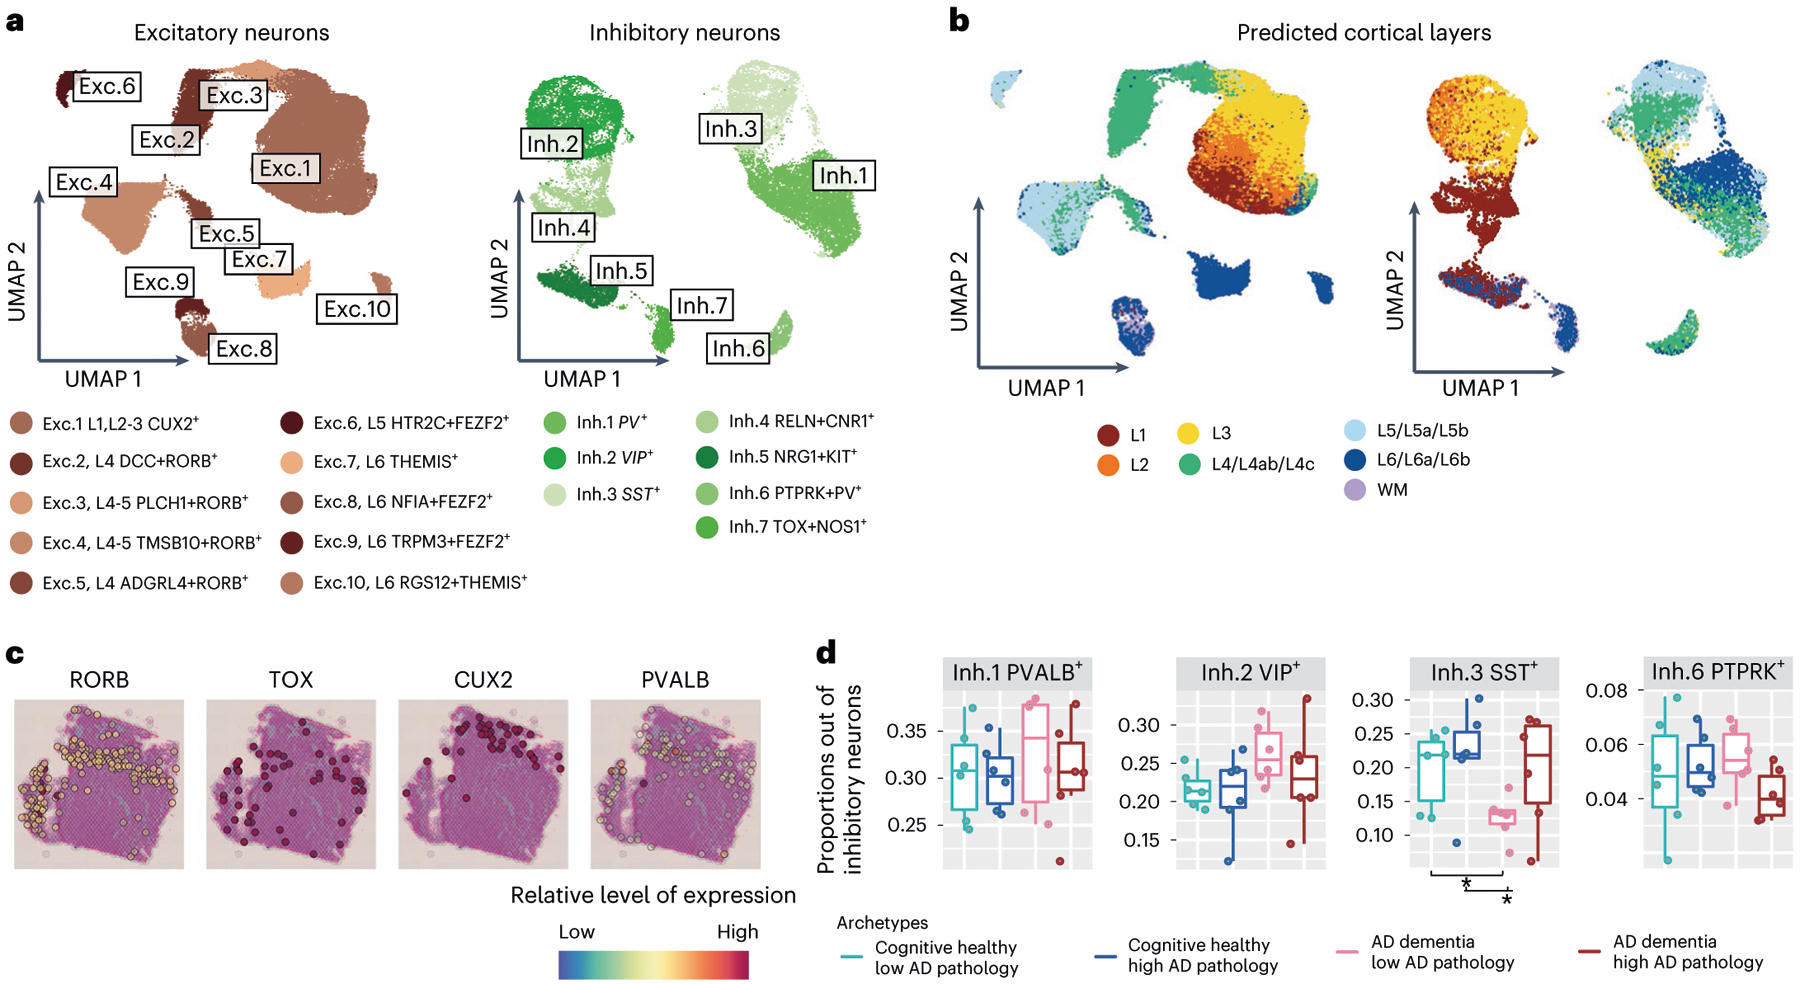
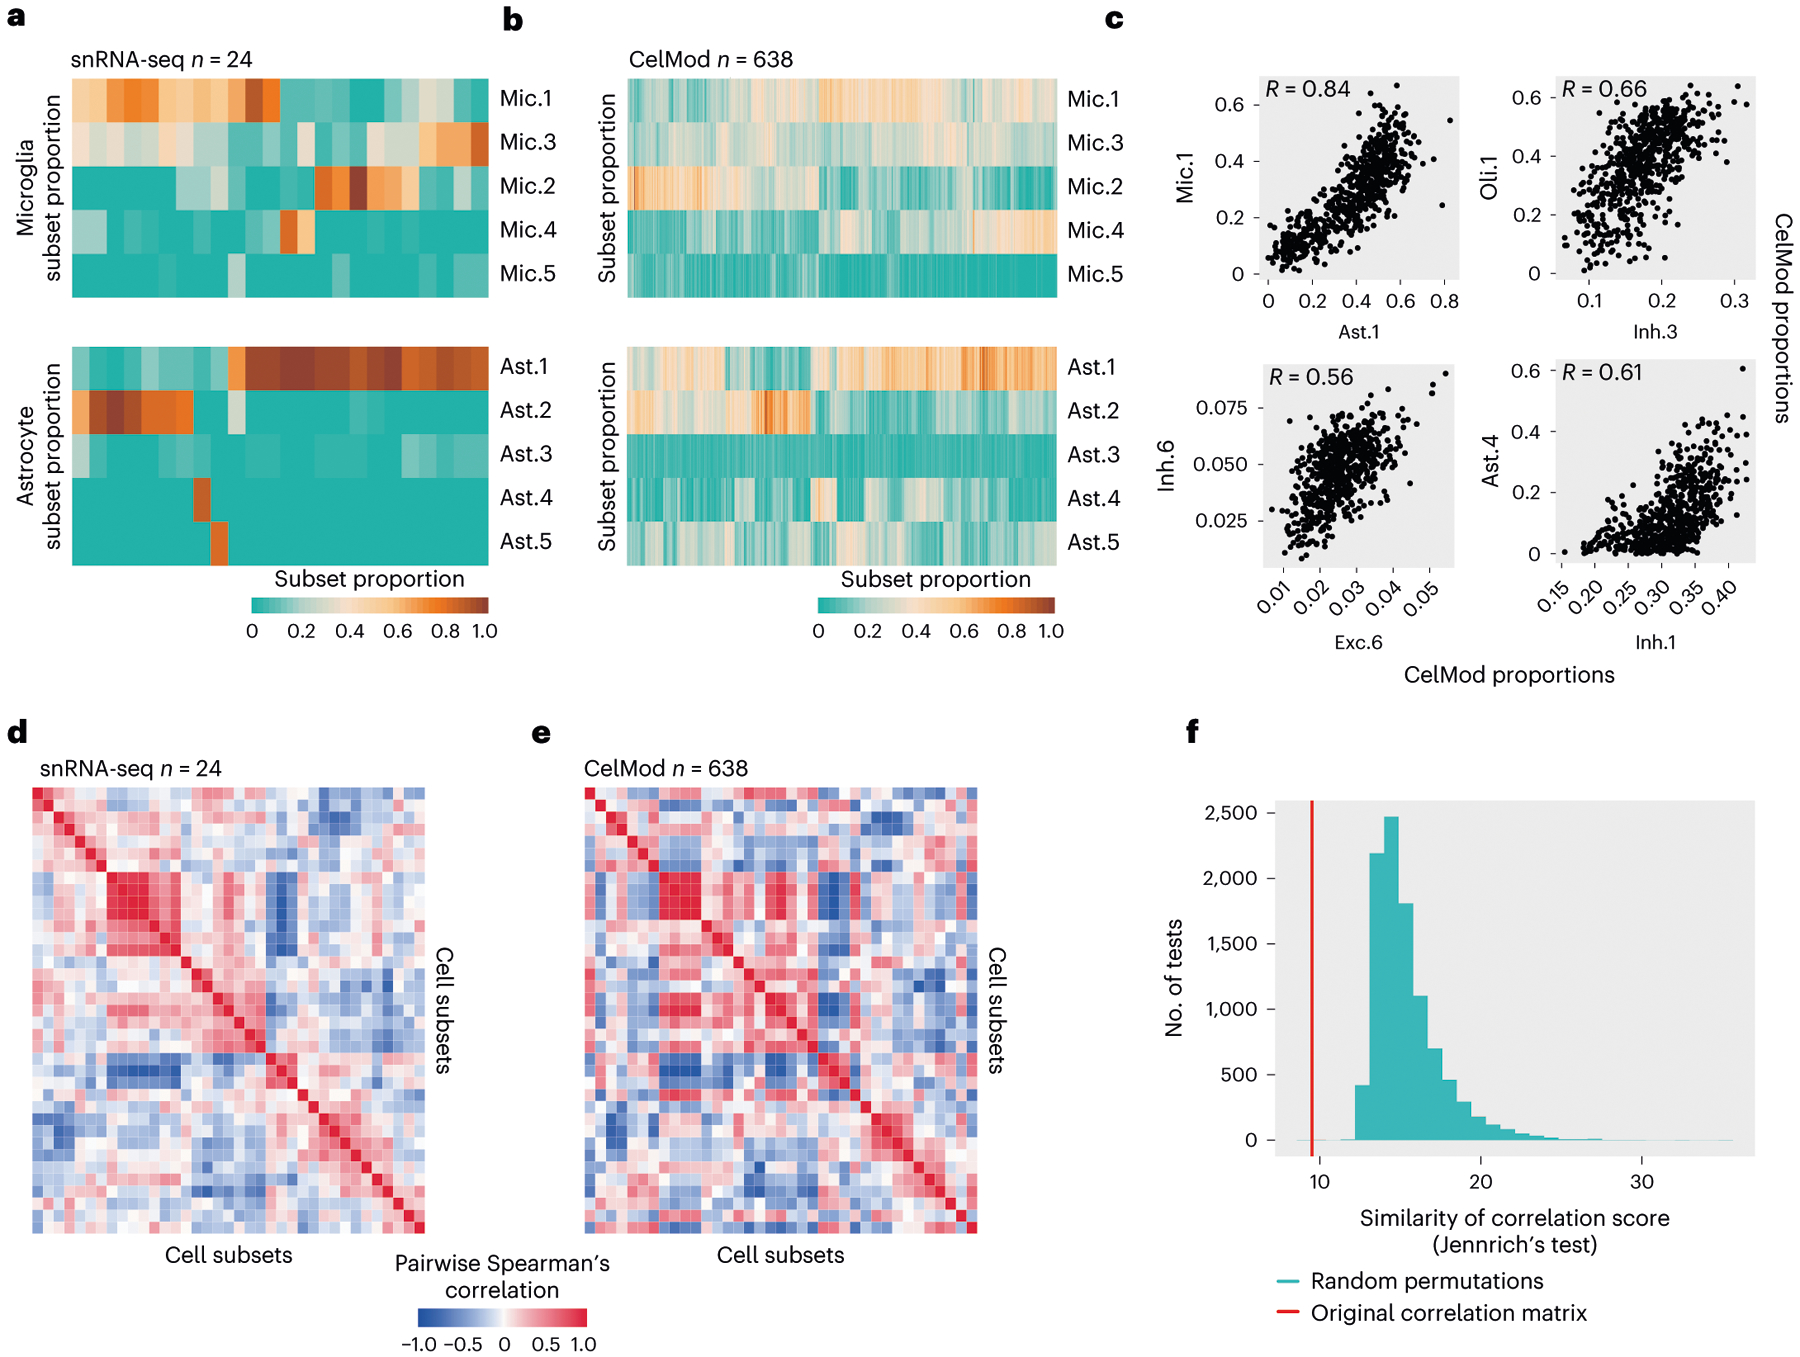
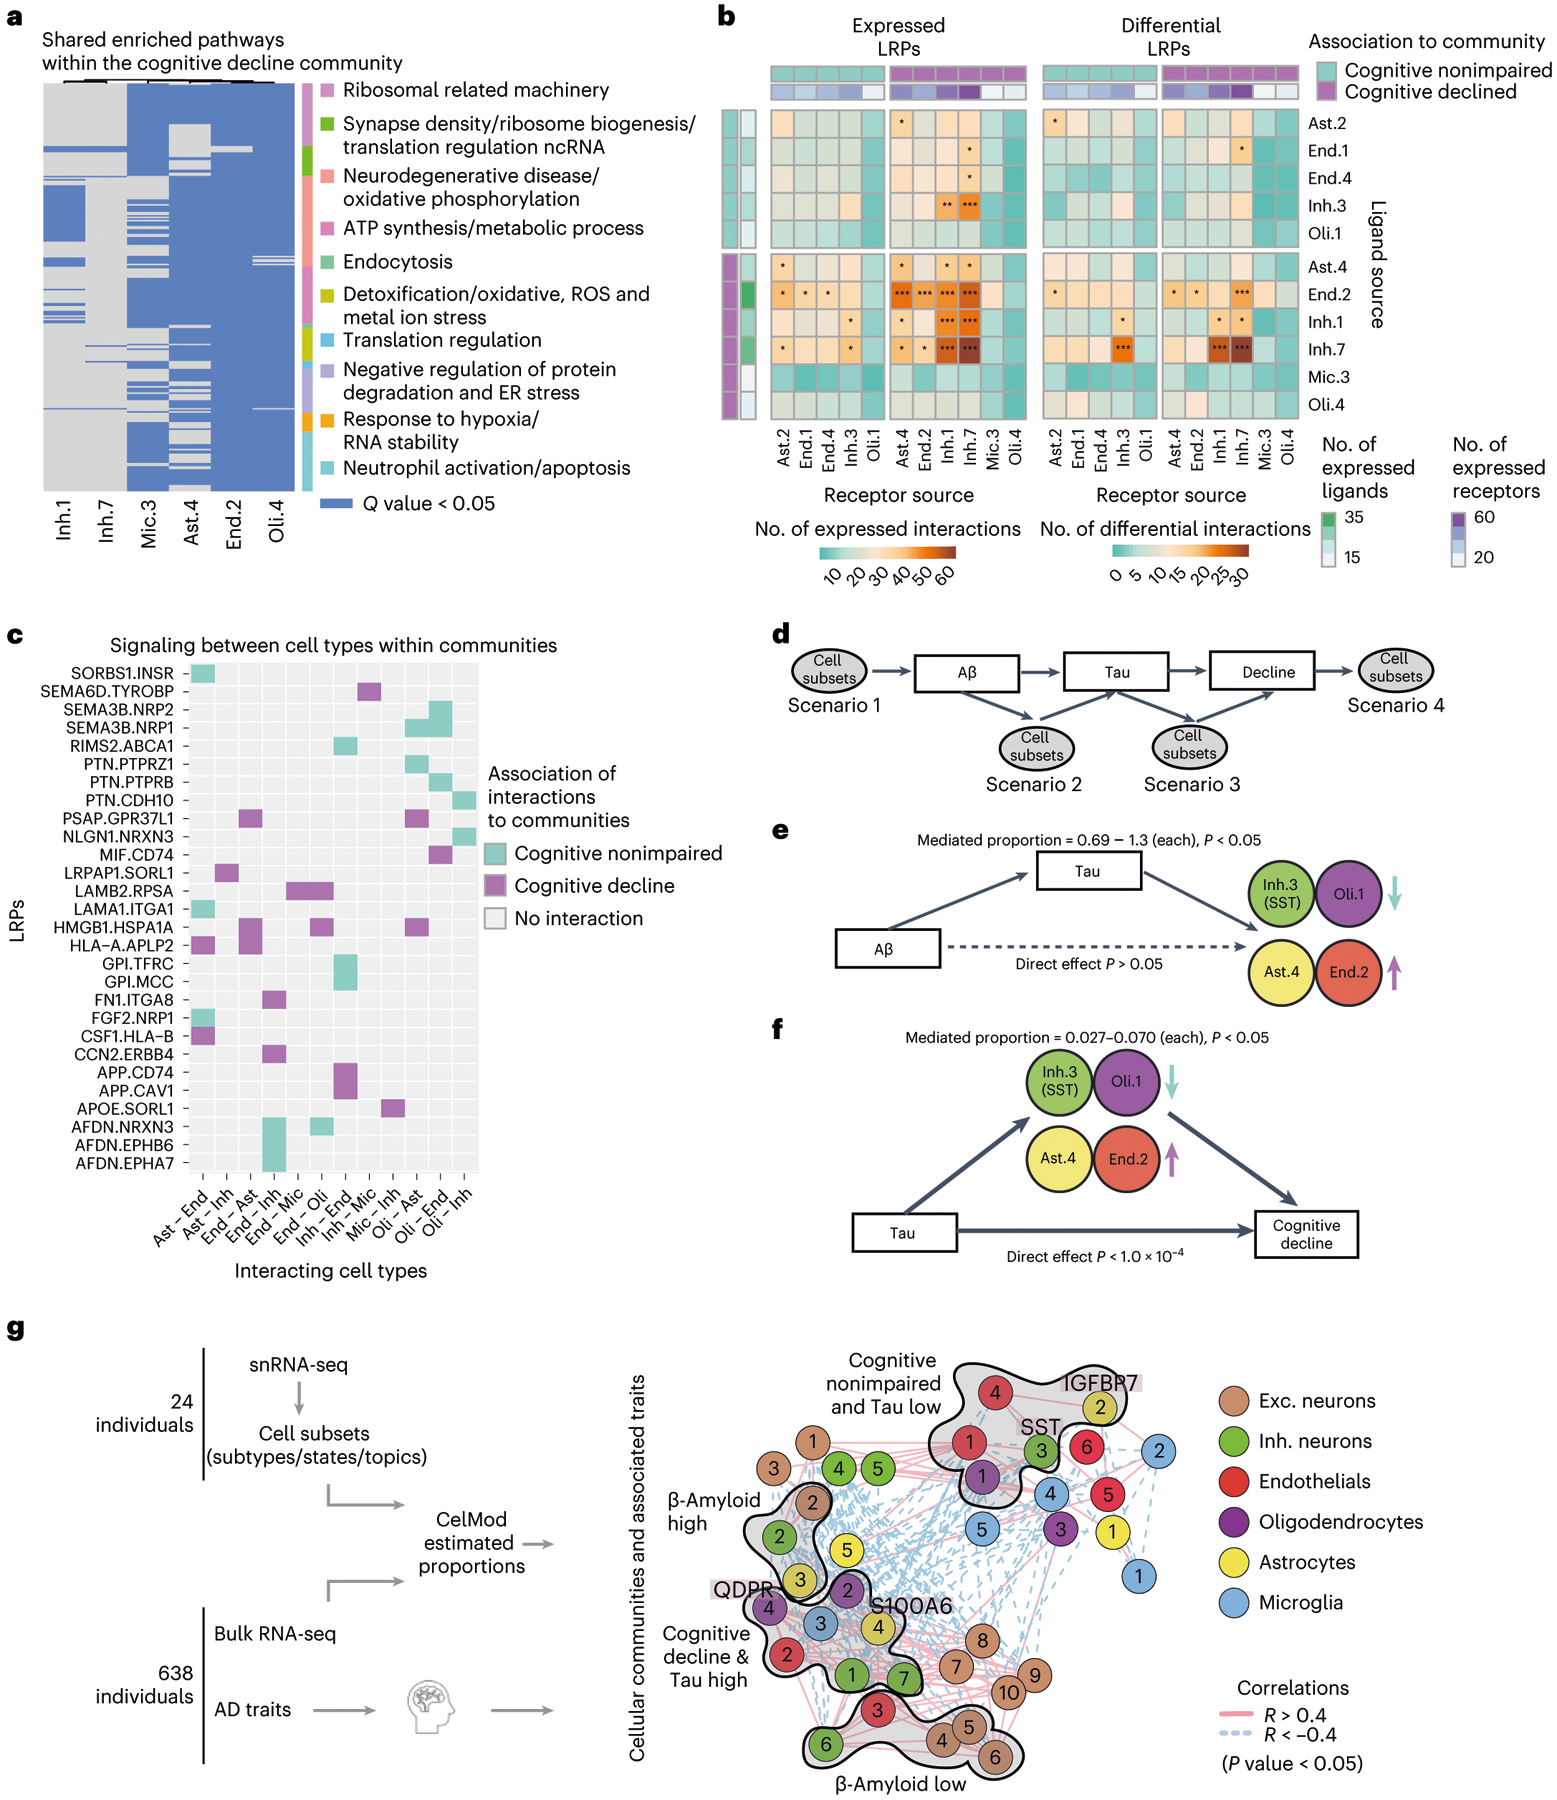
The role of different cell types and their interactions in Alzheimer's disease (AD) is a complex and open question. Here, we pursued this question by assembling a high-resolution cellular map of the aging frontal cortex using single-nucleus RNA sequencing of 24 individuals with a range of clinicopathologic characteristics. We used this map to infer the neocortical cellular architecture of 638 individuals profiled by bulk RNA sequencing, providing the sample size necessary for identifying statistically robust associations. We uncovered diverse cell populations associated with AD, including a somatostatin inhibitory neuronal subtype and oligodendroglial states. We further identified a network of multicellular communities, each composed of coordinated subpopulations of neuronal, glial and endothelial cells, and we found that two of these communities are altered in AD. Finally, we used mediation analyses to prioritize cellular changes that might contribute to cognitive decline. Thus, our deconstruction of the aging neocortex provides a roadmap for evaluating the cellular microenvironments underlying AD and dementia.


Conflict of interest statement

Competing interests

A.R. is a founder and equity holder of Celsius Therapeutics, an equity holder in Immunitas Therapeutics and until 31 August 2020 was an SAB member of Syros Pharmaceuticals, Neogene Therapeutics, Asimov and ThermoFisher Scientific. From 1 August 2020, A.R. is an employee of Genentech, a member of the Roche Group. The remaining authors declare no competing interests.

Figures

Extended Data Fig. 1 |
Extended Data Fig. 1 |. A cellular-molecular map of the human aging DLPFC: Quality controls.
(a) High quality nuclei libraries generated across n = 24 postmortem independent samples of the DLPFC brain region of aging individuals. Nuclei (dots) colored by the doublet score (Methods). (b) Distribution of cell type frequencies across batches. The fraction of nuclei (y-axis) per cell type for each batch (x-axis, n = 3 batches). (c, d) Distribution of number of genes (c) and transcripts (d) across the 9 major cell types in the DLPFC. Violin plots showing the distribution per cell type (for n = 172,659 nuclei). (e, f) Distribution of cell type frequencies across sex (e, n = 24 independent samples, 12 per group) and archetypes of AD (f, n = 24, 6 per group). Boxplot showing the fraction of nuclei per cell type for males (blue, n = 12) and females (red, n = 12). For box plots, the bottom and upper borders show the first and third quartiles. The central line indicates the median. The whiskers are extended to the extrema values (without accounting for outliers). Dots show individual samples. Archetypes defined as in Fig. 1a, b.
Extended Data Fig. 2 |
Extended Data Fig. 2 |. Quality controls of neuronal subtypes and their cortical layer specificity.
(a) Distinct expression of known and de novo marker genes in excitatory neuronal subtypes (top) and inhibitory neuronal subtypes (bottom) as assigned by our clustering analysis. Mean expression level in expressing cells (color) and percent of expressing cells (circle size) of selected markers in each neuronal subtype (rows) of marker genes. (b-c) Distribution of neuronal subtype frequencies across sex or batch for n = 24 independent sample. Boxplots showing the fraction of nuclei per neuronal subtype for sex (b, n=12 per group) or batch (c, n=8 per group): For box plots, the bottom and upper borders show the first and third quartiles. The central line indicates the median. The whiskers are extended to the extrema values (without accounting for outliers). Dots show outliers samples. (d) Marker genes of neuronal subtypes exhibit a spatial organization at distinct layers within DLPFC slices. Spatial transcriptomics across 6 slices from 3 individuals for five marker genes (RORB, TOX, CUX2, PVALB, SLC17A7). Note variable orientation of slices. Complementary images to Fig. 2c.
Extended Data Fig. 3 |
Extended Data Fig. 3 |. Quality controls of glial subsets.
(a) Distribution of number of genes across microglia, astrocytes and endothelial clusters (denoted as subsets). (b, c) Distribution of non-neuronal subsets frequencies across sex and batch for n = 24 independent samples. Boxplot showing the fraction of nuclei per neuronal subtype for sex (b, n = 12 per group) or batch (c, n = 8 per group): For box plots, the bottom and upper borders show the first and third quartiles. The central line indicates the median. The whiskers are extended to the extrema values (without accounting for outliers). Dots show outlier samples. (d) RIN, sex and batch do not affect the sub-clustering of astrocytes, microglia and endothelial cells. Heatmaps of Jaccard score comparing overlaps of cells (color scales) between assignment of de-novo clusters after regression of the confounding variables from the expression matrix (rows) compared to the clusters in this study without such correction (columns) (Methods). (e) Endothelial subsets express unique markers. Dot plot of the mean expression level in expressing cells (color) and percent of expressing cells (circle size) of selected marker genes across endothelial subsets.
Extended Data Fig. 4 |
Extended Data Fig. 4 |. Comparison of cell clusters to previous studies.
(a) Clusters of microglia nuclei from snRNA-seq match published live microglia cell clusters from scRNA-seq. The proportions (color scale, scaled per column) of nuclei per cluster (columns) mapped to each scRNA-seq cell cluster according to the best prediction (rows, Methods). (b) Mean expression level in expressing cells (color) and percent of expressing cells (circle size) across cell subsets (rows) of previously described up-regulated and down-regulated genes in AD brains compared to healthy individuals, as defined by Zhou et al. for astrocytes (left) and oligodendrocytes (right). (c) Nuclear-derived model is consistent with earlier, lower-resolution models across different cell types. Heatmaps (color scale) of assignment of nuclei from 24 individuals (rows) to published subsets (Methods) from 4 previous snRNA-seq derived cortical models,,,.
Extended Data Fig. 5 |
Extended Data Fig. 5 |. Spatial transcriptomics of glial markers.
Spatial transcriptomics of glial cell type and cell states markers, exhibit a spatial pattern across cortical layers matching DLPFC and white-matter anatomy. MBP (oligodendrocyte marker), GFAP (reactive astrocyte marker), ID3, CD44 (Ast.3 marker). Complementary to Fig.3g.
Extended Data Fig. 6 |
Extended Data Fig. 6 |. CelMod evaluation and comparison to other methods and datasets.
(a, b) CelMod estimated proportions match sn-RNAseq measured proportions. Scatter plots of CelMod proportions (Y-axis) compared to snRNA-seq proportions (X-axis), for 6 major cell classes (a) and all cell subsets and topic models (b, colored by subset). Line: linear regression. Each point is a sample (n = 24 independent samples). (c) Validation of CelMod in an independent dataset. CelMod estimated proportions of cell subsets (Y-axis) compared to snRNA-seq proportions (X-axis) measured across n = 48 independent samples of the prefrontal cortex Brodmann area 10 (Mathys et al.). Each point is a single individual. Cell subset annotations are based on our cell atlas (Methods). R=Correlation. (d) Protein expression of selected markers reflect cell subsets abundance. Scaled protein expression levels (X-axis) compared to CelMod estimated proportions of the related cell subset, colored by the bulk RNA-seq (proteomics in n = 196 independent individuals with matching bulk RNA profiles). Each point is a single individual. Line: linear regression fit with confidence interval (grey). (e) CelMod outperforms previous methods. Spearman correlation scores (color scale) of the snRNA-seq measured proportions of each cell type (left) and cell subset (right), compared to the estimated proportions by CelMod and three previous models. (f) Correlations between AD traits within our data. Pairwise correlations (color scale) of the three traits across n = 638 independent individuals. (g) Measured proportions of cellular subsets from snRNA-seq in n = 24 individuals correlate with AD pathology and cognitive decline. Correlation (color scale) of the proportions of each cell subset (columns) to AD-traits (rows). The proportions are calculated over the total number of nuclei per individual (n = 24) within each cell. (h) Cellular proportions associations to AD-ranking in the independent MSBB cohort matches the ROSMAP cohort. Association scores −log(FDR) ×sign ⁡(β), by multivariable linear regression) of proportions of cell subsets to two measures of AD ranking: BRAAK stage (tangles load) and the CDR (level of cognitive decline), in n = 106 independent samples (Methods). Cell subsets colored by the statistical significance of associations to the cognitive decline rate in the ROSMAP cohort (n = 638).
Extended Data Fig. 7 |
Extended Data Fig. 7 |. Evaluation of multi-cellular communities.
(a) Similar structure of coordinated changes between proportions of cell subsets and neuronal subtypes across individuals found in two independent cohorts. Pairwise Spearman correlation coefficients of the proportions of cell states and subtypes across individuals estimated by CelMod in bulk RNA-seq data of ROSMAP (left) and MSBB (right) cohorts. Bottom: Correlation between the pairwise association pattern of the ROSMAP and the MSBB cohorts per cell subset. (b) A network of cellular subsets reveals coordinated variation across individuals in multiple cell types. Network of coordinated and anti-coordinated cell subsets (nodes). Edges between pairs of subsets with statistically significant correlated proportions across individuals (r>0.4, p-value threshold=0.05, solid red line) or anti-correlated (r < −0.4, dashed blue line) based on snRNA-seq proportions (n = 24 independent samples, Spearman correlation, two sided, not adjusted for multiple comparison). Celmod based network in n = 638 individuals in Fig. 6b. Nodes are colored by the cell type and numbered by the subset as in Fig. 2a and Fig. 3a, d, h). (c) Coordinated changes in proportions of cell states and subtypes across individuals is independent of the cortical layer, except for excitatory neurons. Pairwise Spearman correlation coefficient of the CelMod proportions of all cell subsets and neuronal subtypes across individuals with low levels of Exc.1 (n = 371 individuals, left) or high levels of Exc.1 (n = 267 individuals, middle). Right: The differences in pairwise correlations between the Exc.1-high and Exc.1-low groups of individuals. Showing the partition mainly affects excitatory neurons (red). (d) Shared pathways within the cognitive non-impaired community. Enriched pathways (hypergeometric test, FDR q-value < 0.05, blue) in up-regulated genes for each cell subset within the cognitively non-impaired community (End.1, Oli.1, Ast.2, and Inh.3). Displaying shared enriched pathways between at least three subsets.
Extended Data Fig. 8 |
Extended Data Fig. 8 |. Signaling within and between multi-cellular communities and causal modeling.
(a) Cell subsets positively associated with cognitive decline have an increased expression of ligand-receptor pairs compared to the negatively associated subsets. For each pair of cell subsets showing the number (color scale) of ligand-receptor pairs (LRP, row: ligand, column: receptor) where both the ligand and the receptor are differentially expressed in the relevant subsets. Top and side bar marking: subsets positively (purple) or negatively (turquoise) associated with cognitive decline, and the total number of ligands and receptors expressed (color scale). (b) Expression of the HLA-A - APLP2 ligand-receptor pair across subtypes of different cell types. Dot plot of the mean expression level in expressing cells (color) and percent of expressing cells (circle size) of HLA-A and of APLP2 across subsets of selected cell types. (c) Mediation analysis results showing tangle pathology burden (tau) is predicted to be upstream of changes in proportion of Inh.3, Oli.1, Oli.2, Ast.4, and End.2, but not Inh.2. (d) Mediation analysis results showing partial effect of changes in proportion of Inh.3, Olig.1, Ast.4, and End.2 on cognitive decline independent of tau pathology burden.
Fig. 1 |
Fig. 1 |. A cellular–molecular map of the human aging DLPFC in 24 cognitively healthy and AD individuals.
a, Overview of the experimental scheme and analysis plan. Twenty-four individuals with clinicopathologic characteristics were profiled by snRNA-seq to generate a cellular map of the aging DLPFC brain region, and used as input to our CelMod deconvolution algorithm to estimate cellular compositions in an independent set of 638 individuals with bulk RNA-seq data. Network analysis uncovered cellular communities and cell subsets varying in a coordinated manner across individuals, and statistical modeling associated AD traits to cell subsets and to cellular communities. b, The 172,659 nuclear cDNA libraries were generated from the 24 postmortem samples of the DLPFC brain region of aging individuals. We report the number of cell profiles for each individual, ordered by the four major archetypes of the aging population: reference (nonimpaired individuals with minimal AD pathology), resilient (cognitively nonimpaired with a pathologic diagnosis of AD), AD group (both clinical and pathologic AD) and clinical AD only (AD dementia with minimal AD pathology). c, UMAP embedding of 172,659 single-nucleus RNA profiles from the DLPFC brain region of 24 individuals; colored by cell type. d, Diversity of cell type proportions across individuals. The proportions of cell types, color coded as in c, for each individual (rows). Exc., excitatory; Inh., inhibitory; OPC, oligodendrocyte precursor cells.
Fig. 2 |
Fig. 2 |. Diversity of neuronal subtypes across layers in the aging DLPFC.
a, Neuronal diversity in the DLPFC. Left, UMAP embedding of excitatory (74,999 cells, 10 clusters) and, right, inhibitory neuronal subtypes (24,938 cells, 7 clusters), colored by clusters capturing distinct subtypes (n = 24 independent samples of men and women), annotated by known neuronal markers (Extended Data Fig. 2a) and mapped to previous annotations. b, Neuronal diversity in the DLPFC includes neurons from the various cortical layers. UMAPs of neuronal subtypes colored by predicted cortical layers according to a classifier applied to annotated RNA profiles from the Allen Brain Atlas (Methods). c, Spatial transcriptomics using the Visium platform highlights layers in DLPFC slices using cortical neuronal markers (RORB, CUX2, TOX, PVALB). d, Proportion of SST GABAergic neuronal subtype varies in relation to cognitive decline. Box plots of the proportions of three GABAergic subtypes (out of total GABAergic neurons) are shown across the four major archetypes of the aging population: reference group, resilient, clinical and pathological AD, and clinical AD only (n = 24 independent samples, 6 per group). For box plots, the bottom and upper borders show the first and third quartiles. The central line indicates the median. The whiskers are extended to the extrema values (without accounting for outliers). Dots show individual samples.
Fig. 3 |
Fig. 3 |. Diverse cell states of glial and endothelial cells in the aging DLPFC.
a,d,h, Diversity of non-neuronal cell states in the aging DLPFC. UMAP embedding of microglia with 2,837 nuclei (a), astrocytes with 29,486 nuclei (d) and endothelia with 2,296 nuclei (h), colored by clusters capturing distinct cell states. b,e, Dot plots of the z-scored mean expression level in expressing nuclei (color) and percentage of expressing nuclei (circle size) of selected marker genes (columns) across microglial (b) or astrocyte (e) subsets (rows). c,f,i, Enriched pathways (hypergeometric test, FDR-adjusted p-value < 0.05, blue color) in up-regulated gene signatures for each subset of microglial (c), astrocyte (f) or endothelial (i) nuclei (columns). g, Spatial transcriptomics using the Visium platform showing the position of Ast.3 cells by marker gene ID3 and reactive astrocytes marker GFAP. Oligodendrocyte marker MBP marks the white matter border. Bottom right, schematic annotation of the tissue. Additional tissues and genes are shown in Extended Data Fig. 5. j, Continuum of expression programs in oligodendrocyte cells inferred by topic modeling. For each topic model panel: UMAP embedding of oligodendrocyte cells, colored by the weight of each topic per cell (right); the top scoring genes (colored by the score), computed as the Kullback–Leibler (KL) divergence between the expression level and the topic’s weight across cells (red color scale, left); and the cumulative distribution function of topic weights for cells split by the sample of origin to four major archetypes of the aging population (as in Fig. 2d).
Fig. 4 |
Fig. 4 |. Proportions of cell subsets are associated with AD traits in a cohort of 638 individuals.
a, Scheme of the CelMod algorithm. Input: snRNA-seq-derived signatures of cell types and subsets and expression programs, as well as their proportions across individuals. A two-step algorithm estimates cell subset proportions in bulk RNA-seq samples, training on matching samples using a fivefold cross-validation approach (Methods). b, CelMod estimated cell subset proportions (y axis) match snRNA-seq measured proportions (x axis) (n = 24 independent samples; additional subsets and cell types in Extended Data Fig. 6a,b). R, Spearman correlation. c, Spearman correlations of the CelMod estimated proportions and the snRNA-seq measured proportions for each cell subset (n = 24 individuals). d, Validations of CelMod in an independent dataset. Correlations of CelMod estimated proportions and snRNA-seq from a published dataset are shown. e, Immunohistochemistry in DLPFC sections of 48 individuals (24 healthy, 24 with cognitive decline), stained for markers for neurons (anti-NeuN, top) and reactive astrocytes (anti-GFAP, bottom). Left, representative immunofluorescence images. DAPI, nuclei. Scale bar, 100 μm. Right, Pearson correlation coefficients of CelMod and immunofluorescence-based estimations of proportions (out of the total number of cells) for all neurons and for GFAP+ astrocytes (Ast.2, Ast.3). f, Correlations of bulk cortica protein expression levels to CelMod estimates and to bulk RNA-seq in n = 196 individuals. gi, Association scores for the CelMod estimated proportions of all cell subsets (cell subtypes, states or topic models) to cognitive decline rate (g, x axis), tangle burden (h, x axis) and β-amyloid burden (i, x axis). Association score = −log(FDR) × sign(β), from multivariable linear regression analysis (Methods; n = 638 independent samples). Positively (purple) or negatively (turquoise) associated subsets are colored when statistically significant (FDR < 0.01). j, Correlation (color scale) of proportions of cell subsets from snRNA-seq to cognitive decline (n = 24 independent samples). Associations to additional AD traits in Extended Data Fig. 6g. k, Correlation (color scale) of protein levels (rows) to rate of cognitive decline, β-amyloid burden and tangle burden measured in n = 400 individuals. **FDR < 0.01. Left bar, direction of association of the CelMod estimated proportion with the traits (purple, positive; turquoise, negative).
Fig. 5 |
Fig. 5 |. Covariation structure of cell subset proportions across 638 individuals.
a,b, Proportions of cell subsets across individuals in astrocytes and microglia. The frequency (out of total cells in the class, color scale) of each cell subset (columns) in each individual (rows): from snRNA-seq (n = 24, in a) or CelMod estimations (n = 638, in b). The cell subsets in b are ordered as in a. c, Scatter plots of selected pairs of cell subsets from different cell classes, showing high correlations between proportions of subsets (n = 638). d,e, Coordinated changes in proportions of cell states and subtypes across individuals. A heatmap of the pairwise Spearman’s correlation coefficients of the proportions of all cell states and subtypes across 24 individuals (snRNA-seq measurements, d) and in 638 individuals (CelMod estimated proportions, e). We found a structure of mixed correlated and anti-correlated cellular subsets of mixed cell types. f, CelMod estimated pairwise correlations of cellular populations (n = 638 individuals) match the snRNA-seq measurements (n = 24 individuals). Similarity between the two correlation matrices (in d and e) is statistically significant (P = 0.001, by permutation test, one-sided; Methods). Histogram of the distribution of similarity scores (Jennrich’s test) of correlation matrices in 10,000 random permutations of the cellular frequencies independently per cell type. Red, similarity score of the true matrices in d and e.
Fig. 6 |
Fig. 6 |. Multicellular communities exist in the aging DLPFC brain region.
a, Scheme of the computational framework for estimating multicellular communities: proportions of cell subsets across individuals within each cell type are calculated and combined, and pairwise correlations between all cellular subsets are computed. A multicellular network is derived from the pairwise correlations, associated with AD traits by statistical analysis, and connected components are annotated as cellular communities (Methods). b, A network of cellular subsets reveals coordinated variation across individuals in multiple cell types. Network of coordinated and anti-coordinated cell subsets (nodes). Edges between pairs of subsets with statistically significant correlated proportions across individuals (R > 0.4, two-sided P value threshold = 0.05, solid red line) or anti-correlated (R < −0.4, dashed blue line) based on CelMod proportions (n = 638). snRNA-seq-based network is shown in Extended Data Fig. 7b. Nodes are colored by the cell type and numbered by the subset as in Figs. 2a and 3a,d,h. c, Correlation patterns of proteomic expression of signature genes across cell subsets match CelMod estimates. For selected cell subsets, pairwise correlations of snRNA-seq proportions (n = 24, left), CelMod proportions (n = 638, middle) and average protein expression levels of signature genes (n = 400, right). df, Cellular communities are linked to AD-associated traits. Cellular network (as in b) of coordinated and anti-coordinated cell subsets (nodes), colored by the associations (multivariable linear regression, FDR 0.01) with AD traits (purple, positive; green, negative association; gray, nonsignificant) for: cognitive decline (d), tangles burden (e) and β-amyloid burden (f). Bottom, each bar represents the connectivity score (no. of positive edges − no. of negative edges)/potential edges between groups of cells according to their association to each trait, showing that cell subsets associated with AD traits are highly connected in the network. Statistical significance for the connectivity score was calculated based on random permutations (one-sided, not adjusted) (Methods): *P = 0.05, **P = 0.01. a, amyloid load; c, cognitive decline; t, tangles load; neg, negatively associated; pos, positively associated; neutral, not associated.
Fig. 7 |
Fig. 7 |. The cellular environment of the AD and the cognitively nonimpaired brains.
a, Shared pathways within the cognitive decline community. Enriched pathways (hypergeometric test, FDR Q < 0.05) in up-regulated genes within each cell subset, shared between at least three subsets within the community. Pathways clustered by shared genes (Methods). Nonimpaired community shared pathways are shown in Extended Data Fig. 7d. b, Increased LRPs between cell subsets of the cognitive decline community compared with the nonimpaired community. For each pair of cell subsets, showing the number of LRPs (colorbar, row, ligand; column, receptor) that are expressed (left) or differentially expressed in at least one of the subsets (right). Top and side bars, positive (purple) or negative (turquoise) association with cognitive decline, and the number of expressed LRPs (color scale). c, Examples of community-specific LRPs. For each LRP, marking the association to each pair of cell subsets with the cognitive decline community (purple) or the cognition nonimpaired community (turquoise) or no-association (gray). LRPs are associated to a community if the ligand and its receptor are positively differentially expressed in cell subsets within one community compared with the other. d, A scheme of underlying assumptions and four possible scenarios of the cell subset causal relationship with AD pathology and cognitive decline assessed by mediation analysis. e, Mediation analysis results showing that tau pathology burden is predicted to be upstream of changes in proportions of Inh.3, Oli.1, Ast.4 and End.2. Colored by cell type, the arrow indicates the direction of change in proportion in association with cognitive decline and tangles burden. Full results are shown in Extended Data Fig. 8c. f, Mediation analysis results showing effect of changes in proportions of Inh.3, Oli.1, Ast.4 and End.2 on cognitive decline independent of tau pathology burden. Colors and arrows as in e. Full results are shown in Extended Data Fig. 8d. g, A scheme of our proposed model of multicellular communities of the aging DLPFC brain region and their associations with AD traits. Cellular networks (as in a), nodes colored by the community assignments. The statistically significant enriched associations to AD traits (hypergeometric P value) are marked next to the graph.

References

    1. Mostafavi S et al. A molecular network of the aging human brain provides insights into the pathology and cognitive decline of Alzheimer’s disease. Nat. Neurosci 21, 811–819 (2018). - PMC - PubMed
    1. Wan Y-W et al. Meta-analysis of the Alzheimer’s disease human brain transcriptome and functional dissection in mouse models. Cell Rep. 32, 107908 (2020). - PMC - PubMed
    1. Mathys H et al. Single-cell transcriptomic analysis of Alzheimer’s disease. Nature 570, 332–337 (2019). - PMC - PubMed
    1. Del-Aguila JL et al. A single-nuclei RNA sequencing study of Mendelian and sporadic AD in the human brain. Alzheimers Res. Ther 11, 71 (2019). - PMC - PubMed
    1. Grubman A et al. A single-cell atlas of entorhinal cortex from individuals with Alzheimer’s disease reveals cell-type-specific gene expression regulation. Nat. Neurosci 22, 2087–2097 (2019). - PubMed

Publication types