. 2023 Jul;4(7):1001-1015.
doi: 10.1038/s43018-023-00573-4. Epub 2023 Jun 19.

c-Kit signaling potentiates CAR T cell efficacy in solid tumors by CD28- and IL-2-independent co-stimulation

Affiliations

c-Kit signaling potentiates CAR T cell efficacy in solid tumors by CD28- and IL-2-independent co-stimulation

Yuquan Xiong et al. Nat Cancer. 2023 Jul.

Abstract

The limited efficacy of chimeric antigen receptor (CAR) T cell therapy for solid tumors necessitates engineering strategies that promote functional persistence in an immunosuppressive environment. Herein, we use c-Kit signaling, a physiological pathway associated with stemness in hematopoietic progenitor cells (T cells lose expression of c-Kit during differentiation). CAR T cells with intracellular expression, but no cell-surface receptor expression, of the c-Kit D816V mutation (KITv) have upregulated STAT phosphorylation, antigen activation-dependent proliferation and CD28- and interleukin-2-independent and interferon-γ-mediated co-stimulation, augmenting the cytotoxicity of first-generation CAR T cells. This translates to enhanced survival, including in transforming growth factor-β-rich and low-antigen-expressing solid tumor models. KITv CAR T cells have equivalent or better in vivo efficacy than second-generation CAR T cells and are susceptible to tyrosine kinase inhibitors (safety switch). When combined with CD28 co-stimulation, KITv co-stimulation functions as a third signal, enhancing efficacy and providing a potent approach to treat solid tumors.


Conflict of interest statement

Y.X. and P.S.A. have a pending patent application on the KITv mutation as a costimulatory domain to use in T cells. P.S.A. declares research funding from ATARA Biotherapeutics and Novocure; Scientific Advisory Board Member and Consultant for Adjuvant Genomics, ATARA Biotherapeutics, Abound Bio, Bio4t2, Carisma Therapeutics, Imugene, ImmPactBio, Johnston & Johnston, Link Immunotherapeutics, Orion pharma, Outpace Bio, Pluri-biotech, Putnam associates, Verismo Therapeutics; Patents, royalties, and intellectual property on MSLN-targeted CAR and other T-cell therapies licensed to ATARA Biotherapeutics, issued patent method for detection of cancer cells using virus, and pending patent applications on PD-1 dominant negative receptor, wireless pulse-oximetry device, and an ex vivo malignant pleural effusion culture system. All other authors do not have competing interests to disclose. Memorial Sloan Kettering Cancer Center has licensed intellectual property related to MSLN-targeted CARs and T-cell therapies to ATARA Biotherapeutics and has associated financial interests.

Figures

Extended Data Fig. 1
Extended Data Fig. 1. Mz-KITv and M28z-KITv CAR T cells show relatively lower levels of PD1 expression.
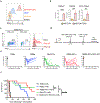
a, Proportion of PD1+ cells in CD4 and CD8 CAR T cells after stimulation with antigen-expressing (MSLN+) target cells (n=5 biological replicates; two-tailed paired t test **p=0.0018, M28z vs. Mz-KITv; ***p=0.0009, M28z vs. M28z-KITv in CD4 T cells; and **p=0,0013, M28z vs. M28z-KITv; **p=0.0075, M28z vs. Mz-KITv for CD8 T cells). b, Proportion and kinetics of PD1+ cells in CD4 and CD8 CAR T cells upon stimulation with MSLN+ target cells every four days, as indicated by arrows. All data shown are mean ± standard deviation and are representative of three independently repeated experiments with at least three independent donors.
Extended Data Fig. 2:
Extended Data Fig. 2:. Long-term functional persistence of M28z-KITv CAR T cells.
Mice were initially established with A549-M lung cancer metastatic tumor and treated with a single dose (1 × 10⁵) of M28z-KITv CAR T cells. After tumor eradication for 122 days, confirmed by multiple tumor bioluminescence imaging (BLI), mice were rechallenged with intraperitoneal (i.p) injection of 1 × 10⁶ A549-M cells on day (d) 123 after initial CAR T-cell treatment, and tumor burden was monitored with BLI (n=4 mice).
Extended Data Fig. 3:
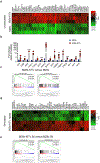
Extended Data Fig. 3:. KITv CAR T cells have molecular expression profiles associated with potent cytotoxic activity.
Mesothelin (MSLN)–targeted M28z and M28z-KITv CD8+ CAR T cells alone (unstimulated) or cocultured (stimulated) with MSLN-expressing 3T3-M cells for 24 hours (M28z Sti and M28z-KITv Sti) were collected, and their gene expression profiles were analyzed by RNA-seq analysis. a, Heat maps of the top 50 differentially expressed genes between unstimulated M28z and M28z-KITv CAR T cells. b, Individual gene expression of AP-1-bZip and IRF gene family members from the bulk RNA-seq analysis in unstimulated M28z (blue) and M28z-KITv (red) CAR T cells. Data are mean ± standard deviation from three samples across three different donors (*p<0.05; **p<0.01; ***p<0.001) determined by multiple t tests. c, Gene-set enrichment analysis, comparing the gene expression of M28z-KITv and M28Z CAR T cells for JAK-STAT3 and IL2-STAT5 gene sets. d, Heat maps of the top 50 differentially expressed genes between M28z Sti and M28z-KITv Sti CAR T cells. e, Gene-set enrichment analysis for the expression profiles of stimulated M28z-KITv Sti compared with M28z Sti CAR T cells for IFN-α and IFN-γ gene sets. Nominal p values and false-discovery rate q values are indicated.
Extended Data Fig. 4:
Extended Data Fig. 4:. Dasatinib inhibits CAR T-cell cytotoxicity without affecting viability in vitro.
a, M28z-KITv CAR T cells were cultured in the presence or absence of dasatinib for 72 h. Target-cell viability was monitored by flow cytometry. The experiment was performed twice, and a representative example is shown. b, Luciferase-based cytotoxicity assay assessing M28z KITv CAR T-cell killing at 18 h when cocultured with ffLuc-expressing, mesothelin-positive target cells in the presence or absence of dasatinib (n=3 technical replicates). The experiment was performed three times, and a representative example is shown.
Extended Data Fig. 5:
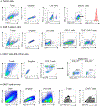
Extended Data Fig. 5:. Representative gating strategy used for flow cytometry analysis.
a, Tumor cells gating strategy corresponding to data shown in Figures 1d, 2e, 4b, and 4h. b, CAR T cells in vitro gating strategy corresponding to data shown in Figure 1e, h, and j. c, IFN-γ KO CAR T cells in vitro gating strategy corresponding to data shown in Figure 3c. d, CAR T cells in vivo gating strategy corresponding to data shown in Figure 6d.
Fig. 1:
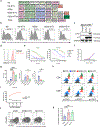
Fig. 1:. KITv CAR T cells demonstrate constitutive STAT phosphorylation and higher antigen-specific target-cell lysis in vitro.
a, Schematic of the retroviral vector (SFG) encoding CARs targeting mesothelin (MSLN) or prostate-specific membrane antigen (PSMA), linked with or without an intracellular fragment of c-Kit or c-Kit D816V (KITwt or KITv). A c-myc-tag or ΔLNGFR is included for the detection of CARs. b, Representative flow cytometry histogram plots of transduced T cells, showing percentage of CAR expression. c, Western blot of phosphorylated (p-KIT) and unphosphorylated (KIT) c-Kit level in KITv CAR T-cell lysates. GAPDH is used as loading control. M28z and M28z CAR T cells transduced with wild-type c-KIT (KITwt) served as controls. d, MSLN expression level of MSTO-M (mesothelioma) cells by flow cytometry. e, Specific lysis of ffLuc-expressing MSLN+ target cells by indicated CAR T cells from luciferase-based cytotoxicity assay performed at 4 and 18 h (n=3 technical replicates; data representative of six independent experiments performed with two independent donors). f, Cumulative cell counts of indicated CAR T cells upon stimulation with MSLN+ target cells every 4 days (n=3 technical replicates; data representative of three independent experiments). g, After 18 h of coculture of respective CAR T cells with antigen (MSLN)–expressing target cells, released IFN-γ, TNF-α, and IL-2 as measured by Luminex assay are shown (n=6; three biological replicates with two technical replicates each; two-tailed unpaired t test ****p<0.0001, *p=0.0178, *p=0.02, **p=0.008). h, Comparative flow cytometric plot, showing the expression of p-STAT1, p-STAT3, and p-STAT5 in CD4+ and CD8+ CAR T cells. Untransduced (UTD) and M28z CAR T cells serve as controls. i, Specific lysis of ffLuc-expressing MSLN+ target cells by M28z KITv CAR T cells in the presence or absence of STAT 3/5 inhibitor after 18 h of coculture (n=3 technical replicates; data representative of two independent experiments). j, Representative flow cytometry density plots showing expression of CD45RA and CD62L in indicated CAR T cells. k, Relative frequency of memory (CD45RA+CD62L+) in CD8+ CAR T cells (n=4 independent donors; two-tailed paired t test *p=0.0346, **p=0.0060). Data are shown as mean or mean ± standard deviation.
Fig. 2:
Fig. 2:. KITv CAR T cells show potent antitumor efficacy in mesothelioma and lung cancer models in vivo.
a-c, Orthotopic pleural mesothelioma–bearing mice were treated with CAR T cells. a, Schematic of the orthotopic pleural mesothelioma CAR T-cell therapy. Pleural mesothelioma was established by intrapleural (i.p) administration of mesothelin (MSLN)–expressing cancer cells (8 × 10⁵). At 10 days after establishment of tumor, cohorts of mice with equivalent tumor burden were treated with a single dose (5 × 10⁴) of respective CAR T cells (i.p). b, Kinetics of tumor growth tracked by bioluminescence imaging (BLI) after CAR T-cell treatment (P28z, n=6; M28z and M28z-KITv, n=10 each; Mz-KITv, n=9; Mz, n=8 mice per cohort). c, Kaplan-Meier survival analysis of data shown in b. Data analysis was performed using a one-sided log-rank Mantel-Cox test; *p=0.0144, Mz-KITv vs. Mz; *p=0.029, M28z-KITv vs. Mz-KITv; **p=0.0028, M28z-KITv vs. Mz; N.S. p=0.5947, M28z vs. M28z-KITv. d-g, Metastatic lung cancer xenograft–bearing mice were treated with MSLN-targeted CAR T cells. d, Schematic of the metastatic lung cancer xenograft model treated with CAR T cells intravenously (i.v). Antigen (MSLN)–expressing A549-M cancer cells (1×10⁶) were administered by tail-vein injection. At 20 days after establishment of tumor, cohorts of mice with equivalent tumor burden were treated with a single dose (1 × 10⁵) of respective CAR T cells (i.v). e, MSLN overexpression by A549-M cells demonstrated by flow cytometry. f, kinetics of tumor growth tracked by BLI after CAR T-cell treatment (n=6 mice for the P28z group, n=8 mice per group for the other groups). g, Kaplan-Meier survival analysis of data shown in f. Data analysis was performed using a one-sided log-rank Mantel-Cox test; **p=0.009, M28z vs. Mz-KITv; ***p=0.0003, M28z-KITv vs. Mz-KITv; ****p<0.0001, M28z vs. M28z-KITv. h, Plasma cytokine levels from mice at day 10 after CAR T-cell infusion (n=4 mice per group). Data displayed as mean ± standard deviation and statistical analysis determined by one-way ANOVA; ***p=0.0001, ****p<0.0001. Data shown in b and f are representative of three independently repeated experiments with at least three independent donors.
Fig. 3:
Fig. 3:. KITv costimulation enhances the antitumor activity of CAR T cells in a TGF-β–rich tumor microenvironment.
a-f, Mice with orthotopic pleural mesothelioma tumor overexpressing TGF-β treated with CAR T cells. a, TGF-β expression level as measured by flow cytometry in lung cancer (A549) and mesothelioma (MSTO-M and MSTOM-TGFβ) cells. b, TGF-β protein levels in culture medium (n=3 technical replicates), plasma (n=4 biological replicates), or tumor tissue (n=4 tumors for MSTO-M and n=5 tumors for MSTOM-TGFβ group) collected from mice with equivalent tumor burden. Data shown are mean ± standard deviation, and analysis was performed using a two-tailed unpaired t test; ****p<0.0001, ***p=0.0002, **p=0.0023. c, Representative flow cytometric plot showing the expression of IFN-γ in IFNγ wild-type (WT) and IFNγ knock-out (KO) M28z-KITv CAR T cells after 18 h of coculture with antigen-expressing MSTO-M target cells. d, Schematic of the TGF-β–overexpressing mesothelioma CAR T-cell therapy. At 10 days after establishment of orthotopic pleural mesothelioma with MSTOM-TGFβ cells, cohorts of mice with equivalent tumor burden were treated with a single dose (1 × 10⁵) of respective CAR T cells intrapleurally (i.p). e, Kinetics of tumor growth tracked by bioluminescence imaging (BLI) after CAR T-cell treatment (n=6 mice for the P28z group, n=8 mice per group for the other groups). f, Kaplan-Meier analysis of data shown in e. Data analysis was performed using a one-sided log-rank Mantel-Cox test; **p=0.0075, M28z vs. M28z-KITv; *p=0.039, M28z vs. Mz-KITv; ****p<0.0001, M28z-KITv vs M28z-KITv IFNγ KO. Data shown are representative of three independently repeated experiments with three independent donors.
Fig. 4:
Fig. 4:. KITv potentiates the antitumor efficacy of CAR T cells against low-antigen (MSLN+) lung cancer targets.
a, M28z and M28z-KITv CAR T cells were stimulated by coculture with mesothelin (MSLN)–expressing target cells for 5 min, and p-ERK and p-CD3ζ levels were measured by flow cytometry. b, MSLN-expression level of A549 cells measured by flow cytometry. c, 51Cr-release cytotoxicity assay of CAR T cells. Low-antigen-expressing A549 target cells were labelled with 51Cr and cocultured with respective CAR T cells at multiple E:T ratios. Cytotoxicity at 18 h was measured by 51Cr-release (n=3 technical replicates; data representative of six independent experiments performed with three independent donors). d-g, Low-antigen-expressing A549 tumor–bearing mice were treated with CAR T cells. d, Schematic of the metastatic lung cancer xenograft model treated with CAR T cells. At 20 days after establishment of tumor, mice were treated intravenously (i.v) with a single dose (5 × 10⁵) of CAR T cells. e, Kinetics of tumor growth tracked by bioluminescence imaging (BLI) after CAR T-cell treatment (P28z and Mz, n=5; M28z and M28z-KITv, n=8 each; Mz-KITv, n=9; mice were selected and sorted into cohorts with equivalent tumor burden as determined by BLI). f, Kaplan-Meier survival analysis of data shown in e. Data analysis was performed using a one-sided log-rank Mantel-Cox test; **p=0.0024, M28z-KITv vs. Mz-KITv; **p=0.0074, M28z vs. Mz-KITv; ****p<0.0001, M28z vs. M28z-KITv. g, Plasma cytokine levels of mice at day 10 after CAR T-cell infusion (n=4 mice per group). Data shown are mean ± standard deviation and analyzed by one-way ANOVA (**p=0.002, M28z vs. M28z-KITv; **p=0.009, M28z-KITv vs. Mz-KITv). Data shown in e and g are representative of three independently repeated experiments with at least two independent donors.
Fig. 5:
Fig. 5:. KITv potentiates the antitumor efficacy of CAR T cells against low-antigen (MSLN+) mesothelioma cancer targets, without cytotoxicity against mesothelial cells.
a, MSLN-expression level of MSTO-M cells (high antigen), MSTO-Mlow cells (low antigen), or human pleural mesothelial Met5A cells (very low antigen) as measured by flow cytometry. b, Control nonantigen-targeted P28z, antigen-targeted M28z, and M28z-KITv CAR T cells were cocultured with MSTO-M, MSTO-Mlow, or Met5A cells for 48 h. Target cell viability was monitored by flow cytometry (n=3 technical replicates). Data shown are mean ± standard deviation, and analysis was performed using one-way ANOVA; ****p<0.0001, MSTO-M; **p=0.0031, MSTO-Mlow P28z vs. M28z-KITv; **p=0.0062, MSTO-Mlow M28z vs. M28z-KITv. c, Schematic of the orthotopic pleural mesothelioma model. Mice were established with intrapleural (i.p) administration of MSTO-Mlow (8 × 10⁵) cells. At 10 days after establishment of tumor, mice were treated with a single dose (5 × 10⁵) of CAR T cells administered intrapleurally (i.p). d, Kaplan-Meier analysis of survival of mice. Data analysis was performed using a one-sided log-rank Mantel-Cox test (****p<0.0001). Data shown in b and d are representative of two independently repeated experiments.
Fig. 6:
Fig. 6:. KITv enhances the antitumor efficacy of prostate-specific membrane antigen (PSMA)–targeting CAR T cells.
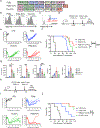
a, Schematic of the retroviral vector (SFG) encoding CARs targeting PSMA, with CD28 costimulatory domain linked with LNGFR (P28z) or KITv (P28z-KITv) and a first-generation CAR targeting PSMA linked with KITv (Pz-KITv). A c-myc-tag is included for the detection of CARs. b, Representative flow cytometry histogram plots of transduced T cells, showing percentage of CAR expression. c, PSMA-expression levels of A549-P and PC3-P cells were measured by flow cytometry. d-g, A549-P tumor–bearing mice were treated with CAR T cells. d, Schematic of the metastatic cancer xenograft model treated with CAR T cells intravenously (i.v). e, Kinetics of tumor growth tracked by bioluminescence imaging (BLI) after CAR T-cell treatment (n=6 mice treated with untransduced [UTD] T cells, n=8 mice treated for the other groups; mice were selected and sorted into cohorts with equivalent tumor burden as determined by BLI). f, Kaplan-Meier survival analysis of data shown in e. Data analysis was performed using a one-sided log-rank Mantel-Cox test; *p=0.0406, P28z-KITv vs. Pz-KITv; ***p=0.0004, P28z vs. P28z-KITv; ***p=0.0005, P28z vs. Pz-KITv. g, Plasma cytokine levels of mice at day 10 after T-cell infusion (n=4 mice per group). Data shown are mean ± standard deviation and analysis was performed using one-way ANOVA; *p=0.0279, IFN-γ P28z vs. Mz-KITv; ***p=0.0003, IFN-γ P28z vs. P28z-KITv; ****p<0.0001, IL-10 P28z vs. P28z-KITv; ***p=0.0004, IL-2 P28z vs. Pz-KITv; *p=0.0277, IL-2 P28z vs. P28z-KITv. h-I, PC3-P tumor–bearing mice were treated with untransduced or CAR T cells. h, Schematic of the metastatic prostate cancer xenograft model treated with CAR T cells intravenously (i.v). i, Kinetics of tumor BLI (n=5 mice for the P28z group, n=6 mice per group for the other groups; mice with equivalent tumor burden as determined by BLI before treatment were selected and sorted into cohorts). j, Kaplan-Meier survival analysis of data shown in i. Data analysis was performed using a one-sided log-rank Mantel-Cox test; *p=0.0169, P28z vs. P28z-KITv; *p=0.0372, P28z vs. Pz-KITv. UTD, untransduced. All data shown are representative of at least two independently repeated experiments.
Fig. 7:
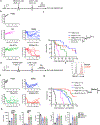
Fig. 7:. M28z-KITv CAR T cells are susceptible to tyrosine kinase inhibitors (TKIs) in vivo.
a, Schematic of mice with orthotopic pleural mesothelioma treated with M28z-KITv CAR T cells regionally (d-14; intrapleurally [i.p]) or systemically (d-10; intravenously [i.v]), followed by daily oral administration of TKI after receiving CAR T cells. b, Kinetics of tumor growth tracked by bioluminescence imaging (BLI) after treatment with M28z KITv CAR T cells administered intrapleurally or intravenously. After administration of M28z-KITv CAR T cells, mice received no drug (n=3 mice) or either dasatinib or midostaurin (n=5 mice per cohort). c, Kaplan-Meier survival analysis of data shown in b. Data analysis was performed using a one-sided log-rank Mantel-Cox test; **p=0.0017, intravenous no drug vs. dasatinib; **p=0.002, intravenous no drug vs. midostaurin; **p=0.0042, intravenous no drug vs. P28z KITv; *p=0.0123, intrapleural no drug vs. dasatinib; *p=0.0169, intrapleural no drug vs. midostaurin. Data shown in b and c are representative of three independently repeated experiments with at least two donors. d, Flow cytometric analysis quantifying the number of CAR T cells in the harvested tumors at day 3 (n=3 tumors for no-drug group, n=4 tumors for dasatinib group, n=5 tumors for midostaurin group). Data shown are mean ± standard deviation, and analysis was performed using one-way ANOVA; ****p<0.0001, no drug vs. dasatinib; **p=0.0035, no drug vs. midostaurin.

References

    1. Sadelain M, Rivière I & Riddell S Therapeutic T cell engineering. Nature 545, 423–431 (2017). - PMC - PubMed
    1. Cappell KM & Kochenderfer JN A comparison of chimeric antigen receptors containing CD28 versus 4–1BB costimulatory domains. Nat Rev Clin Oncol 18, 715–727 (2021). - PubMed
    1. Grosser R, Cherkassky L, Chintala N & Adusumilli PS Combination immunotherapy with CAR T cells and checkpoint blockade for the treatment of solid tumors. Cancer Cell 36, 471–482 (2019). - PMC - PubMed
    1. Kosti P, Maher J & Arnold JN Perspectives on chimeric antigen receptor T-cell immunotherapy for solid tumors. Front Immunol 9, 1104 (2018). - PMC - PubMed
    1. Guedan S et al. Single residue in CD28-costimulated CAR-T cells limits long-term persistence and antitumor durability. J Clin Invest 130, 3087–3097 (2020). - PMC - PubMed

Publication types

MeSH terms

LinkOut - more resources